

Floating Mean Reversal Equity Indicator
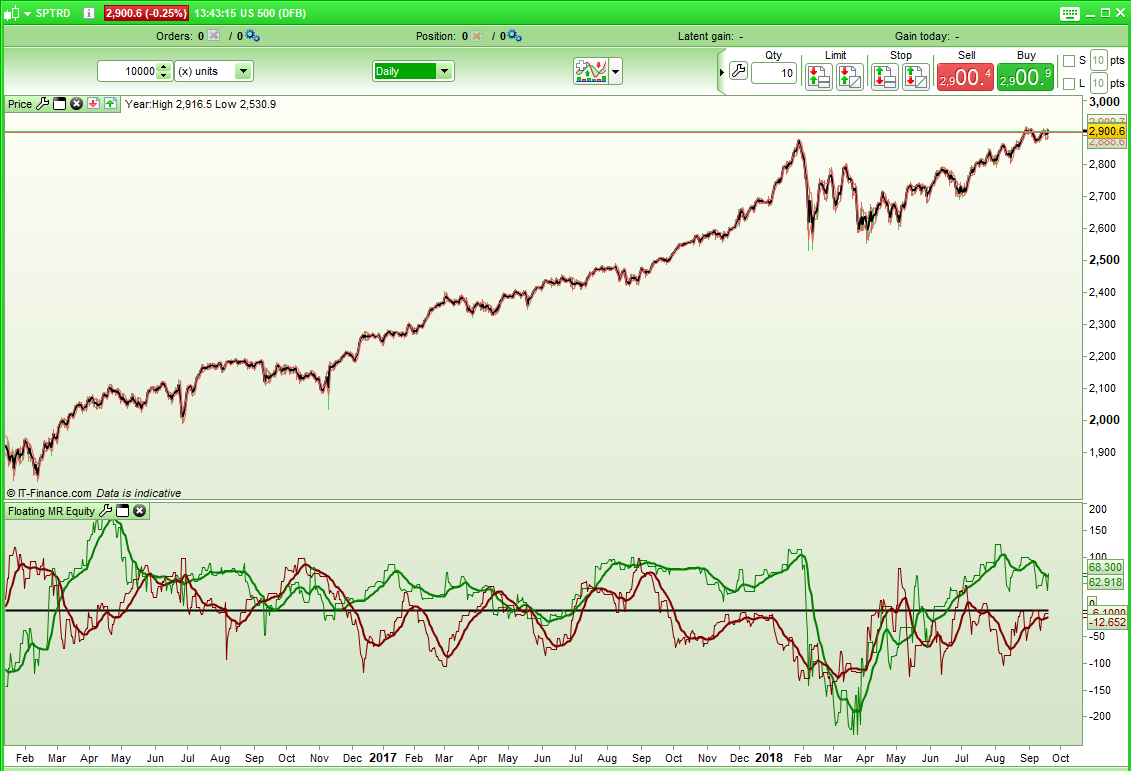
This indicator creates two equity curves of the last twenty long and last 20 short trades. It is based on the simple mean reversal theory of buying if the candle is a red candle and selling if the candle is a green candle and then closing the trade one candle later.
A weighted average of the equity curves is also plotted to assist with analysis.
Each equity curve gives us an indication of recent market conditions.
For example if looking for long trades:
- If the green equity curve is below zero then the last twenty trades would have resulted in an overall loss and this indicates that buying on dips has not worked well recently.
- If the green equity curve is rising or is above the green weighted average then this indicates that buying on dips has worked better than average recently.
- If the green equity curve is above the red equity curve then this shows that going long on dips has been working better than going short on rises recently.
- If the green equity curve crosses over the red equity curve it may be an indication that market direction is changing.
Obviously when looking for short trades apply the same rules to the red equity curve and red average.
As the simulated trades are only one candle long this indicator works better on longer time frames such as daily or weekly to give an overall feel of market sentimentality. When used on weekly time frames it can be used as an overall filter to decide whether you should be putting your trading efforts into going short or into going long or as an indicator of a changing market structure.
As the equity curves are based on the last 20 trades there is the usual expected lag that you inevitably get with this type of indicator.
//Floating Mean Reversal Indicator
//Created by Vonasi
//19 September 2018

lastlongtradestotal = longtrade1 + longtrade2 + longtrade3 + longtrade4 + longtrade5 + longtrade6 + longtrade7 + longtrade8 + longtrade9 + longtrade10 + longtrade11 + longtrade12 + longtrade13 + longtrade14 + longtrade15 + longtrade16 + longtrade17 + longtrade18 + longtrade19 + longtrade20

lastshorttradestotal = shorttrade1 + shorttrade2 + shorttrade3 + shorttrade4 + shorttrade5 + shorttrade6 + shorttrade7 + shorttrade8 + shorttrade9 + shorttrade10 + shorttrade11 + shorttrade12 + shorttrade13 + shorttrade14 + shorttrade15 + shorttrade16 + shorttrade17 + shorttrade18 + shorttrade19 + shorttrade20

if close[1] < open[1] then
 longtrade1 = longtrade2
 longtrade2 = longtrade3
 longtrade3 = longtrade4
 longtrade4 = longtrade5
 longtrade5 = longtrade6
 longtrade6 = longtrade7
 longtrade7 = longtrade8
 longtrade8 = longtrade9
 longtrade9 = longtrade10
 longtrade10 = longtrade11
 longtrade11 = longtrade12
 longtrade12 = longtrade13
 longtrade13 = longtrade14
 longtrade14 = longtrade15
 longtrade15 = longtrade16
 longtrade16 = longtrade17
 longtrade17 = longtrade18
 longtrade18 = longtrade19
 longtrade19 = longtrade20
 longtrade20 = (close - open)
endif

if close[1] > open[1] then
 shorttrade1 = shorttrade2
 shorttrade2 = shorttrade3
 shorttrade3 = shorttrade4
 shorttrade4 = shorttrade5
 shorttrade5 = shorttrade6
 shorttrade6 = shorttrade7
 shorttrade7 = shorttrade8
 shorttrade8 = shorttrade9
 shorttrade9 = shorttrade10
 shorttrade10 = shorttrade11
 shorttrade11 = shorttrade12
 shorttrade12 = shorttrade13
 shorttrade13 = shorttrade14
 shorttrade14 = shorttrade15
 shorttrade15 = shorttrade16
 shorttrade16 = shorttrade17
 shorttrade17 = shorttrade18
 shorttrade18 = shorttrade19
 shorttrade19 = shorttrade20
 shorttrade20 = (open - close)
endif

longave = weightedaverage[20](lastlongtradestotal)
shortave = weightedaverage[20](lastshorttradestotal)

return 0, longave coloured(0,128,0) style(line,2) as "Long Average", shortave coloured(128,0,0) style(line,2) as "Short Average" , lastlongtradestotal[0] coloured(0,128,0) style(line,1) as "Long",lastshorttradestotal[0] coloured(128,0,0) style(line,1) as "Short"