

Fibonacci Pivots Points v2 inc. custom time settings for daily
A request was made to add custom time settings to daily Fibonacci pivot points in Nicolas « Pivot Points MTF » indicator, and also to add fibo previous day’s range extensions.
– Request by FXTT on forum : https://www.prorealcode.com/topic/pivot-point-indicator/
– Version 1 by Nicolas: https://www.prorealcode.com/prorealtime-indicators/fibonacci-pivots-points-4-hours-daily-weekly-monthly/
In this version 2, kept compatible with PRTv10.3 :
– set PivotTF parameter to 0 to activate the custom time settings for daily points (other settings are modified vs version 1 into : « daily without customtime »=1, « weekly »=2, « monthly »=3, « 4h »=4)
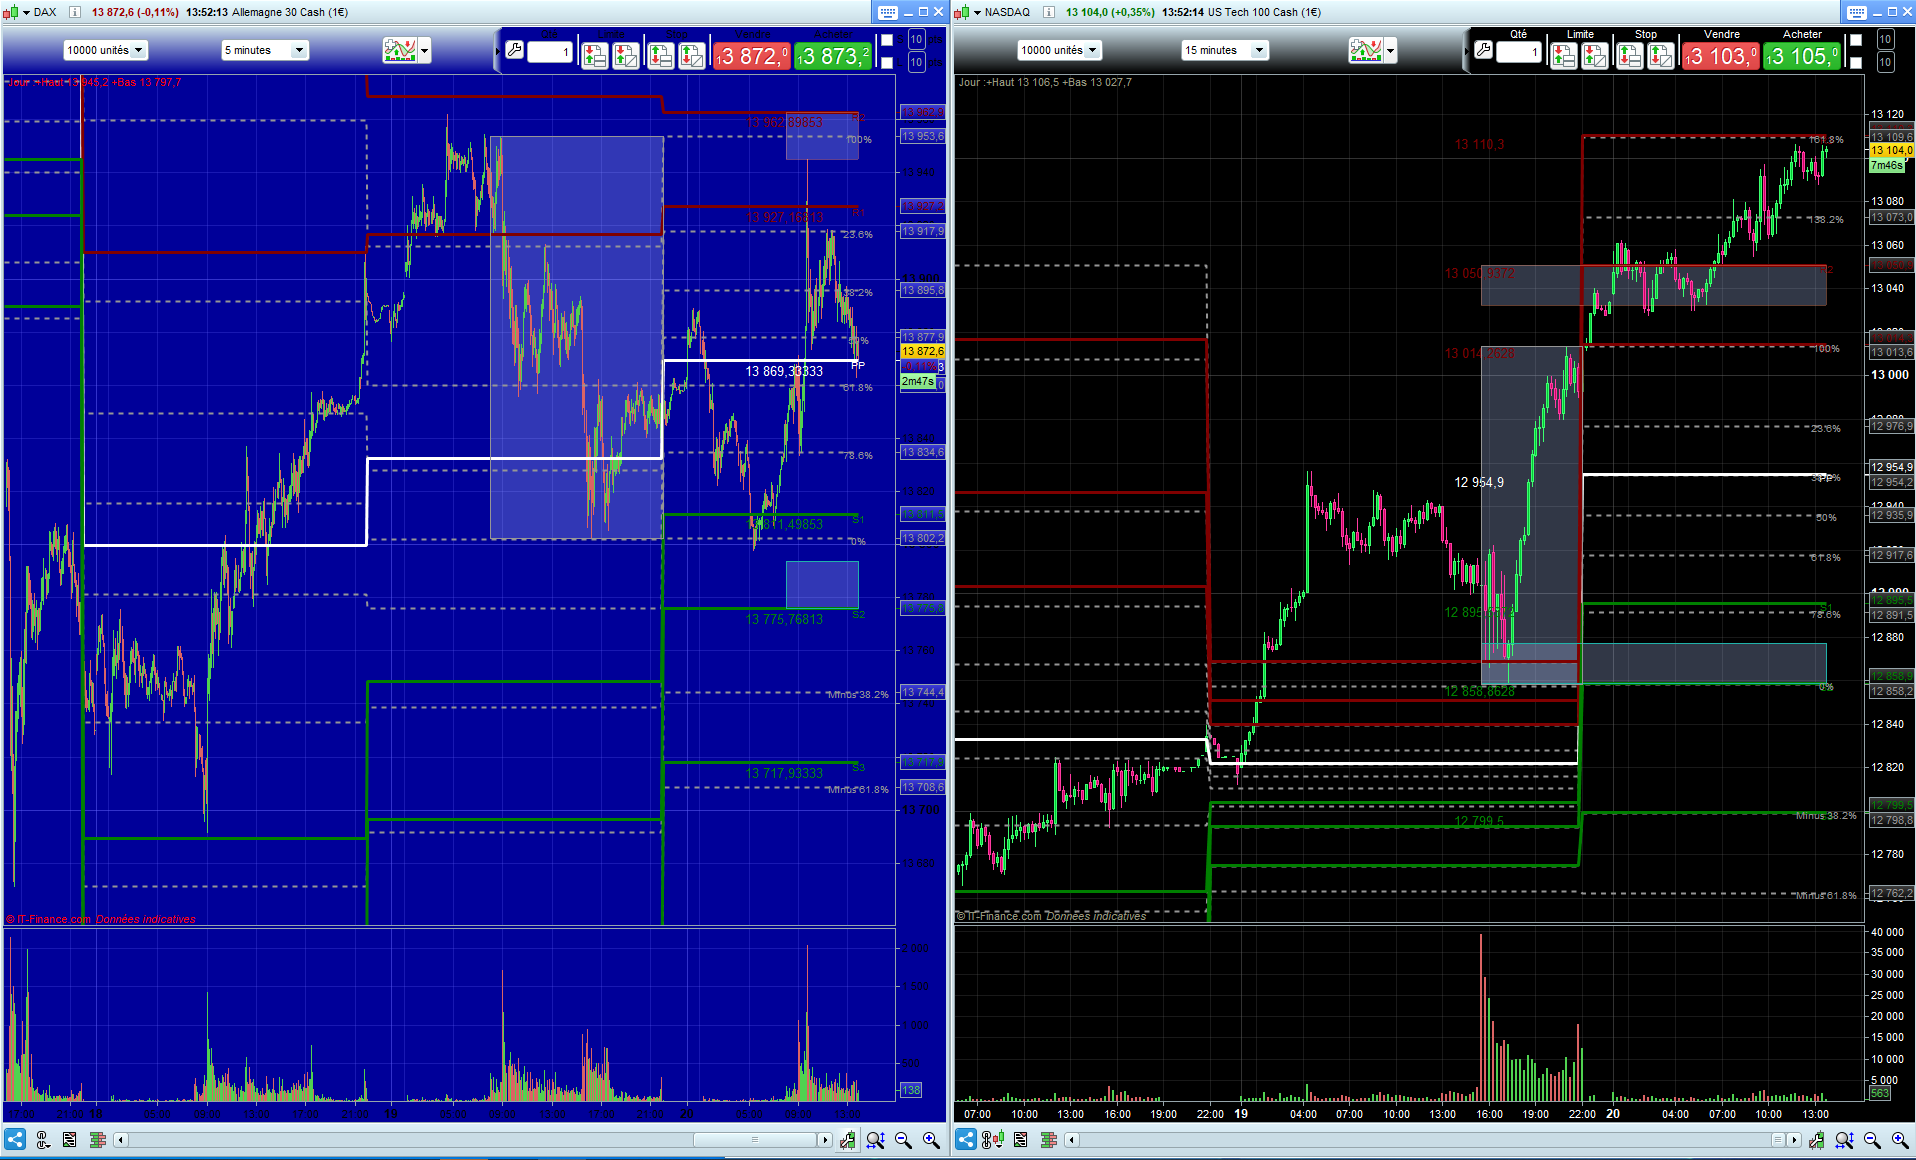
– set TimeStart and TimeFinish in HHMMSS format to what you want to replicate within your IG 24h cfd data to get the high low and close subset equivalent to Futures market, or cash even, excluding ovn data, for example 8h-22h for Dax (left side of attached picture), or 9h30-16h for Nasdaq in NY timezone, or 15h30-22h for Nasdaq in a European timezone (right side of attached picture)
– Tick « PlotFibo » box to display fibo lines as dotted lines, including the added extensions on both sides.
– the « Plotzones » box stil activates half-way between s1-s2 and r1-r2 as in version1, they horizontally shift at « timestart » in case of custom time settings, and now this box also activates a rectangle around previous day’s custom data range for visibility of it.
//PRC_PivotFibo MTF | indicator
//03.11.2017
//Nicolas @ www.prorealcode.com
// v2 mods Noobywan 19.01.2021 for FXTT request
//Sharing ProRealTime knowledge

defparam drawonlastbaronly=true

// --- settings
//PlotPivots=1
//PlotPivotsLabels=1
//PlotPivotsPrices=1
//PlotMiddle=0
//PlotFibots=1
//PlotFibotsLabel=1
//PlotZones=1
//PivotTF = 0 //0=daily with custom times (v2), 1=daily , 2=weekly , 3=monthly, 4=4 hours
//Timestart=080000 //(v2)
//Timefinish=220000 //(v2)
// --- end of settings

if (PivotTF=0 and opentime[1]<timefinish and opentime>=timefinish) then//v2
lastbar=barindex
prevfirstbar=firstbar
cclose=close[1]
hhigh=hh
llow=ll
endif
if (PivotTF=0 and opentime[1]<timestart and opentime>=timestart) then//v2
//prevfirstbar=firstbar
firstbar=barindex
hh=0
ll=close*10
endif

if intradaybarindex=0 and PivotTF>=1 then
if PivotTF=1 then
firstbar=barindex
cclose=close[1]
hhigh=hh
llow=ll
endif
hh=0
ll=close*10
endif


if PivotTF=0 or PivotTF=1 then
hh=max(hh,high)
ll=min(ll,low)
elsif  PivotTF=2 then
if DayOfWeek<DayOfWeek[1] then
hhigh = Highest[BarIndex - lastWeekBarIndex](High)[1]
llow = Lowest[BarIndex - lastWeekBarIndex](Low)[1]
cclose=close[1]
lastWeekBarIndex = BarIndex
firstbar=barindex
Endif
elsif PivotTF=3 then
If Month<>Month[1] then
hhigh = Highest[BarIndex - lastMonthBarIndex](High)[1]
llow = Lowest[BarIndex - lastMonthBarIndex](Low)[1]
cclose=close[1]
lastMonthBarIndex = BarIndex
firstbar=barindex
endif
elsif PivotTF=4 then //H4 timeframe
if minute=0 and (hour=0 or hour=4 or hour=8 or hour=12 or hour=16 or hour=20) then
hhigh = Highest[BarIndex - last4HourBarIndex](High)[1]
llow = Lowest[BarIndex - last4HourBarIndex](Low)[1]
cclose=close[0]
last4HourBarIndex = BarIndex[0]
firstbar=barindex[0]
endif
endif

if(PlotPivots) then
PP = (hhigh+llow+cclose)/3.0
R1 = PP+0.382*(hhigh-llow)
rR2 = PP+0.618*(hhigh-llow)
R3 = PP+1.000*(hhigh-llow)
S1 = PP-0.382*(hhigh-llow)
S2 = PP-0.618*(hhigh-llow)
S3 = PP-1.000*(hhigh-llow)

if(PlotMiddle) then
M0=0.5*(S2+S3)
M1=0.5*(S1+S2)
M2=0.5*(PP+S1)
M3=0.5*(PP+R1)
M4=0.5*(R1+rR2)
M5=0.5*(rR2+R3)
endif

if(PlotPivotsLabels) then
drawtext("PP",barindex,PP-2*pointsize,Dialog,Standard,10)coloured(255,255,255)
drawtext("R1",barindex,R1-2*pointsize,Dialog,Standard,10)coloured(128,0,0)
drawtext("R2",barindex,RR2-2*pointsize,Dialog,Standard,10)coloured(128,0,0)
drawtext("R3",barindex,R3-2*pointsize,Dialog,Standard,10)coloured(128,0,0)
drawtext("S1",barindex,S1-2*pointsize,Dialog,Standard,10)coloured(0,128,0)
drawtext("S2",barindex,S2-2*pointsize,Dialog,Standard,10)coloured(0,128,0)
drawtext("S3",barindex,S3-2*pointsize,Dialog,Standard,10)coloured(0,128,0)
endif
if(PlotPivotsPrices) then
drawtext("#PP#",firstbar,PP-4*pointsize,Dialog,Standard,13)coloured(255,255,255)
drawtext("#R1#",firstbar,R1-4*pointsize,Dialog,Standard,13)coloured(128,0,0)
drawtext("#rR2#",firstbar,RR2-4*pointsize,Dialog,Standard,13)coloured(128,0,0)
drawtext("#R3#",firstbar,R3-4*pointsize,Dialog,Standard,13)coloured(128,0,0)
drawtext("#S1#",firstbar,S1-4*pointsize,Dialog,Standard,13)coloured(0,128,0)
drawtext("#S2#",firstbar,S2-4*pointsize,Dialog,Standard,13)coloured(0,128,0)
drawtext("#S3#",firstbar,S3-4*pointsize,Dialog,Standard,13)coloured(0,128,0)
endif
if(PlotZones) then
drawrectangle(firstbar,rr2,barindex,(rr2+r1)/2) coloured(255,160,122,100)
drawrectangle(firstbar,s2,barindex,(s1+s2)/2) coloured(32,178,170)
if PivotTF=0 then//v2
drawrectangle(prevfirstbar,llow,lastbar,hhigh) coloured(150,150,150)//v2
endif
endif
endif

if(PlotFibots) then
f236 = (llow+(((hhigh-llow)/100)*(100-23.6)))
f382 = (llow+(((hhigh-llow)/100)*(100-38.2)))
f50  = (llow+(((hhigh-llow)/100)*(100-50)))
f618 = (llow+(((hhigh-llow)/100)*(38.2)))
f786 = (llow+(((hhigh-llow)/100)*(21.4)))
f0=llow//v2
f100=hhigh//v2
f1382 = llow+1.382*(hhigh-llow)//v2
f1618 = llow+1.618*(hhigh-llow)//v2
fm382 = llow-0.382*(hhigh-llow)//v2
fm618 = llow-0.618*(hhigh-llow)//v2
if(PlotFibotsLabel) then
drawtext("23.6%",barindex,f236-1*pointsize,Dialog,Standard,10)coloured(150,150,150)
drawtext("38.2%",barindex,f382-1*pointsize,Dialog,Standard,10)coloured(150,150,150)
drawtext("50%",barindex,f50-1*pointsize,Dialog,Standard,10)coloured(150,150,150)
drawtext("61.8%",barindex,f618-1*pointsize,Dialog,Standard,10)coloured(150,150,150)
drawtext("78.6%",barindex,f786-1*pointsize,Dialog,Standard,10)coloured(150,150,150)
drawtext("0%",barindex,f0-1*pointsize,Dialog,Standard,10)coloured(150,150,150)//v2
drawtext("100%",barindex,f100-1*pointsize,Dialog,Standard,10)coloured(150,150,150)//v2
drawtext("138.2%",barindex,f1382-1*pointsize,Dialog,Standard,10)coloured(150,150,150)//v2
drawtext("161.8%",barindex,f1618-1*pointsize,Dialog,Standard,10)coloured(150,150,150)//v2
drawtext("Minus 38.2%",barindex,fm382-1*pointsize,Dialog,Standard,10)coloured(150,150,150)//v2
drawtext("Minus 61.8%",barindex,fm618-1*pointsize,Dialog,Standard,10)coloured(150,150,150)//v2
endif
endif

return f0 coloured(150,150,150) style(dottedline,2), f236 coloured(150,150,150) style(dottedline,2), f382 coloured(150,150,150) style(dottedline,2), f50 coloured(150,150,150) style(dottedline,2), f618 coloured(150,150,150) style(dottedline,2), f786 coloured(150,150,150) style(dottedline,2), f100 coloured(150,150,150) style(dottedline,2), f1382 coloured(150,150,150) style(dottedline,2), f1618 coloured(150,150,150) style(dottedline,2), fm382 coloured(150,150,150) style(dottedline,2), fm618 coloured(150,150,150) style(dottedline,2), M0,M1,M2,M3,M4,M5, PP coloured(255,255,255) style(line,3) as "PP", R1 coloured(128,0,0) style(line,3) as "R1", rR2 coloured(128,0,0) style(line,3) as "R2", R3 coloured(128,0,0) style(line,3) as "R3", S1 coloured(0,128,0) style(line,3) as "S1",S2 coloured(0,128,0) style(line,3) as "S2", S3 coloured(0,128,0) style(line,3) as "S3"