







Fibonacci Pivots Points 4 Hours, Daily, Weekly and Monthly
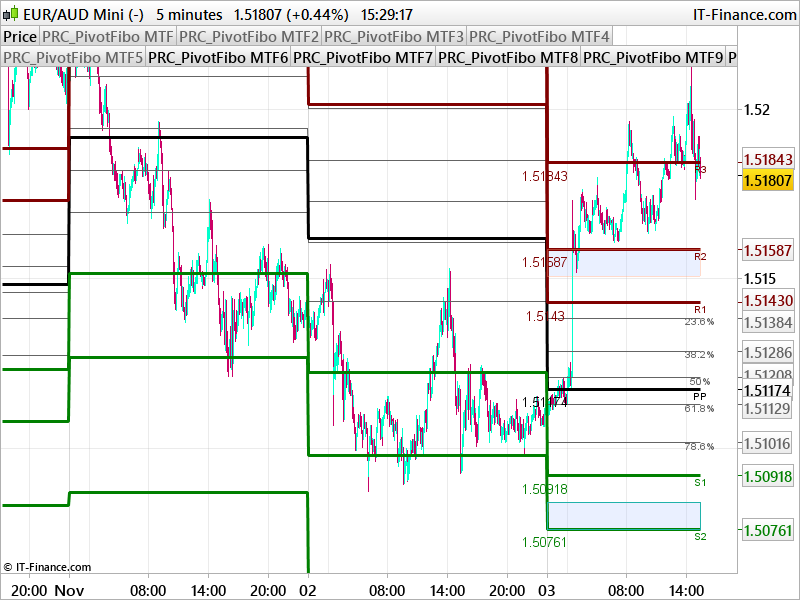
This is a whole new pivot points indicator with multiple timeframe capabilities:
4 different timeframes possible, make selection with “PivotTF” setting:
0 = Daily pivot points
1 = Weekly pivot points
2 = Monthly pivot points
3 = 4 hours pivots points
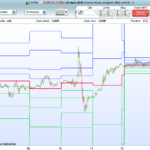
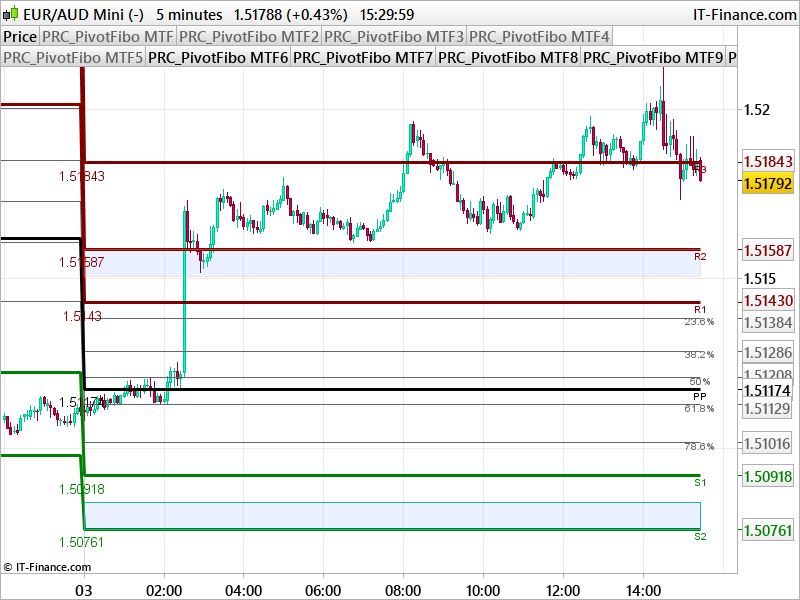
This pivots points indicator display also Fibonacci retracement numbers from previous period.
In settings, you also have the possibility to plot or not some informations:
_ middle pivot points (lines)
_ pivots and Fibonacci pivot points labels
_ pivots prices
_ “zones”(plotted with rectangles) between S1 and S2, and between R1 and R2
//PRC_PivotFibo MTF | indicator
//03.11.2017
//Nicolas @ www.prorealcode.com
//Sharing ProRealTime knowledge

defparam drawonlastbaronly=true

// --- settings
//PlotPivots=1
//PlotPivotsLabels=1
//PlotPivotsPrices=1
//PlotMiddle=0
//PlotFibots=1
//PlotFibotsLabel=1
//PlotZones=1
//PivotTF = 3 //0=daily , 1=weekly , 2=monthly, 3=4 hours
// --- end of settings

if intradaybarindex=0 then
 if PivotTF=0 then
  firstbar=barindex
  cclose=close[1]
  hhigh=hh
  llow=ll
 endif
 hh=0
 ll=close*10
endif

if PivotTF=0 then
 hh=max(hh,high)
 ll=min(ll,low)
elsif  PivotTF=1 then
 if DayOfWeek<DayOfWeek[1] then
  hhigh = Highest[BarIndex - lastWeekBarIndex](High)[1]
  llow = Lowest[BarIndex - lastWeekBarIndex](Low)[1]
  cclose=close[1]
  lastWeekBarIndex = BarIndex
  firstbar=barindex
 Endif
elsif PivotTF=2 then
 If Month<>Month[1] then
  hhigh = Highest[BarIndex - lastMonthBarIndex](High)[1]
  llow = Lowest[BarIndex - lastMonthBarIndex](Low)[1]
  cclose=close[1]
  lastMonthBarIndex = BarIndex
  firstbar=barindex
 endif
elsif PivotTF=3 then //H4 timeframe
 if minute=0 and (hour=0 or hour=4 or hour=8 or hour=12 or hour=16 or hour=20) then
  hhigh = Highest[BarIndex - last4HourBarIndex](High)[1]
  llow = Lowest[BarIndex - last4HourBarIndex](Low)[1]
  cclose=close[0]
  last4HourBarIndex = BarIndex[0]
  firstbar=barindex[0]
 endif
endif

if(PlotPivots) then
 PP = (hhigh+llow+cclose)/3.0

 R1 = PP+0.382*(hhigh-llow)
 rR2 = PP+0.618*(hhigh-llow)
 R3 = PP+1.000*(hhigh-llow)

 S1 = PP-0.382*(hhigh-llow)
 S2 = PP-0.618*(hhigh-llow)
 S3 = PP-1.000*(hhigh-llow)

 if(PlotMiddle) then
  M0=0.5*(S2+S3)
  M1=0.5*(S1+S2)
  M2=0.5*(PP+S1)
  M3=0.5*(PP+R1)
  M4=0.5*(R1+rR2)
  M5=0.5*(rR2+R3)
 endif

 if(PlotPivotsLabels) then
  drawtext("PP",barindex,PP-2*pointsize,Dialog,Standard,10)coloured(255,255,255)
  drawtext("R1",barindex,R1-2*pointsize,Dialog,Standard,10)coloured(128,0,0)
  drawtext("R2",barindex,RR2-2*pointsize,Dialog,Standard,10)coloured(128,0,0)
  drawtext("R3",barindex,R3-2*pointsize,Dialog,Standard,10)coloured(128,0,0)
  drawtext("S1",barindex,S1-2*pointsize,Dialog,Standard,10)coloured(0,128,0)
  drawtext("S2",barindex,S2-2*pointsize,Dialog,Standard,10)coloured(0,128,0)
  drawtext("S3",barindex,S3-2*pointsize,Dialog,Standard,10)coloured(0,128,0)
 endif
 if(PlotPivotsPrices) then
  drawtext("#PP#",firstbar,PP-4*pointsize,Dialog,Standard,13)coloured(255,255,255)
  drawtext("#R1#",firstbar,R1-4*pointsize,Dialog,Standard,13)coloured(128,0,0)
  drawtext("#rR2#",firstbar,RR2-4*pointsize,Dialog,Standard,13)coloured(128,0,0)
  drawtext("#R3#",firstbar,R3-4*pointsize,Dialog,Standard,13)coloured(128,0,0)
  drawtext("#S1#",firstbar,S1-4*pointsize,Dialog,Standard,13)coloured(0,128,0)
  drawtext("#S2#",firstbar,S2-4*pointsize,Dialog,Standard,13)coloured(0,128,0)
  drawtext("#S3#",firstbar,S3-4*pointsize,Dialog,Standard,13)coloured(0,128,0)
 endif
 if(PlotZones) then
  drawrectangle(firstbar,rr2,barindex,(rr2+r1)/2) coloured(255,160,122,100)
  drawrectangle(firstbar,s2,barindex,(s1+s2)/2) coloured(32,178,170)
 endif
endif

if(PlotFibots) then
 f236 = (llow+(((hhigh-llow)/100)*(100-23.6)))
 f382 = (llow+(((hhigh-llow)/100)*(100-38.2)))
 f50  = (llow+(((hhigh-llow)/100)*(100-50)))
 f618 = (llow+(((hhigh-llow)/100)*(38.2)))
 f786 = (llow+(((hhigh-llow)/100)*(21.4)))
 if(PlotFibotsLabel) then
  drawtext("23.6%",barindex,f236-1*pointsize,Dialog,Standard,10)coloured(100,100,100)
  drawtext("38.2%",barindex,f382-1*pointsize,Dialog,Standard,10)coloured(100,100,100)
  drawtext("50%",barindex,f50-1*pointsize,Dialog,Standard,10)coloured(100,100,100)
  drawtext("61.8%",barindex,f618-1*pointsize,Dialog,Standard,10)coloured(100,100,100)
  drawtext("78.6%",barindex,f786-1*pointsize,Dialog,Standard,10)coloured(100,100,100)
 endif
endif

return f236 coloured(100,100,100), f382 coloured(100,100,100), f50 coloured(100,100,100), f618 coloured(100,100,100), f786 coloured(100,100,100), M0,M1,M2,M3,M4,M5, PP coloured(255,255,255) style(line,3) as "PP", R1 coloured(128,0,0) style(line,3) as "R1", rR2 coloured(128,0,0) style(line,3) as "R2", R3 coloured(128,0,0) style(line,3) as "R3", S1 coloured(0,128,0) style(line,3) as "S1",S2 coloured(0,128,0) style(line,3) as "S2", S3 coloured(0,128,0) style(line,3) as "S3"
Comments
You must be logged in to post a comment.


further to my comment this thread : https://www.prorealcode.com/prorealtime-indicators/intraday-flexible-camarilla-pivot-points/ has the ability to define timeframe and start and end times for the pivot calculation but only for Camarilla. If that could be included in Nicholas's above pivot indicator it would further enhance it. is it possible to modify it? apologies but i am new here so don't know if requests for modifications accepted. Ifnot then apologies and thanks for your efforts.
Hi Nicholas, thanks for the indicator, is it possible to modify it to include the previous days range Fib extensions i.e. previous day's range x 1.618, just as you have down the fib retracements of the precious days range? Also, is it possible to define the start and end time of the pivot calculation?. Many thanks in advance


Hi Nicolas, I love this indicator except one thing, the vertical lines linking the horizontal pivot lines are really annoying to me, can you please show me or link how to change this indicator so it draws just horizontal lines for the pivots? I am guessing it needs to use code like this (https://www.prorealcode.com/documentation/drawline/) but plot the lines for each period (weekly) and I don't know how to do that bit. Any help is much appreciated!


D'accord, merci beaucoup.
Bonjour Nicolas, ils sont super tes programmes. Une question: sais-tu comment faire des lignes horizontaux, comme ici les pivots, sans qu'il y a des traits/lignes diagonales/verticales entre les periodes? PRT le fasse avec ses pivots (et PRT ajoute un label à la fin de chaque segment) mais je n'arrive pas a le réproduire dans mes propres programmes. Dans tout cas, merci pour tes contributions et bonne fêtes de fin d'année.





ok will do, apologies, as I said I am new here. many thanks