1. Introduction
The Force Index (EFI), originally developed by Dr. Alexander Elder, is a classic oscillator that measures the power behind a price move. It combines the three essential elements of market action: the direction of the price change, the extent of the change, and the volume. A significant price move on high volume results in a high Force Index value, while a small move on low volume results in a low value.
This advanced version, enhances the original concept in two significant ways:
- It includes an adaptive calculation mode that uses a band-pass filter to find the market’s dominant cycle, making the indicator’s smoothing automatically adjust to current conditions.
- It incorporates volatility channels based on the EFI’s own Average True Range (ATR), helping to identify extreme, climactic, or over-extended moves.
2. How the Indicator Works
The Core “Force” Calculation
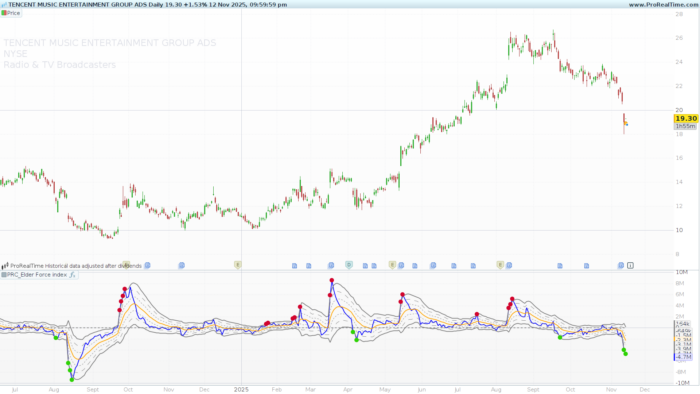
The “force” of each bar is calculated with the classic formula: (Current Close - Previous Close) * Volume. This raw value is then smoothed using an Exponential Moving Average (EMA) to create the main EFI line (blue). A second, typically slower, EMA is applied to the EFI line to create the Signal line (orange).
Here is the complete article for ProRealcode.com, written in English and formatted for easy publishing.
1. Introduction
The Force Index (EFI), originally developed by Dr. Alexander Elder, is a classic oscillator that measures the power behind a price move. It combines the three essential elements of market action: the direction of the price change, the extent of the change, and the volume. A significant price move on high volume results in a high Force Index value, while a small move on low volume results in a low value.
This advanced version enhances the original concept in two significant ways:
- It includes an adaptive calculation mode that uses a band-pass filter to find the market’s dominant cycle, making the indicator’s smoothing automatically adjust to current conditions.
- It incorporates volatility channels based on the EFI’s own Average True Range (ATR), helping to identify extreme, climactic, or over-extended moves.
2. How the Indicator Works
The Core “Force” Calculation
The “force” of each bar is calculated with the classic formula: (Current Close - Previous Close) * Volume. This raw value is then smoothed using an Exponential Moving Average (EMA) to create the main EFI line (blue). A second, typically slower, EMA is applied to the EFI line to create the Signal line (orange).
Feature 1: The Adaptive Engine (Band-Pass Filter)
This indicator gives you two choices for its calculation method, set by the calcType input:
- Fixed Mode (
calcType = 1): This is the default. The indicator behaves like a standard EFI, using the fixed periods you define in the settings (lenfor the EFI,slenfor the Signal line) . - Adaptive Mode (
calcType = 0): This mode activates a sophisticated band-pass filter to analyze price action and determine the current dominant market cycle. It then uses this detected cycle length to automatically adjust the periods for the EFI, Signal, and ATR calculations. This makes the indicator more responsive in fast, active markets and smoother during quiet consolidation.
Feature 2: The ATR Volatility Channels
Instead of using the price’s ATR, this indicator cleverly calculates the volatility of the EFI line itself. It does this by taking an EMA of the absolute difference between consecutive EFI values.
It then plots three sets of these ATR bands (at 1x, 2x, and 3x the multiplier) around the orange Signal line. These channels function as dynamic “overbought” and “oversold” levels based on the EFI’s current volatility.
Feature 3: Truncation (Normalization)
The truncAtr setting (on by default) helps to normalize the oscillator. If the EFI value tries to spike far beyond the 3rd ATR band, this feature will “cap” or “truncate” the visual plot at the 3rd band. This prevents a single extreme spike from skewing the chart and makes it easier to read.
3. How to Use This Indicator
- Trend Confirmation (The Zero Line)
- Bullish: The EFI line (blue) and/or Signal line (orange) are above the zero line. This indicates that buying power is dominant.
- Bearish: The EFI and/or Signal lines are below the zero line. This indicates that selling power is dominant.
- Identifying Extremes (The ATR Bands)
- When the blue EFI line hits the 2nd or 3rd ATR band (e.g.,
atrHigh2oratrHigh3), it signals a very strong, potentially over-extended, or “climactic” move. - The indicator automatically plots red and green dots when the EFI line reaches or exceeds the 3rd ATR band, visually highlighting these potential exhaustion or reversal points.
- When the blue EFI line hits the 2nd or 3rd ATR band (e.g.,
- Spotting Divergences
- Bullish Divergence: The price makes a new low, but the EFI makes a higher low. This suggests selling power is weakening and a reversal up may be near.
- Bearish Divergence: The price makes a new high, but the EFI makes a lower high. This suggests buying power is weakening and a reversal down may be near.
- Signal Line Crossovers
- A blue EFI line crossing above the orange Signal line can be used as an aggressive buy trigger.
- A blue EFI line crossing below the orange Signal line can be used as an aggressive sell trigger.
4. Configuration & Settings
Here are the inputs you can customize in the indicator’s settings panel:
Main Calculation Mode
- calcType (Default: 1)
This is the master switch for the calculation method.
1= Fixed Mode0= Band-pass (Adaptive) Mode
Fixed Mode Parameters
(These are only used if calcType is set to 1)
- len (Default: 13): The period for the main EFI’s EMA.
- slen (Default: 21): The period for the Signal line’s EMA.
Band-Pass (Adaptive) Mode Parameters
(These are only used if calcType is set to 0)
- bpPeriod (Default: 13): The base period for the band-pass filter
- bpWidth (Default: 0.20): The width of the band-pass filter.
- cycleLen (Default: 1.00): A multiplier for the detected cycle, used to set the Signal and ATR lengths. (e.g., 1.0 = 100% of the cycle).
- efireduction (Default: 0.75): A multiplier for the detected cycle, used to set the main EFI length. (e.g., 0.75 = 75% of the cycle).
ATR Channel Settings
- atrMult1 (Default: 1): The multiplier for the 1st (inner) ATR band.
- atrMult2 (Default: 2): The multiplier for the 2nd (middle) ATR band
- atrMult3 (Default: 3): The multiplier for the 3rd (outer) ATR band.
Display Setting
- truncAtr (Default: 1)
Controls the “capping” of the EFI line.
1= Truncate (cap) the EFI line at the 3rd ATR band.0= Do Not Truncate (allow the EFI line to draw its true value).
5. ProRealTime Code
|
1 2 3 4 5 6 7 8 9 10 11 12 13 14 15 16 17 18 19 20 21 22 23 24 25 26 27 28 29 30 31 32 33 34 35 36 37 38 39 40 41 42 43 44 45 46 47 48 49 50 51 52 53 54 55 56 57 58 59 60 61 62 63 64 65 66 67 68 69 70 71 72 73 74 75 76 77 78 79 80 81 82 83 84 85 86 87 88 89 90 91 92 93 94 95 96 97 98 99 100 101 102 103 104 105 106 107 108 109 110 111 112 113 114 115 116 117 118 119 120 121 122 123 124 125 126 127 128 129 130 131 132 133 134 135 136 137 138 139 140 141 142 143 144 145 146 147 |
//-----------------------------------------// //PRC_Elder Force index //version = 0 //18.09.2024 //Iván González @ www.prorealcode.com //Sharing ProRealTime knowledge //-----------------------------------------// //-----Inputs------------------------------// //-----------------------------------------// src=close calcType=1 //Boolean//1=Fixed 0=Band-pass Dominant Cycle len=13 //Fixed EFI Period slen=21 //Fixed Signal Period atrM=21 //Fixed ATR Smoothing Length bpPeriod=13 //Band-pass period bpWidth=0.20 //Band-pass Width cycleLen=100/100 //Signal and ATR percent of dominant cycle (%) efireduction=75/100 //EFI percent of dominat cycle (%) atrMult1=1 atrMult2=2 atrMult3=3 truncAtr=1 //truncate over ATR Mult Level 4? //-----------------------------------------// //--Length Out calculation Band-pass type--// //-----------------------------------------// peak=0 real=0 counter=0 dc=0 alpha2=(cos(0.25*bpWidth*2*180/bpPeriod)+sin(0.25*bpWidth*2*180/bpPeriod)-1)/cos(0.25*bpWidth*2*180/bpPeriod) if barindex<=1 then hp=0 else hp=(1+alpha2/2)*(close-close[1])+(1-alpha2)*hp[1] endif beta1=cos(2*180/bpPeriod) gamma1=1/cos(2*180*bpWidth/bpPeriod) alpha1=gamma1-sqrt(gamma1*gamma1-1) if barindex<=2 then bp=0 else bp=0.5*(1-alpha1)*(hp-hp[2])+beta1*(1+alpha1)*bp[1]-alpha1*bp[2] endif peak=0.991*peak if abs(bp)>peak then peak=abs(bp) else peak=peak endif if peak<>0 then real=bp/peak else real=real endif if dc<6 then dc=6 else dc=dc endif counter=counter+1 if real crosses over 0 or real crosses under 0 then dc=2*counter if 2*counter>1.25*dc[1] then dc=1.25*dc[1] elsif 2*counter<0.8*dc[1] then dc=0.8*dc[1] endif counter=0 endif tempoutFast=efireduction*dc tempoutSlow=cycleLen*dc if tempoutFast<1 then lenOutFast=1 else lenOutFast=round(tempoutFast) endif if tempoutSlow<1 then lenOutSlow=1 else lenOutSlow=round(tempoutSlow) endif //-----------------------------------------// //-----EFI and Signal Calculation----------// //-----------------------------------------// if calcType=1 then efi=average[len,1]((close-close[1])*volume) sig=average[len,1](efi) length=len else efi=average[lenOutFast,1]((close-close[1])*volume) sig=average[lenOutSlow,1](efi) length=lenOutSlow endif atrEMA=abs(efi[1]-efi) src1 = atrEMA alpha = 1/length if barindex = 2*length then atrOUT = average[length](src1) else atrOUT = alpha*src1 + (1-alpha)*atrOUT[1] endif //-----------------------------------------// //-----ATR Channel Calculation-------------// //-----------------------------------------// atrHigh1=sig+atrOut*atrMult1 atrHigh2=sig+atrOut*atrMult2 atrHigh3=sig+atrOut*atrMult3 atrLow1=sig-atrOut*atrMult1 atrLow2=sig-atrOut*atrMult2 atrLow3=sig-atrOut*atrMult3 atrObHigh=sig+atrOut*(atrMult3+1) atrObLow=sig-atrOut*(atrMult3+1) if truncAtr then if efi>atrObHigh then efiOut=atrHigh3 else if efi<atrOblow then efiOut=atrLow3 else efiOut=efi endif endif else efiOut=efi endif //-----------------------------------------// //-----Plot shapes-------------------------// //-----------------------------------------// if efiOut>=atrHigh3 then drawpoint(barindex,efiOut,3)coloured(210,4,45) elsif efiout<=atrLow3 then drawpoint(barindex,efiOut,3)coloured(45,210,4) endif //-----------------------------------------// //-----------------------------------------// //-----------------------------------------// return efiOut as "EFI" coloured("blue")style(line,2), sig as "Signal" coloured("orange")style(line,2), 0 as "zero"style(dottedline,2)coloured("grey"), atrHigh1 as "ATR1 high"coloured("grey")style(dottedline,1), atrHigh2 as "ATR2 high"coloured("grey")style(dottedline2,1), atrHigh3 as "ATR3 high"coloured("grey")style(line,2), atrLow1 as "ATR1 low"coloured("grey")style(dottedline,1),atrLow2 as "ATR2 low"coloured("grey")style(dottedline2,1),atrLow3 as "ATR3 low"coloured("grey")style(line,2) |
Share this
No information on this site is investment advice or a solicitation to buy or sell any financial instrument. Past performance is not indicative of future results. Trading may expose you to risk of loss greater than your deposits and is only suitable for experienced investors who have sufficient financial means to bear such risk.
ProRealTime ITF files and other attachments :
Find other exclusive trading pro-tools on ![]()
PRC is also on YouTube, subscribe to our channel for exclusive content and tutorials


Signal is not available as variable !!!!
Shall I consider Signal=sig ?????
you can see it in return line (sig as “Signal” coloured(“orange”)style(line,2))