

DeMarker Extrem on Chart
June 18, 2018, 8:14 AM
Indicators
5 Comments
Hello.
I downloaded the DeMarker from this link
https://www.prorealcode.com/prorealtime-indicators/demarker-indicator/
here the code:
//DeMarker Indicator
period=14
up=max(0,high-high[1])
down=max(0,low[1]-low)
ratio=100*average[period](up)/(average[period](up)+average[period](down))
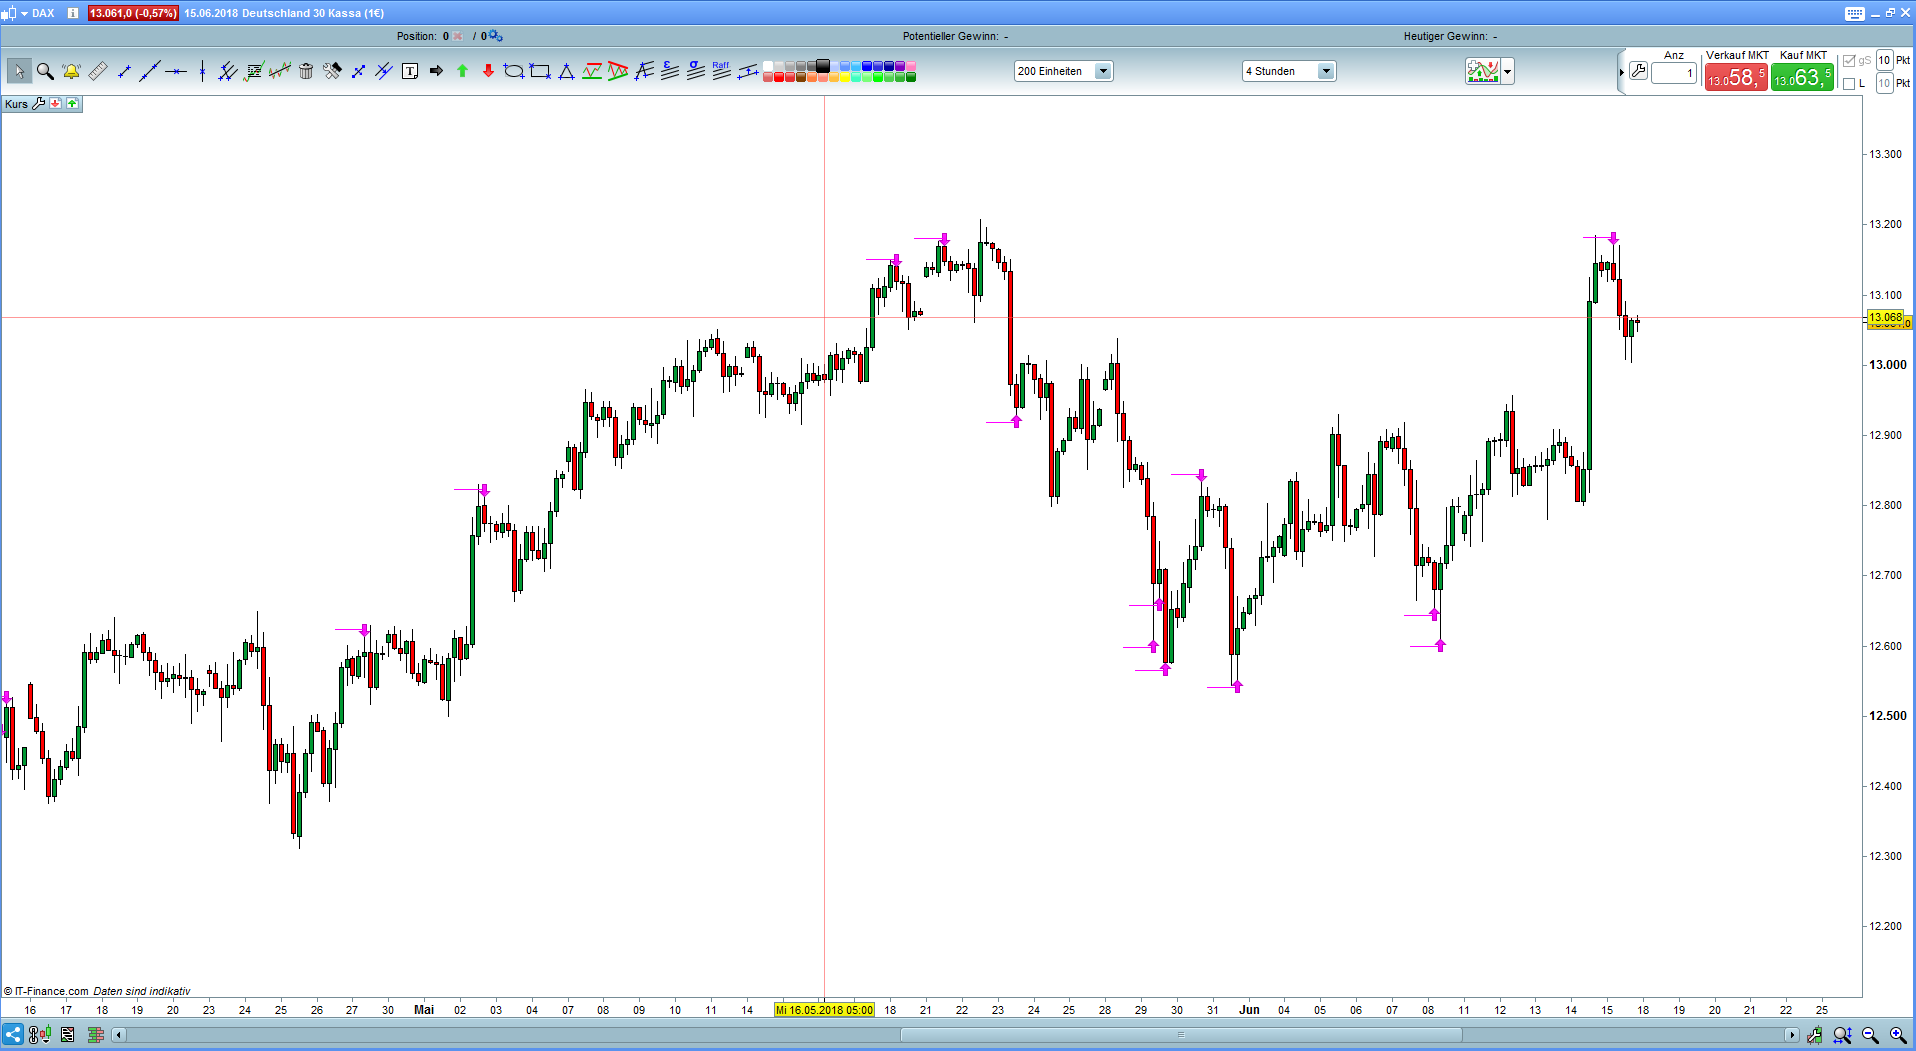
return ratio as "DeMarker",20,80and then I adapted the DeMarker “OnChart” in this way, you can see possible entry points for short and long positions in the Dax 4H as a reverse signal at extreme points.
//DeMarker Indicator Extrem on Chart

// graphic taken and little bit modified from PRC Scalping Indikator V3
PIP                 = 0.1*Pipsize   ///ARROW DISTANCE
LIN                 = 5             //LENGTH OF SEGMENT OF SUPPORT OR RESISTENCE
RESISTENCE          = 10*Pipsize    //DISTANCE OF THE SEGMENT OF THE RESISTENCE
SUPPORT             = 10*Pipsize

r =255
g=0
b=255


// variables dfault value
L = 5
S = 95
period = 6
Tstart = 080000
Tend = 220000


// DeMark
up=max(0,high-high[1])
down=max(0,low[1]-low)
DeMark =100*average[period](up)/(average[period](up)+average[period](down))


// TimeWindows to show the graphic,
IF time >=Tstart and time <=Tend Then

 If DeMark <L then
  DRAWARROWUP(barindex,LOW-PIP)coloured(r,g,b)
  DRAWSEGMENT(barindex,LOW-SUPPORT,barindex-LIN, LOW-SUPPORT )coloured(r,g,b)
 Endif

 If DeMark >S then
  DRAWARROWDOWN(barindex,HIGH+PIP)coloured(r,g,b)
  DRAWSEGMENT(barindex,HIGH+RESISTENCE,barindex-LIN, HIGH+RESISTENCE) coloured(r,g,b)
 endif
ENDIF


return
until then
JohnScher
Download
Filename:
DeMarker-Extrem-on-Chart.itf
Downloads:
366
Veteran
Code artist, my biography is a blank page waiting to be scripted. Imagine a bio so awesome it hasn't been coded yet.
Author’s Profile
Loading...