

Cumulative Volume Delta with periods
Because it is not possible to get the bid/ask volumes into an usual timeframe (such as the 1 minute one for example), I had the idea to use the “tick by tick chart” to get them. In this kind of chart, each price movement is x ticks received.
Each time the price is higher than the previous received one, the code count the Volumes received as a positive one, same goes for a lower price received, counting as a negative Volumes.
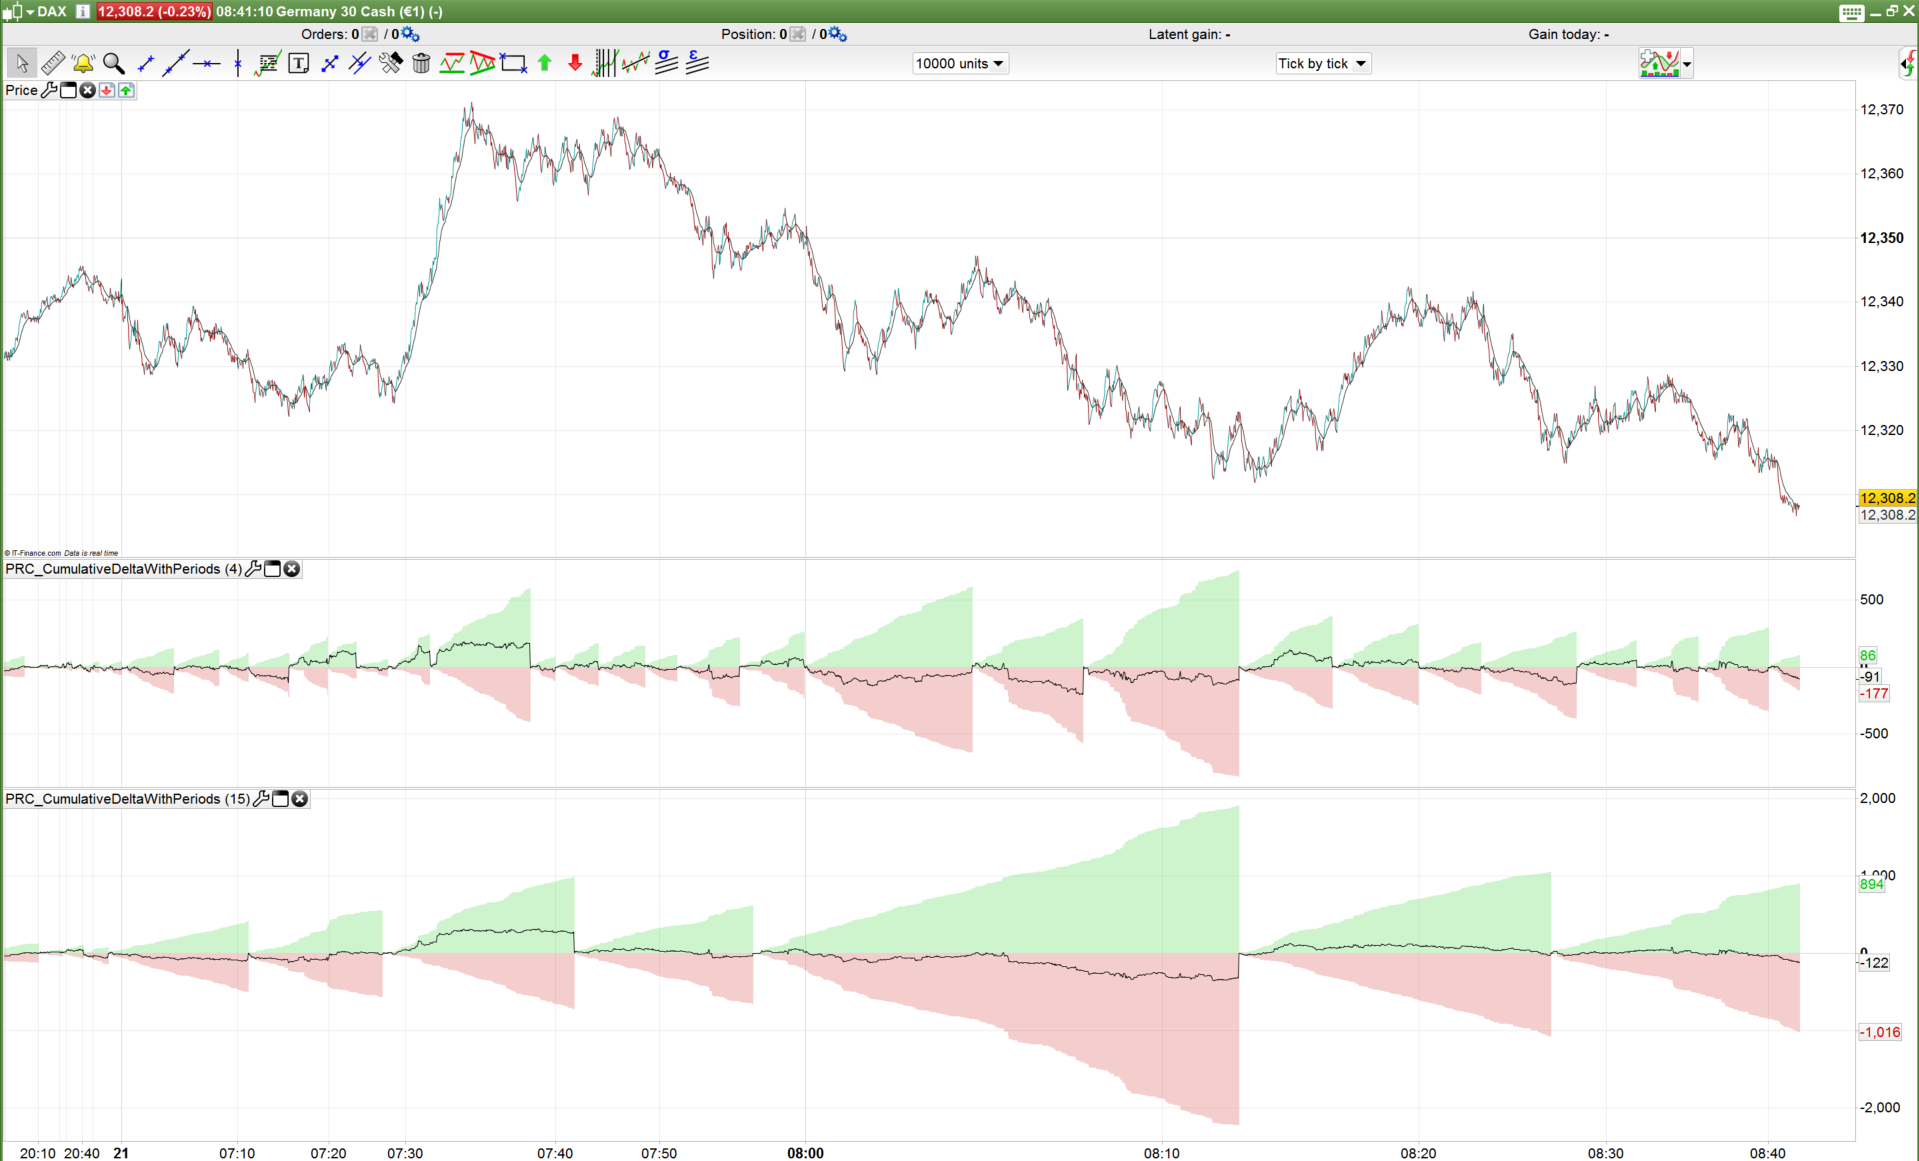
These Volumes counts are accumulated and plotted as green and red histograms. Then a “Cumulative Delta”, which is the difference of the 2 histograms is plotted as a black line.
When the Cumulative Delta is crossing below the zero line, the bearish pressure is real, while the bullish one exist when the Delta is crossing above zero level.
I add a setting to reset the Cumulative Delta to zero each X minutes with the “minutes” parameter. So it is possible to stack many Cumulative Delta on the same chart with different “minutes” settings to get the large picture and smaller one(s).
Note: This indicator is only compatible on a ‘Tick by Tick’ chart with instruments which have Volumes.
//PRC_CumulativeDeltaWithPeriods | indicator
//21.03.2018
//Nicolas @ www.prorealcode.com
//Sharing ProRealTime knowledge

// --- settings
iminutes = 4 // in minutes quantity
// --- end of settings

newperiod = minute<>minute[1]
if newperiod then
 count=count+1
endif

if count=iminutes then
 count=0
 volp=0
 volm=0
endif

if volume>0 then
 if close>last then
  last=close
  volp = volp+volume
 elsif close<last then
  last=close
  volm = volm+volume
endif

delta = volp-volm
endif

return volp coloured(0,200,0,50) style(histogram) as "Positive volumes", -volm coloured(200,0,0,50) style(histogram) as "Negative volumes", delta as "Volume delta"