




More from ProRealCode
ProRealCode - Trading & Coding with ProRealTime™
The ProRealTime™ community on the web! Officially sharing ProRealTime knowledge to Worldwide users since 2015!



CM_Laguerre PPO PctRank Tops-Bottoms
June 10, 2020, 10:34 AM
Indicators
0 Comments
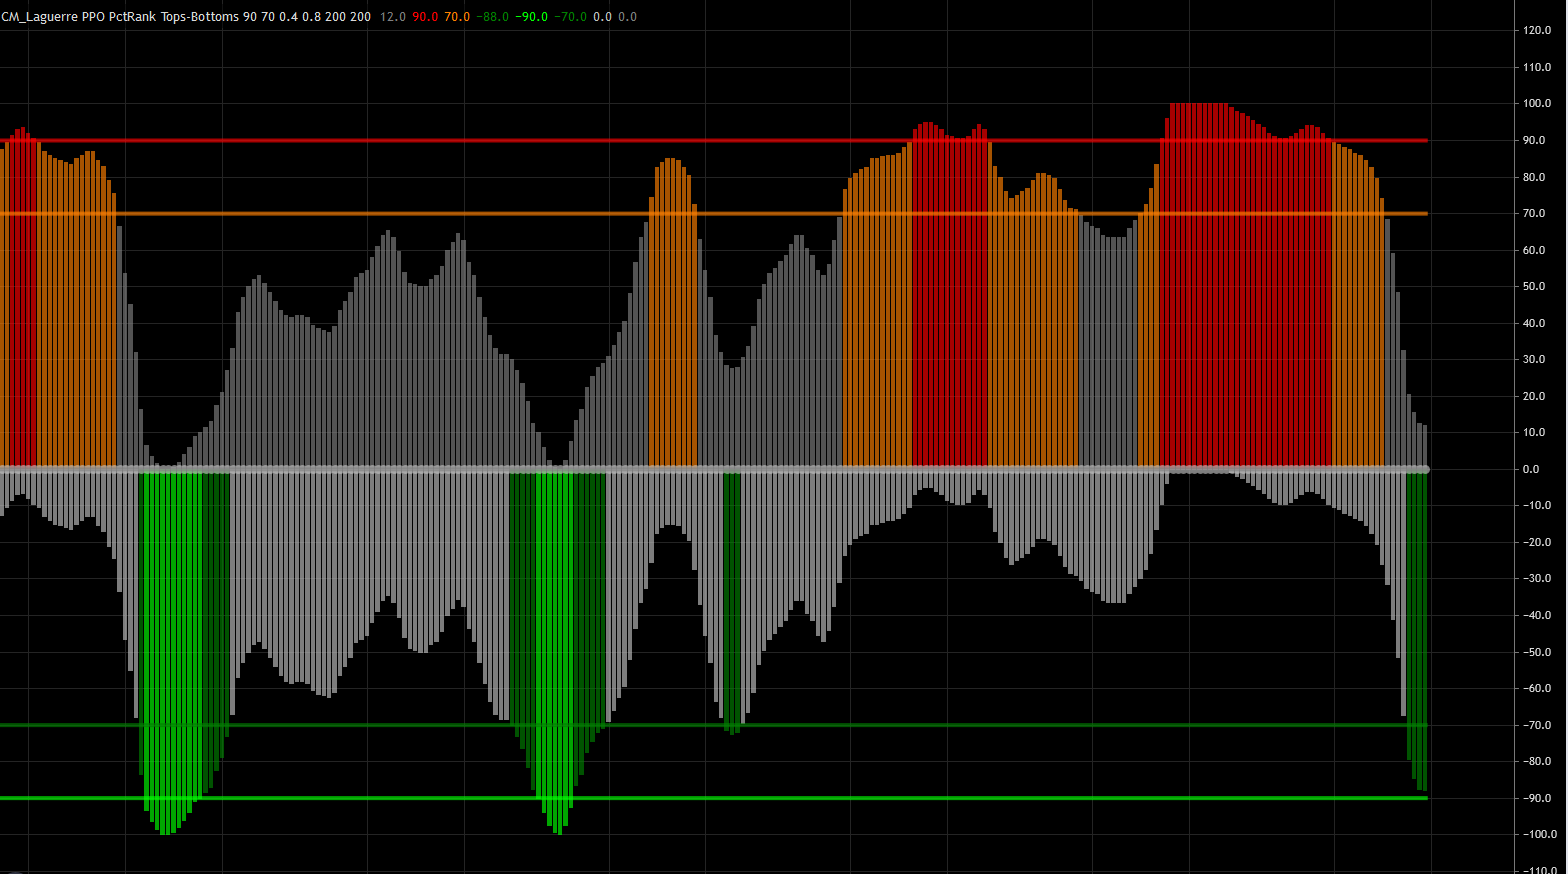
I have modified the version of Nicolas present in the library, added the colors and updated to version no. 2
This Is Version 2 Of This Indicator that now Finds Market Tops and Bottoms
Created by ChrisMoody on 11/03/2014.
// CM_Laguerre PPO PctRank Tops-Bottoms
// modificato CM_Laguerre PPO PercentileRank ora = tradingview
// parameters :
 Short = 0.4
 Long = 0.8
 lkb = 200 //(Look back period)
 pctile = 90 //(Extreme threshold lines)
 midpctile = 70 //(Warning threshold lines)

if(barindex>lkb) then

hl2 = (high+low)/2

//laguerre short
Ls0 = (1 - Short)*hl2+Short*(Ls0[1])
Ls1 = -Short*Ls0+(Ls0[1])+Short*(Ls1[1])
Ls2 = -Short*Ls1+(Ls1[1])+Short*(Ls2[1])
Ls3 = -Short*Ls2+(Ls2[1])+Short*(Ls3[1])
lmas = (Ls0 + 2*Ls1 + 2*Ls2 + Ls3)/6

//laguerre long
Ll0 = (1 - Long)*hl2+Long*(Ll0[1])
Ll1 = -Long*Ll0+(Ll0[1])+Long*(Ll1[1])
Ll2 = -Long*Ll1+(Ll1[1])+Long*(Ll2[1])
Ll3 = -Long*Ll2+(Ll2[1])+Long*(Ll3[1])
lmal = (Ll0 + 2*Ll1 + 2*Ll2 + Ll3)/6

pctileB = pctile * -1
midpctileB = midpctile * -1

//PPO Plot
ppoT = (lmas-lmal)/lmal*100
ppoB = (lmal-lmas)/lmal*100

//PercentRank of PPO
// percent rank = nb of value less than our value / (nb of values less than our value + nb of values greater than our value)
topvalueMinus = 0
topvaluePlus = 0
bottomvalueMinus = 0
bottomvaluePlus = 0

for i = 0 to lkb do
if ppoT[i]<ppoT then
topvalueMinus = topvalueMinus+1
else
topvaluePlus = topvaluePlus+1
endif
if ppoB[i]<ppoB then
bottomvalueMinus = bottomvalueMinus+1
else
bottomvaluePlus = bottomvaluePlus+1
endif
next

pctRankT = topvalueMinus / (topvalueMinus+topvaluePlus)
pctRankB = (bottomvalueMinus / (bottomvalueMinus+bottomvaluePlus)) *-1

//coloring histogram TOP ROSSO
if pctRankT>=pctile/100 then
TopColor = 1
else
TopColor = -1
endif

//coloring histogram MID TOP ARANCIONE
if pctRankT>=midpctile/100 and pctRankT < pctile/100 then
TopColor = 2
endif

if TopColor=1 then
r=255
g=0
b=0
elsif TopColor<0 then
r=128
g=128
b=128
Endif

if TopColor=2 then
r=255
g=140
b=0
elsif TopColor<0 then
r=128
g=128
b=128
Endif

//coloring histogram BOTTOM VERDE CHIARO
if pctRankB <= pctileB/100 then
BottomColor = 1
else
BottomColor = -1
endif

//coloring histogram MID BOTTOM VERDE SCURO
if pctRankB <= midpctileB/100 and pctRankB > pctileB/100 then
BottomColor = 3
endif

if BottomColor = 1 then
rr=255
gg=0
bb=255
elsif BottomColor < 0 then
rr=211
gg=211
bb=211
Endif

if BottomColor=3 then
rr=0
gg=128
bb=0
elsif BottomColor>0 then
rr=0
gg=255
bb=0
Endif

endif

RETURN pctRankT coloured(r,g,b) as "Top", pctRankB coloured(rr,gg,bb) as "Bottom", 0 coloured (105,105,105) as "zero line", pctile/100 coloured (255,0,0) as "Top Percentile Threshold", pctileB/100 coloured (0,128,0) as "Bottom Percentile Threshold",  midpctile/100 coloured (255,140,0) as "Warning Top Percentile Threshold", (midpctile*-1)/100 coloured (0,255,0) as "Warning Bottom Percentile Threshold"
Download
Filename:
CM_Laguerre-PPO-PctRank-Tops-Bottoms.itf
Downloads:
305
Average
This author is like an anonymous function, present but not directly identifiable. More details on this code architect as soon as they exit 'incognito' mode.
Author’s Profile
Similar code
Monte Carlo – Projected PriceIndicators
Laguerre Filter on priceIndicators
Laguerre ROC (Rate Of Change)Indicators
ATR adaptive Laguerre filter with levelsIndicators
Laguerre candlesIndicators
Loading...