

Breakout Entry Point Indicator
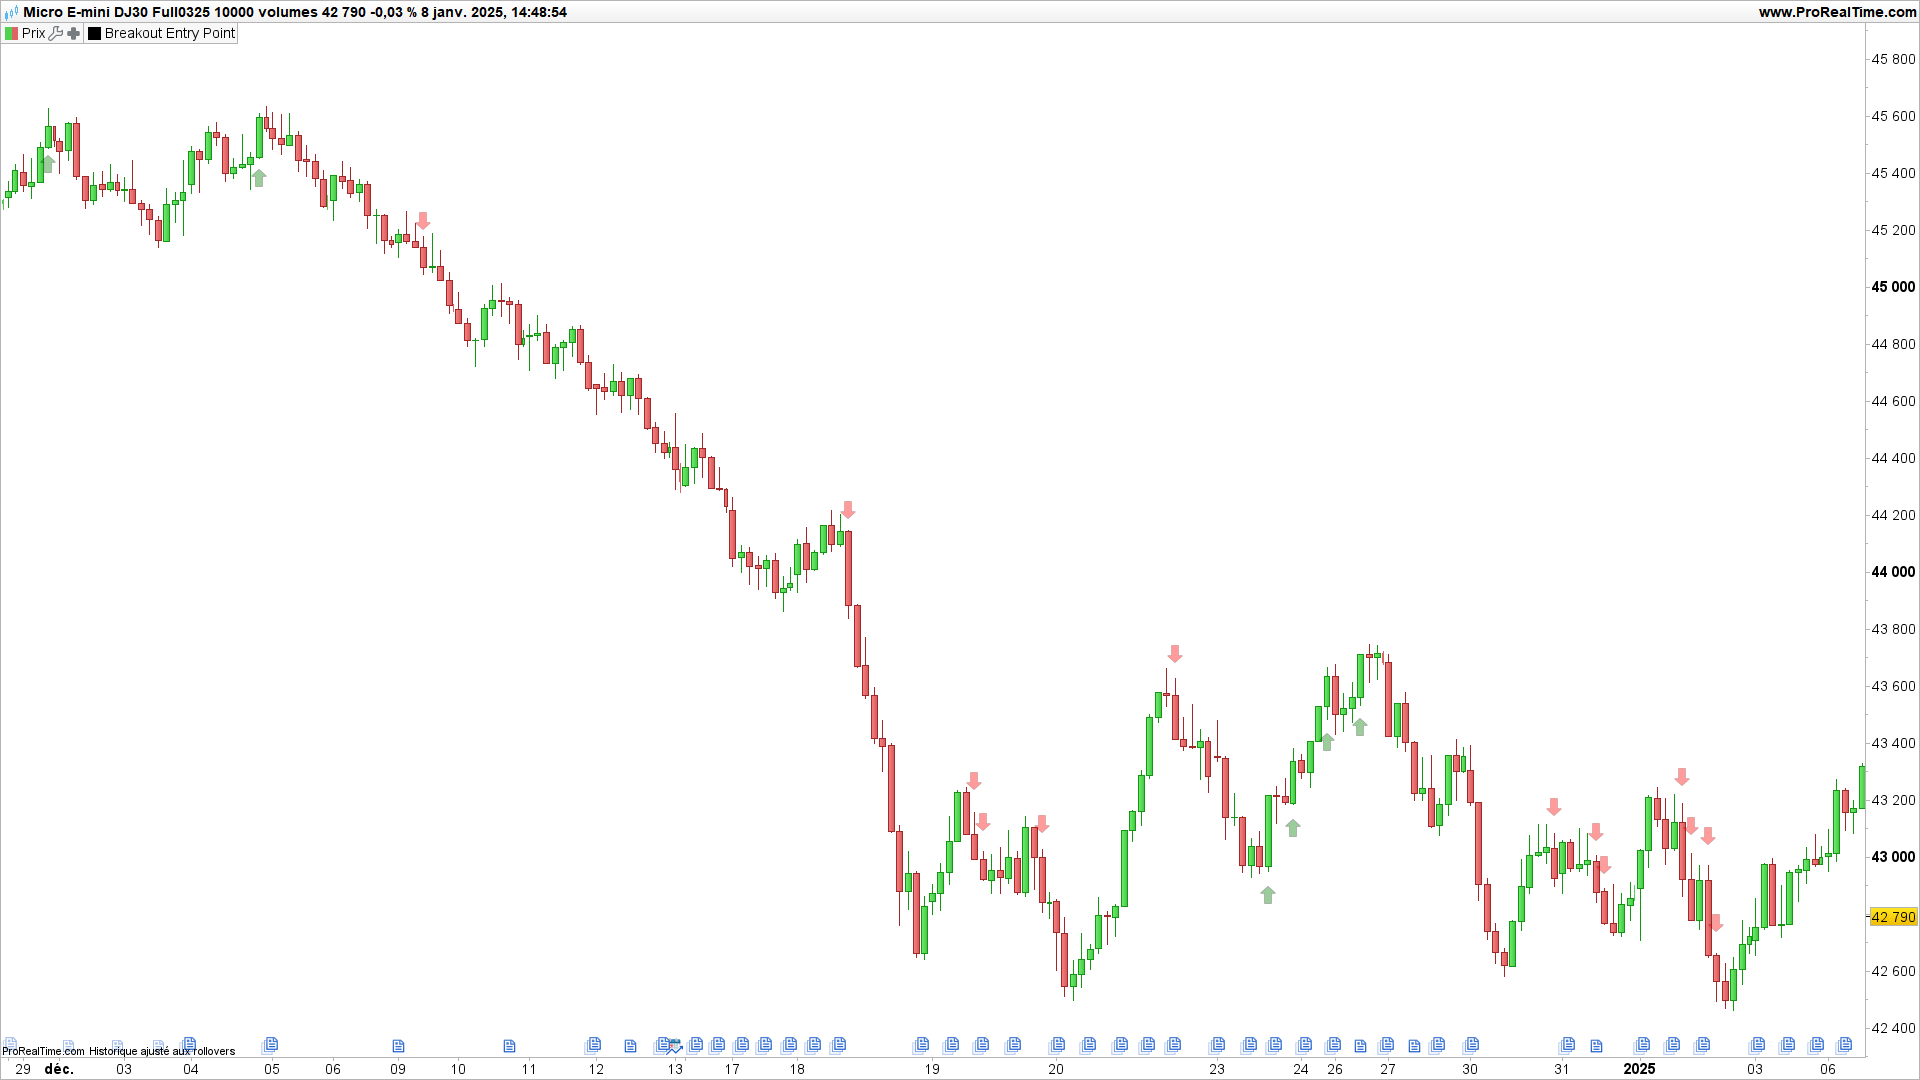
Breakout Entry Point is an indicator designed to identify strong breakouts by combining price action, momentum, and trend analysis. The indicator generates signals based on multiple confirmations, including strong candle patterns, momentum breakouts, and moving average relationships.
KEY FEATURES:
• Cooldown logic to avoid signal clustering
• Combined price action and momentum analysis
• Trend confirmation using MA20 and MA50
• RSI-based overbought/oversold filter
• ATR-based signal positioning
• Clear visual signals with arrows
SIGNAL CONDITIONS:
LONG Signals (Up Arrow):
– Strong bullish candle (>50% body to range ratio)
– Upward momentum (price above previous 2 highs)
– MA20 above MA50 (uptrend confirmation)
– RSI below 70 (not overbought)
– Respects cooldown period
SHORT Signals (Down Arrow):
– Strong bearish candle (>50% body to range ratio)
– Downward momentum (price below previous 2 lows)
– MA20 below MA50 (downtrend confirmation)
– RSI above 30 (not oversold)
– Respects cooldown period
PARAMETERS:
– CooldownPeriod
– ATR Period
– MA Periods: 20 and 50
– RSI Parameters
USAGE:
This indicator works great on Volume Bars (10K for the Dow), and starting from H1 for time related bars. It works best in trending markets and helps identify potential trend continuation setups.
//================================================
// Breakout Entry Point - INDICATOR VERSION


LastLongBar = 0
LastShortBar = 0
CooldownPeriod = 2
AtrMultiplier = 1.5
MyAtr = AVERAGE[14](TR)

// === INDICATORS ===
// Moving Averages
MA20 = AVERAGE[20](CLOSE)
MA50 = AVERAGE[50](CLOSE)


// === COOLDOWN LOGIC ===
LongCooldownOk = (intradayBarIndex - LastLongBar > CooldownPeriod) OR (LastShortBar > LastLongBar)
ShortCooldownOk = (intradayBarIndex - LastShortBar > CooldownPeriod) OR (LastLongBar > LastShortBar)

// === Price Action Analysis ===
BullishStrong = CLOSE > OPEN AND (CLOSE - OPEN) > (HIGH - LOW) * 0.5
BearishStrong = CLOSE < OPEN AND (OPEN - CLOSE) > (HIGH - LOW) * 0.5
UpMomentum = CLOSE > HIGH[1] AND CLOSE > HIGH[2]
DownMomentum = CLOSE < LOW[1] AND CLOSE < LOW[2]

// === Entry Conditions ===
RawLong = BullishStrong AND UpMomentum AND MA20 > MA50 AND RSI < 70
RawShort = BearishStrong AND DownMomentum AND MA20 < MA50 AND RSI > 30
LongSignal = RawLong AND LongCooldownOk
ShortSignal = RawShort AND ShortCooldownOk

IF LongSignal THEN
LastLongBar = intradayBarIndex
ENDIF

IF ShortSignal THEN
LastShortBar = intradayBarIndex
ENDIF

// === PLOTTING ===
// Buy Signals (Up Arrows)
IF LongSignal THEN
DRAWARROWUP(barindex, LOW - (MyAtr * 0.5)) COLOURED("WHITE", 100)  // 70% opacity
ENDIF

// Sell Signals (Down Arrows)
IF ShortSignal THEN
DRAWARROWDOWN(barindex, HIGH + (MyAtr * 0.5)) COLOURED("WHITE", 100)  // 70% opacity
ENDIF

RETURN