







Bill Williams Fractals
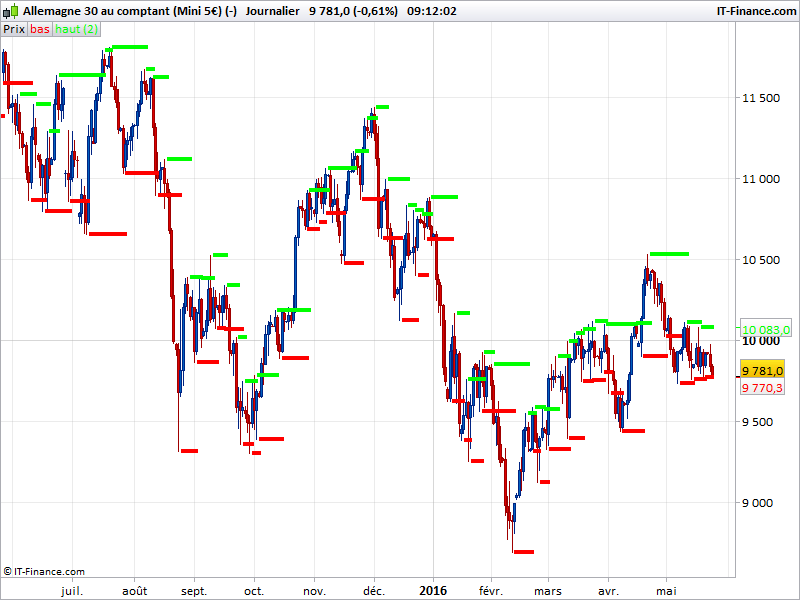
“In order for a fractal to form, there should be a series of 5 consecutive bars where the middle bar will be the highest preceded and followed by two lower neighbouring bars on each side.”
Since this indicator is frequently requested on forums, I put the code here (author: SOHOCOOL).
Fractals can be used in many different approach:
- Market points reversal
- Breakout of recent fractals points
- Trend line drawn from recent fractals
The “Low Fractal” and “High Fractal” may be set to ‘points’ style in the platform to have a clearer view of them on the price chart.
/////////// FRACTALS BILL WILLIAMS
//Variable:

//cp = 2 (default)

if high[cp] >= highest[2*cp+1](high) then
 LH = 1
else
 LH=0
endif

if low[cp] <= lowest[2*cp+1](low)  then
 LL= -1
else
 LL=0
endif

if LH=1 then
 hil = high[cp]
endif

if LL  = -1 then
 LOL=low[cp]
endif


return lol coloured(255,0,0) as "Low Fractal",hil coloured(0,255,0) as "High Fractal"

/////////////end
Comments
You must be logged in to post a comment.

Dear Nicolas, all the best for 2019 and thanks for this contribution. I love this indicator, because it combines both powerful Regression and Williams Fractals concepts. Since I am not skilled enough to convert this into an automated scalping system, I really would appreciate if you could give an advice how to code the long/short signals here (see question above from „verygrubby“). At least it would be very helpful to me, to know how I can generate an acoustic signal (just a „beep“) in addition to the point plotting. I know, how to create alerts (https://www.prorealtime.com/en/videos_tutorial/135_create_alerts) but code-generated alerts would be much more flexible. Thanks a lot in advance!

Hi Nicolas, I am trying to change this indicator to work with 3 candles instead of 5 but cannot get it to work properly when changing the CP. Any suggestions please? Regards Patric


How its possible to change the number of candles needed for the fractal formed??? Thanks

oops sorry.. i manage to get that out!! thanks!!
Hi Nicolas, is it possible to make this into the black background?? as when you put this into the black background on PRT.. it shows a white colour in between the green and red lines?

Thank you. I could upload it on the Pro Real Time platform, but it is not the same indicator in the Image. It shows a green segmented line above, a red segmented line below and a Grey area between them. I need an indicator for the poitioning of a continuously moving stop loss (like a trailng stop). Here it is better explaied: https://www.dailyfx.com/forex/education/trading_tips/daily_trading_lesson/2014/05/09/The-More-Intelligent-Trailing-Stop.htmlhttps://www.dailyfx.com/forex/education/trading_tips/daily_trading_lesson/2014/05/09/The-More-Intelligent-Trailing-Stop.html

Merci Nicolas, j'ai pris l'option points ce qui fait des quasi segment sur des UT courtes ( jour) mais en hebdo c'est plus light, est-ce possible d'avoir un segment continu (l'option proposée par PRT ligne + points génère des lignes reliant les fractales ce qui alourdit le graphe). Merci par avance

Hi All, I've made some fixes & upgrades so that this single script can either used as an overlay, as a separate indicator panel, or even as a "function" to provide a basic signal (up/down only) for use in automated trading: // Required variables (default) [description]: // - N (2) [Real-time delay / bars to look both back and forward] bwfSig = 0 r = 255 g = 255 b = 255 IF (High[N] >= Highest[2*N+1](High)) AND (High[N] > Highest[N](High)) THEN bwfSig = -1 ELSIF (Low[N] <= Lowest[2*N+1](Low)) AND (Low[N] < Lowest[N](Low)) THEN bwfSig = 1 ENDIF IF bwfSig = -1 THEN DRAWARROWDOWN(barindex[N], high[N] + Averagetruerange[100]/3) Coloured(255,10,10) r = 204 g = 0 b = 0 ELSIF bwfSig = 1 THEN DRAWARROWUP(barindex[N], low[N] - Averagetruerange[100]/3) Coloured(0,255,0) r = 0 g = 153 b = 0 ENDIF RETURN bwfSig Coloured (r,g,b) Style(Histogram, 1) Again, this does not return the actual levels but that would be trivial to add in as a future upgrade. Also note that each signal will arrive 'N' periods late - but that is the nature of the beast! Enjoy.