

B.M.I. Angle of MA
March 1, 2019, 9:53 AM
Indicators
3 Comments
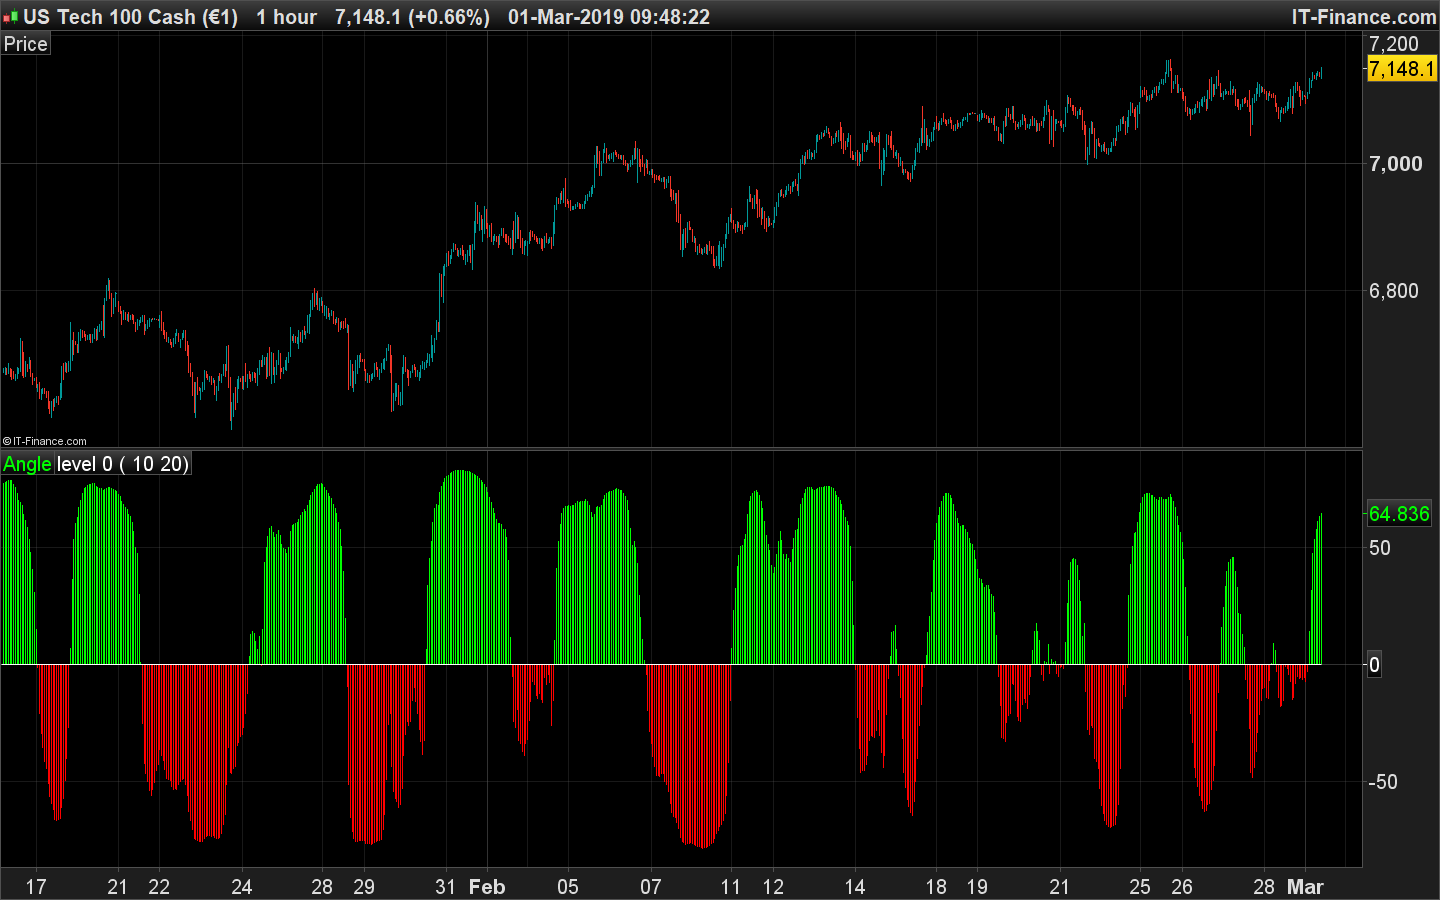
The purpose of this indicator is to plot the supposed angle that makes a moving average of X period. The higher / lower the value, the strongest is the trend, it can also be interpreted as the speed of the market.
Other methods of calculation and discussions about this concept in this topic: Discussing the strategy VECTORIAL DAX (M5)
// --- settings
//Periode = 10  //Période de la MM
//nbChandelier= 20 // Nombre de chandeliers sur lesquels on évalue la pente
// --- end of settings

MM = Exponentialaverage[Periode](close)
ADJASUROPPO = (MM-MM[nbchandelier]*pipsize) / nbChandelier
ANGLE = (ATAN(ADJASUROPPO))
if angle>0 then
 r=0
 g=255
else
 r=255
 g=0
endif


RETURN angle coloured(r,g,0) style(histogram) as "Angle", 0 as "level 0"
Download
Filename:
B.M.I.-ANGLE.itf
Downloads:
405
Veteran
Operating in the shadows, I hack problems one by one. My bio is currently encrypted by a complex algorithm. Decryption underway...
Author’s Profile
Loading...