Aroon Oscillator
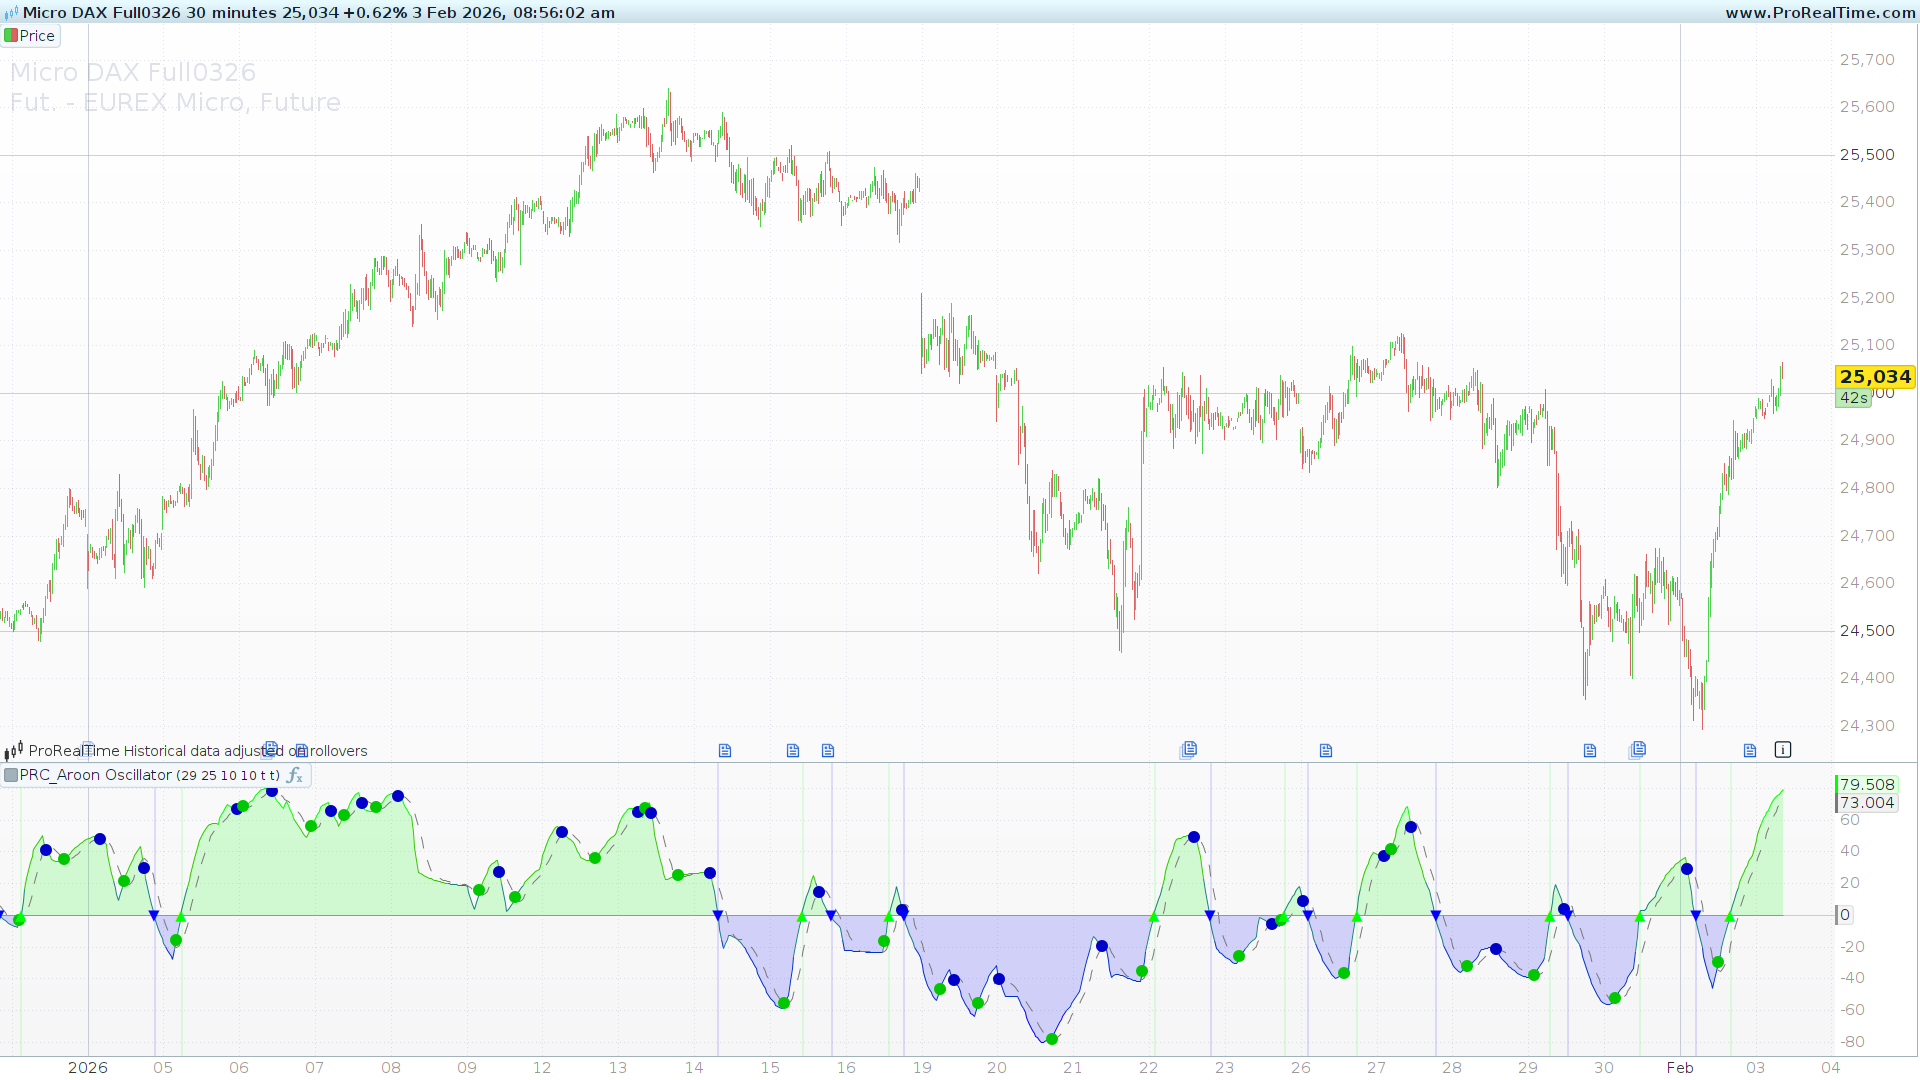
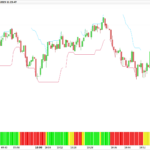
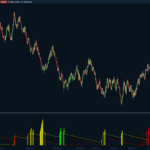
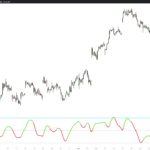
The Aroon Oscillator [by BigBeluga] is a high-performance evolution of the classic Aroon indicator. While the standard Aroon is excellent for identifying the start of a new trend, it often suffers from lag during market transitions. This version solves that problem by integrating John Ehlers’ Zero Lag Filter logic.
What Makes This Version Unique?
The standout feature of this indicator is its mathematical approach to noise reduction. Instead of using a simple moving average that inherently lags behind price, this script implements a Dynamic Zero Lag Filter.
The Zero Lag Advantage
Most filters smooth data by averaging past prices, which creates a delay between the market move and the indicator’s reaction. This code uses an Error-Correction loop:
- It calculates an initial EMA of the Aroon source.
- It then runs a FOR loop to test multiple “Gain” values (from -1.0 to +1.0).
- It identifies the “Best Gain”—the one that results in the least error compared to the actual price action.
- The result is an oscillator that is incredibly smooth yet reacts almost instantly to trend shifts.
Visual Interpretation & Signals
The indicator provides two distinct layers of market analysis:
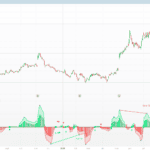
- Trend Following (Zero-Line Crossovers): When the oscillator crosses above zero, a bullish trend is confirmed (Green background/Triangle). A cross below zero signals a bearish shift (Blue background/Triangle).
- Mean Reversion (Signal Line Crossovers): The grey dotted line acts as a signal line. When the oscillator crosses its signal line while at extreme levels, it indicates a potential “Mean Reversion” setup (plotted as dots on the oscillator line).
Dynamic Color Zones
- Bright Green: Strong Bullish Momentum (Oscillator > 60).
- Deep Blue: Strong Bearish Momentum (Oscillator < -60).
- Teal: Neutral/Transition zone (-20 to 20).
Configuration & Parameters
The indicator is highly customizable to fit different trading styles:
- aroonLen (Default: 29): The lookback period for the standard Aroon calculation.
- smoothLen (Default: 25): The period for the Zero Lag smoothing. Higher values result in a smoother curve.
- signalLen (Default: 10): The period for the SMA signal line used for mean reversion signals.
- gainLimit (Default: 10): Controls the sensitivity of the Ehlers error-correction loop.
- plotMRev / plotTrend: Toggle switches (1 = On, 0 = Off) to show or hide the visual markers on the chart.
ProBuilder Code
// -------------------------------------------------
//PRC_Aroon Oscillator [BigBeluga]
//version = 0
//02.02.2026
//Iván González @ www.prorealcode.com
//Sharing ProRealTime knowledge
// -------------------------------------------------
// --- PARAMETROS ---
// -------------------------------------------------
aroonLen = 29       // Aroon Length
smoothLen = 25      // Zero Lag Smooth period
signalLen = 10      // Signal Line (SMA)
gainLimit = 10      // Gain Limit para Zero Lag Ehlers
plotMRev = 1        // 1 = Mostrar Mean Reversion signals, 0 = No
plotTrend = 1       // 1 = Mostrar Trend signals, 0 = No
// -------------------------------------------------
// --- AROON UP / DOWN ---
// -------------------------------------------------
aroonSrc = AroonUp[aroonLen]-aroondown[aroonLen]//myaroonUp - myaroonDn
// -------------------------------------------------
// --- ZERO LAG FILTER (John Ehlers) ---
// -------------------------------------------------
myAlpha = 2.0 / (smoothLen + 1)

IF barindex <= aroonLen THEN
   myEma = aroonSrc
   ec = aroonSrc
ELSE
   // EMA estandar
   myEma = myAlpha * aroonSrc + (1 - myAlpha) * myEma[1]

   // Buscar mejor ganancia (-1.0 a +1.0, paso 0.1)
   leastError = 1000000
   bestGain = 0

   FOR testVal = 0 TO 2 * gainLimit DO
      // testVal 0..20 -> testGain -1.0..+1.0
      testGain = (testVal - gainLimit) / 10.0
      testEc = myAlpha * (myEma + testGain * (aroonSrc - ec[1])) + (1 - myAlpha) * ec[1]
      testError = ABS(aroonSrc - testEc)
      IF testError < leastError THEN
         leastError = testError
         bestGain = testGain
      ENDIF
   NEXT

   // EC final con la ganancia optima
   ec = myAlpha * (myEma + bestGain * (aroonSrc - ec[1])) + (1 - myAlpha) * ec[1]
ENDIF

aroonOsc = ec
// -------------------------------------------------
// --- SIGNAL LINE (SMA) ---
// -------------------------------------------------
sigLine = average[signalLen](aroonOsc)
// -------------------------------------------------
// --- DETECCION DE CRUCES ---
// -------------------------------------------------
longSig = (aroonOsc crosses over 0)
shortSig = (aroonOsc crosses under 0)
revUpSig = (aroonOsc crosses over sigLine)
revDnSig = (aroonOsc crosses under sigLine)
// -------------------------------------------------
// --- COLOR OSCILADOR ---
// -------------------------------------------------
IF aroonOsc > 60 THEN
   r1 = 0
   g1 = 255
   b1 = 0
ELSIF aroonOsc > 20 THEN
   r1 = 50
   g1 = 200
   b1 = 0
ELSIF aroonOsc > -20 THEN
   r1 = 25
   g1 = 128
   b1 = 128
ELSIF aroonOsc > -60 THEN
   r1 = 0
   g1 = 50
   b1 = 200
ELSE
   r1 = 0
   g1 = 0
   b1 = 255
ENDIF
// -------------------------------------------------
// --- COLOR FILL (zona entre oscilador y cero) ---
// -------------------------------------------------
IF aroonOsc >= 0 THEN
   rFill = 0
   gFill = 255
   bFill = 0
ELSE
   rFill = 0
   gFill = 0
   bFill = 255
ENDIF
COLORBETWEEN(aroonOsc, 0, rFill, gFill, bFill, 40)
// -------------------------------------------------
// --- BACKGROUND en cruces con cero ---
// -------------------------------------------------
IF longSig AND plotTrend THEN
   BACKGROUNDCOLOR(0, 255, 0, 30)
ENDIF
IF shortSig AND plotTrend THEN
   BACKGROUNDCOLOR(0, 0, 255, 30)
ENDIF
// -------------------------------------------------
// --- SENALES VISUALES EN PANEL DEL OSCILADOR ---
// -------------------------------------------------
// Trend signals: punto en linea cero
IF longSig AND plotTrend THEN
   drawtext("▲",barindex,0)coloured(0, 255, 0)
ENDIF
IF shortSig AND plotTrend THEN
   drawtext("▼",barindex,0)coloured(0, 0, 255)
ENDIF

// Mean Reversion: punto en el oscilador
IF revUpSig AND plotMRev THEN
   DRAWPOINT(barindex, aroonOsc, 3) coloured(0, 200, 0)
ENDIF
IF revDnSig AND plotMRev THEN
   DRAWPOINT(barindex, aroonOsc, 3) coloured(0, 0, 200)
ENDIF

// -------------------------------------------------
RETURN aroonOsc coloured(r1, g1, b1) AS "Aroon Osc", sigLine coloured(120, 120, 120) style(dottedline2) AS "Signal", 0 coloured(150, 150, 150) AS "Zero"