

Anderson Regression Line Stretch ARLS
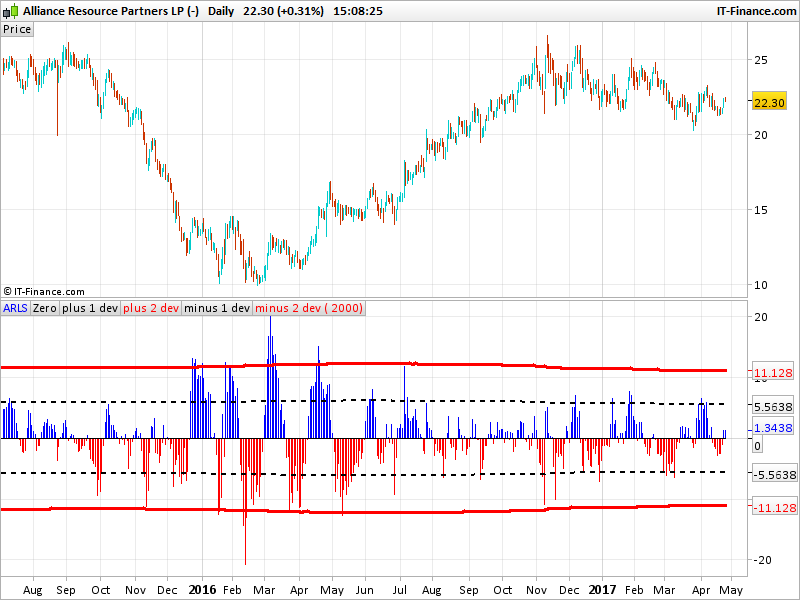
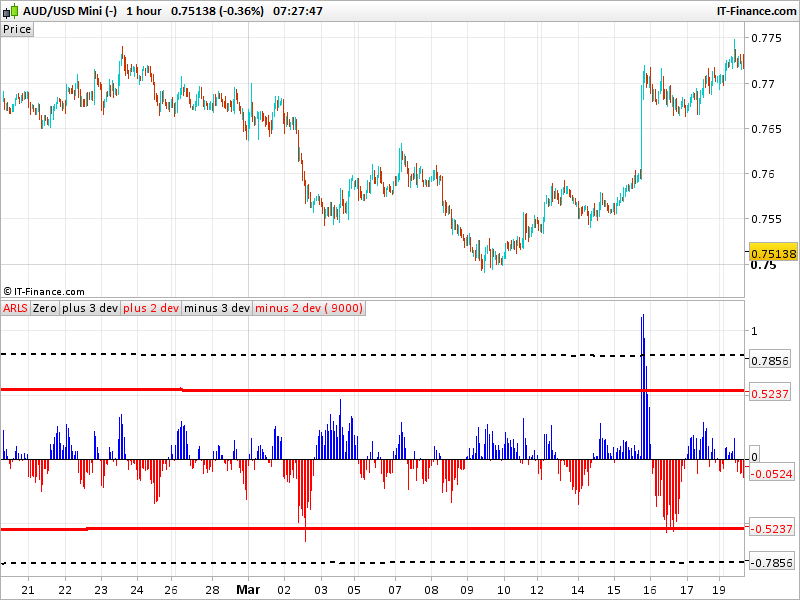
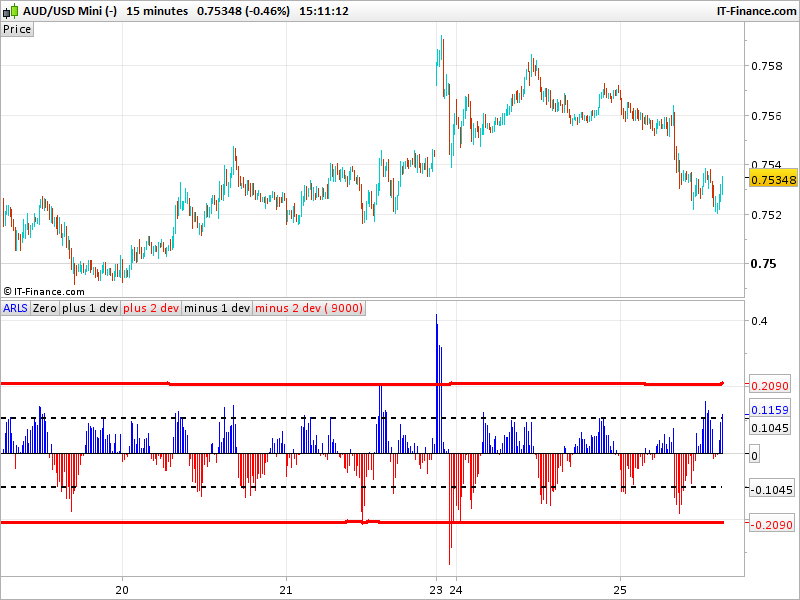
The Anderson Regression Line Stretch (ARLS) is an oscillator indicator conceptualised by me inspired by this paper that I found online (http://www.vantharp.com/Tharps-Thoughts/608_Dec_19_2012.html). The indicator measures the distance that price has moved away from its 30 period linear regression line expressed as a percentage of the current market price. If markets are orderly, price should not “stretch” too far away from the 30 period regression line. Therefore, statistically aberrant “stretches” beyond 2 standard deviations should be analysed by the trader. In order to make the indicator more useful, we apply +/- 2 & +/- 3 standard deviation lines on the ARLS oscillator. We deliberately do not plot a +/-1 standard deviation as this captures 68% of oscillation and it is the extreme moves (i.e. 2 & 3 standard deviations) that we want to identify for trading set ups. When the ARLS moves beyond the 2 standard deviation level, this should be noted and the trader should look at price action to see where price is in the context of the overall market trend. Markets that have experienced a prolonged up/downtrend and have moved beyond 2 standard deviations should be on watch for a statistical reversion. The price reversion should, at a minimum, go back to the 30 period regression line, which is interpreted as the current direction of travel for price. Another scenario is for price to remain steady and the regression line to catch up with price. The indicator is best combined with other statistical price observations such as ATR multiples and Bollinger bands to add context to the ARLS.
Text excerpt from the definition of the indicator posted by rowestock in this topic: https://www.prorealcode.com/topic/anderson-regression-line-stretch/
The upper and lower bands made of 2 and 3 standard deviation of the oscillator is calculated within the last ‘deviationP’ period which can be enlarged to get a more statistical deviation of the whole data set. Be sure that your current chart has enough bars to calculate completely this period.
//settings
//deviationP=1000
//end of settings

// Define variables
a=LinearRegression[30](close)
b=Close

// Calculation of difference between the 30 period regression line and the last price expressed as a percentage of the current price
c=(b-a)/b*100
if c>0 then
 r=0
 b=255
else
 r=255
 b=0
endif

dev=std[deviationP](c)

return c coloured(r,0,b) style(histogram) as "ARLS", 0 as "Zero", 0+3*dev style(dottedline,2) as "plus 3 dev", 0+2*dev coloured(255,0,0) style(line,3) as "plus 2 dev", 0-3*dev style(dottedline,2) as "minus 3 dev", 0-2*dev coloured(255,0,0) style(line,3)  as "minus 2 dev"