

Andean Oscillator
The Andean Oscillator is a volatility-based momentum indicator that tries to measure the strength of bullish and bearish pressure separately, rather than combining them into a single line like most oscillators do.
How it works
The core idea is to track two exponential envelopes around price, one from above (the “up” envelope) and one from below (the “down” envelope). These envelopes are not simple moving averages. They use an EMA-style smoothing formula, but with a twist: they only move in one direction. The upper envelope can only stay flat or move down toward price, and the lower envelope can only stay flat or move up toward price. This makes them adaptive, ratchet-style boundaries that compress around price over time.
The alpha parameter is the standard EMA coefficient, calculated as 2 / (length + 1), so with the default length of 50, you get alpha = ~0.039.
The indicator actually computes two versions of each envelope, one based on raw price (up1, dn1) and one based on squared price (up2, dn2). This is the clever part.
The bull and bear lines
Once the envelopes are computed, the indicator calculates:
- Bull = square root of (dn2 minus dn1 squared)
- Bear = square root of (up2 minus up1 squared)
Mathematically, this is extracting the standard deviation of price relative to each envelope. It is similar to how you would compute the standard deviation from a mean and a mean-of-squares. The bull line reflects how much price deviates from its lower boundary, and the bear line reflects how much it deviates from its upper boundary.
In practice, the bull line rises when price is making sustained upward moves away from the lower envelope, and the bear line rises when price is making sustained downward moves away from the upper envelope.
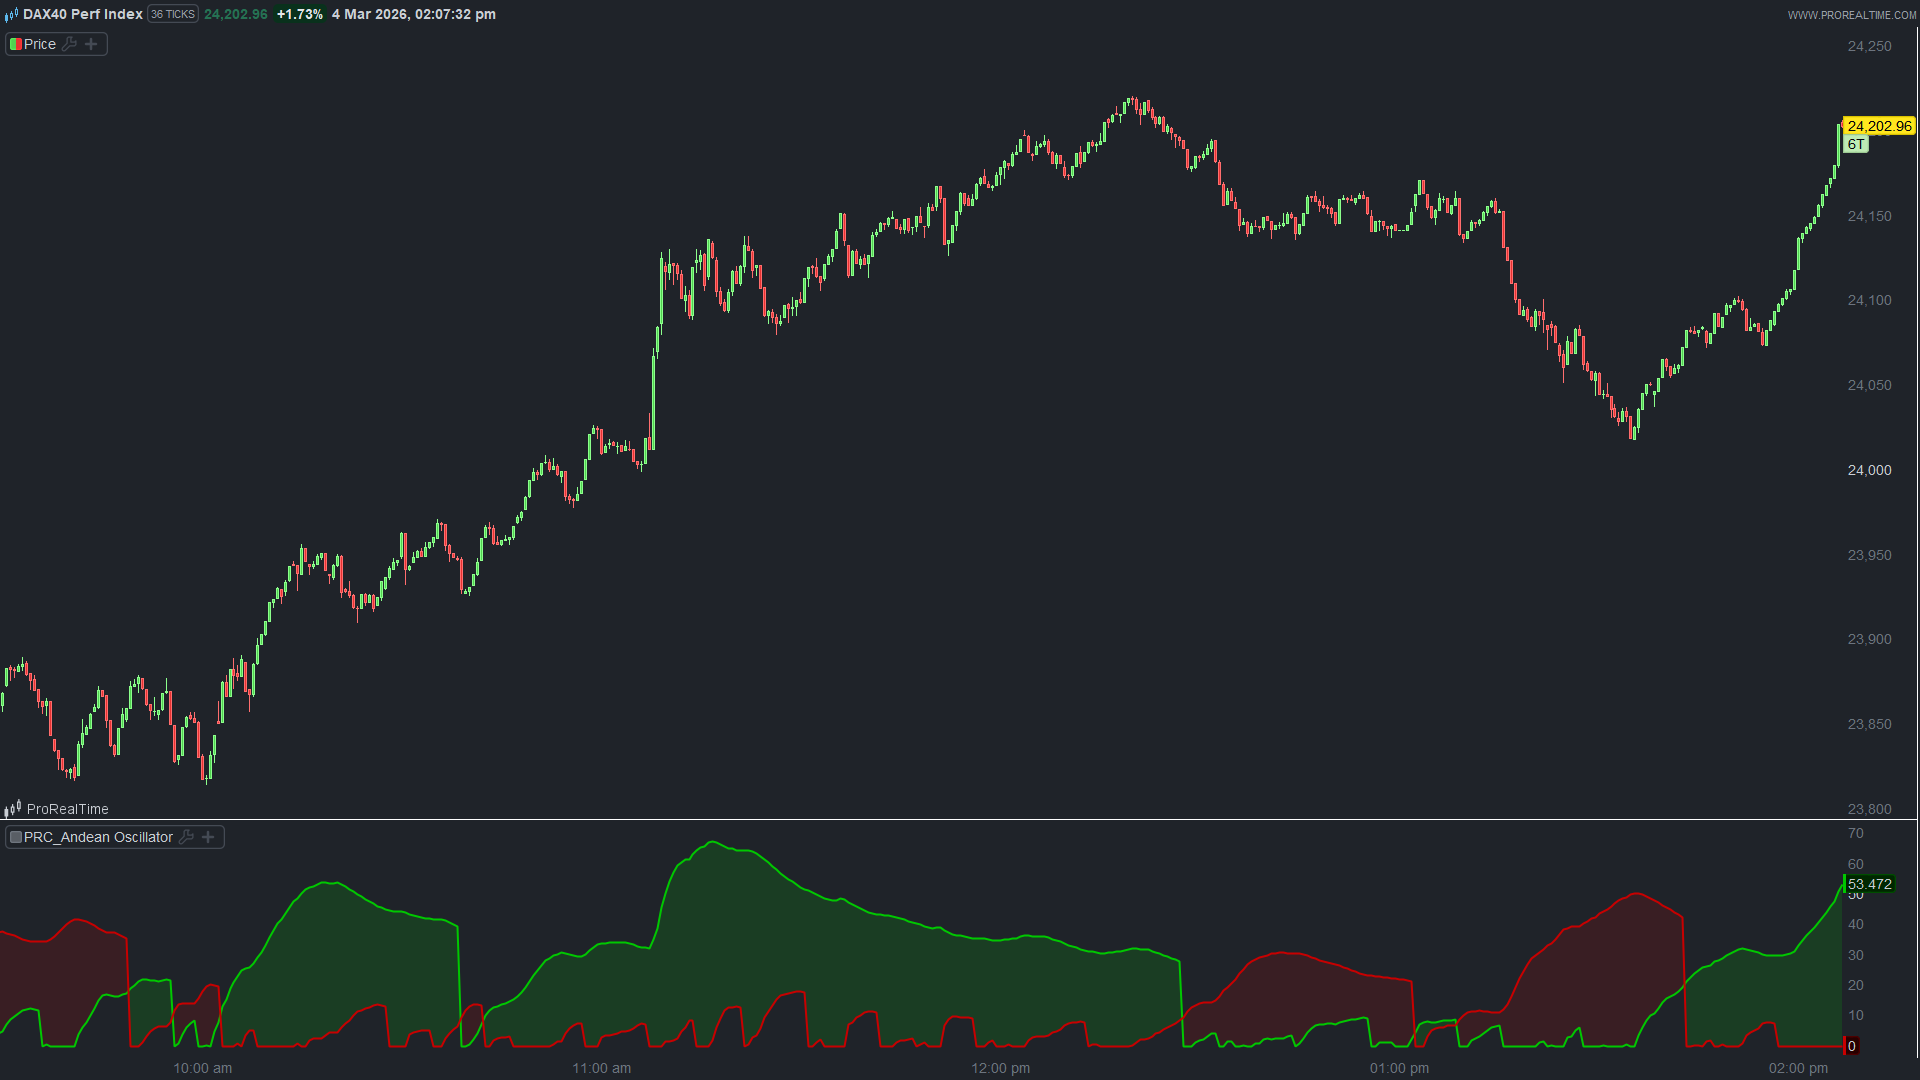
How to read it
- When the green (bull) line is above the red (bear) line and rising, it signals bullish momentum.
- When the red (bear) line crosses above green, it suggests bearish pressure is building.
- Crossovers between the two lines are the main trading signals.
- Both lines rising together can indicate high volatility or a transition period.
- Both lines falling and converging suggests the market is consolidating with low directional pressure.
What makes it different from RSI or MACD
Most oscillators collapse bullish and bearish information into a single value. The Andean Oscillator keeps them separate, so you can see the relative magnitude of each force at any given time. It also does not use a fixed lookback average in the traditional sense, since the ratchet mechanism means past extremes are remembered asymmetrically.
The length parameter controls how slowly the envelopes adapt. A longer length means the envelopes are stickier and react more slowly to price changes, which produces smoother but more lagged signals.
// -------------------------------------------------------
// Andean Oscillator - ProRealTime / ProBuilder version
// Original concept by alexgrover (TradingView)
// Ported to ProRealTime by Nicolas - ProRealCode
// www.prorealcode.com
// -------------------------------------------------------
// Parameters
length = 50

// EMA alpha coefficient
alpha = 2 / (length + 1)

// Initialization guard on the very first bar
once up1 = CLOSE
once up2 = CLOSE * CLOSE

if barindex>length then
   // -------------------------------------------------------
   // Upper envelope (tracks price from above)
   // Ratchet mechanism: can only move downward toward price
   // -------------------------------------------------------
   up1 = MAX(MAX(CLOSE, OPEN), up1[1] - (up1[1] - CLOSE) * alpha)
   up2 = MAX(MAX(CLOSE * CLOSE, OPEN * OPEN), up2[1] - (up2[1] - CLOSE * CLOSE) * alpha)

   // -------------------------------------------------------
   // Lower envelope (tracks price from below)
   // Ratchet mechanism: can only move upward toward price
   // -------------------------------------------------------
   dn1 = MIN(MIN(CLOSE, OPEN), dn1[1] + (CLOSE - dn1[1]) * alpha)
   dn2 = MIN(MIN(CLOSE * CLOSE, OPEN * OPEN), dn2[1] + (CLOSE * CLOSE - dn2[1]) * alpha)

   IF dn1 = 0 THEN
      dn1 = CLOSE
   ENDIF
   IF dn2 = 0 THEN
      dn2 = CLOSE * CLOSE
   ENDIF

   // -------------------------------------------------------
   // Bull and Bear lines
   // These are standard deviations of price relative to each envelope
   // Bull rises when price pushes strongly above the lower envelope
   // Bear rises when price pushes strongly below the upper envelope
   // -------------------------------------------------------
   bull = SQRT(ABS(dn2 - dn1 * dn1))
   bear = SQRT(ABS(up2 - up1 * up1))

   // -------------------------------------------------------
   // Optional: color the area between the two lines
   // Green when bull > bear, red otherwise
   // -------------------------------------------------------
   IF bull > bear THEN
      r=0
      g=200
      b=0
   ELSE
      r=200
      g=0
      b=0
   ENDIF
   ColorBetween(bull, bear, r, g,b, 40)
endif

// -------------------------------------------------------
// Output
// -------------------------------------------------------
RETURN bull COLOURED(0, 200, 0) STYLE(LINE, 2) AS "Bull", bear COLOURED(200, 0, 0) STYLE(LINE, 2) AS "Bear"