

Pivot Trendline Support Screener
June 16, 2026, 8:24 AM
Screeners
0 Comments
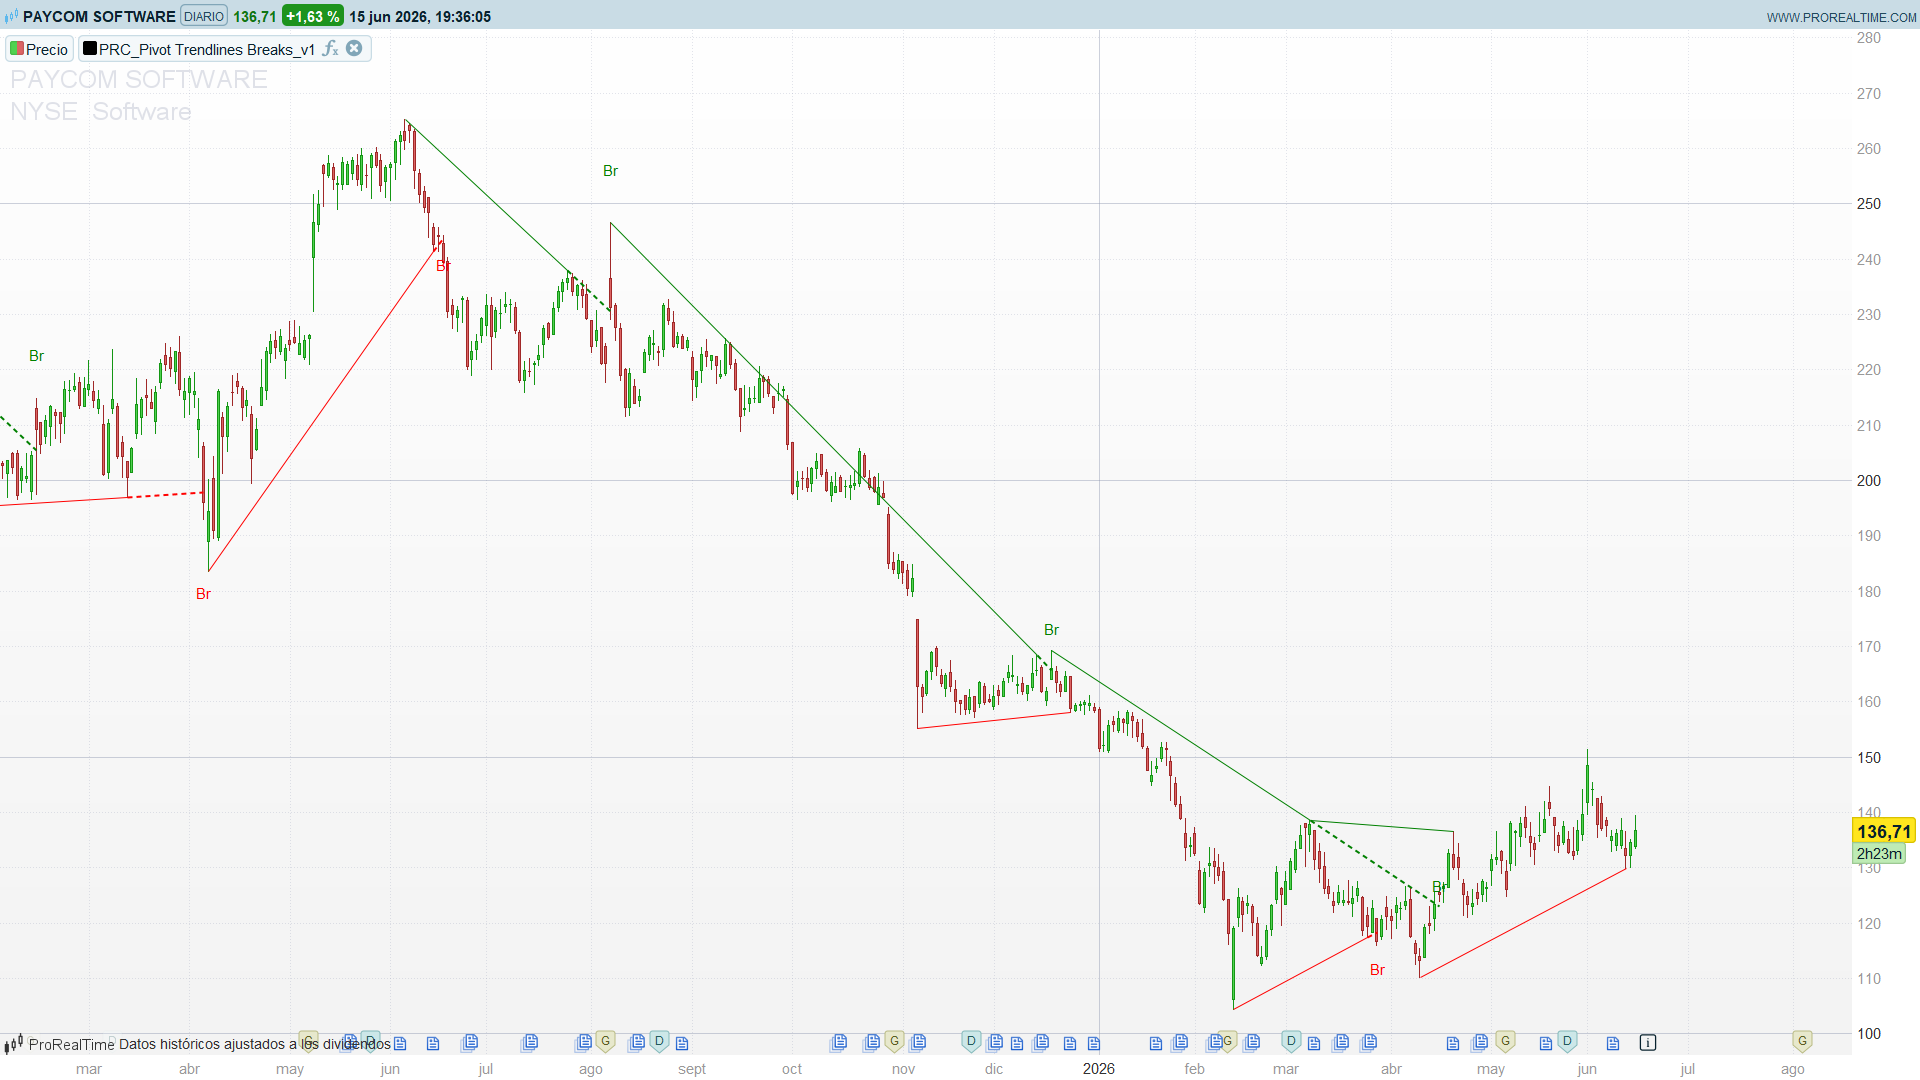
Drawing trendlines by hand does not scale. Spotting which instruments are right now leaning on a rising support line means flipping through hundreds of charts one by one. This ProScreener does it automatically: it returns the instruments whose latest candle is testing the projected line of an ascending trendline support without having broken it yet, the classic spot to watch for a bounce.
2. How It Works
An ascending support is built from two higher lows. The straight line through them is projected forward, and that projection is the level where price should bounce if the bullish structure holds. The screener rebuilds that line and checks, on the last closed candle, whether price has come back to it:
- Detect the last two pivot lows using
lowestand therepaintparameter. - Project the connecting line to the current bar with the point-slope formula:
yl = y1 + (xl − x1) × (y2 − y1) / (x2 − x1)- Filter by requiring three things at once:
- the support is ascending (
y2 > y1, rising lows), - the candle low is close to the projected line (within a tolerance expressed as a % of price),
- the close is still above the line (price respects it, it has not broken down).
Output columns:
- Support: value of the projected line on the current bar (the level to watch).
- Low: the candle low, to judge how tight the test is.
- Close: the current close.
//----------------------------------------------
//PRC_Pivot Trendlines with Breaks - Screener
//version = 1
//15.06.2026
//Ivan Gonzalez @ www.prorealcode.com
//Sharing ProRealTime knowledge
//----------------------------------------------
// Candle near the projection of the ascending support (pivot lows).
//----------------------------------------------
PivotLen = 20
repaint  = 0
tolPct   = 0.3    // proximity tolerance, in % of price

//--- Pivot lows
IF low[repaint*PivotLen+1] = lowest[repaint*PivotLen+PivotLen+1](low) THEN
   $ply[z] = low[repaint*PivotLen+1]
   $plx[z] = barindex-(repaint*PivotLen+1)
   z = z+1
ENDIF

y2 = $ply[max(z-1,1)]
x2 = $plx[max(z-1,1)]
y1 = $ply[max(z-2,1)]
x1 = $plx[max(z-2,1)]
xl = barindex
yl = y1+(xl-x1)*(y2-y1)/(x2-x1)

//--- Ascending support in force + candle near the line, not yet broken
ascending = y2 > y1
tol       = close*tolPct/100
nearLine  = abs(low - yl) <= tol
aboveLine = close >= yl

SCREENER[ascending AND nearLine AND aboveLine](yl AS "Support", low AS "Low", close AS "Close")
Download
Filename:
Screener_Pivot-Trendlines-Breaks.itf
Downloads:
10
Download
Filename:
Indicator_Pivot-Trendlines-Breaks_v1.itf
Downloads:
11

Legend
Operating in the shadows, I hack problems one by one. My bio is currently encrypted by a complex algorithm. Decryption underway...
Author’s Profile
Loading...