

1-2-3 Pivots Support and Resistance Lines On Any Indicator
This indicator is a modified version of my 1-2-3 Pivots Support and Resistance Lines indicator that can be found here:
https://www.prorealcode.com/prorealtime-indicators/1-2-3-pivots-support-and-resistance-lines/
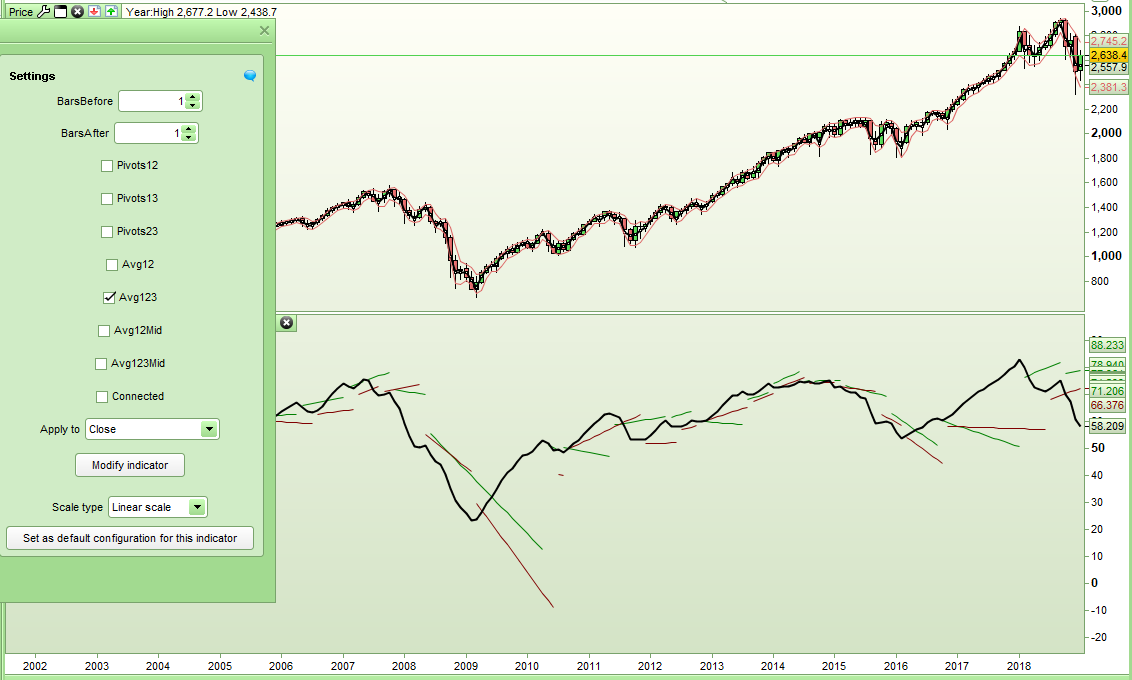
This new version allows you to plot the support and resistance lines (and the averages of them) that are based on the last three high and last three low points of an indicator. Just change the indicator in line 18 to the indicator of your choice. In the example here it is a fast average of RSI[14] but if you want a different indicator then change it to MyIndicator = Stochastic[5,10] for example.
Whenever a new pivot point is formed a new support or resistance lines start to be drawn that line up with previous high and low pivot points.
The last three swing highs and last three swing lows are used. By ticking or unticking the relevant box various support and resistance lines can be displayed or removed as follows:
- Pivots12 – Lines that are a continuation of a line connecting the last two high and low pivots.
- Pivots13 – Lines that are a continuation of a line connecting the last and the second to last high and low pivots.
- Pivots23 – Lines that are a continuation of a line connecting the second to last and third to last high and low pivots.
- Avg12 – Lines that are an average of the Pivots12 and Pivots13 lines.
- Avg123 – Lines that are an average of the Pivots12, Pivots13 and Pivots23 lines.
- Avg12Mid – A line that is mid way between the Avg12 support and resistance lines.
- Avg123Mid – A line that is mid way between the Avg123 support and resistance lines.
- Connected – All lines are drawn connected when a new pivot high or pivot low is formed
The pivot definition can be adjusted by changing the number of bars before and the number of bars after the high or low. So for example you can have a new pivot whenever a high has one candle lower either side of it or when it has two candles lower either side of it.
Breakout of support and resistance lines by an indicator can indicate a change of direction or the start of a new trend. The slope of the lines can be used to spot divergence between an indicator and price.
I advise downloading the ITF and importing it to your platform to get full functionality.
//Pivots123 Support and Resistance Lies On Indicator
//By Vonasi
//20190123

//DEFPARAM CalculateOnLastBars = 1000

//BarsAfter = 1
//BarsBefore = 1
//Pivots12 = 1
//Pivots13 = 1
//Pivots23 = 1
//Avg12 = 1
//Avg123 = 1
//Avg12Mid = 1
//Avg123 = 1
//Connected = 1

MyIndicator = exponentialaverage[5](RSI[14](customclose)) // Replace the indicator here with the indicator of your choice.

BarLookBack  = BarsAfter + 1
IF MyIndicator[BarsAfter] < lowest[BarsBefore](MyIndicator)[BarLookBack] THEN
 IF MyIndicator[BarsAfter] = lowest[BarLookBack](MyIndicator) THEN
  Support  = MyIndicator[BarsAfter]
 ENDIF
ENDIF
IF MyIndicator[BarsAfter] > highest[BarsBefore](MyIndicator)[BarLookBack] THEN
 IF MyIndicator[BarsAfter] = highest[BarLookBack](MyIndicator) THEN
  Resistance = MyIndicator[BarsAfter]
 ENDIF
ENDIF

cr12 = 0
cr13 = 0
cr23 = 0
cs12 = 0
cs13 = 0
cs23 = 0
csave3 = 0
crave3 = 0
csave2 = 0
crave2 = 0
cave3mid = 0
cave2mid = 0

if pivots12 then
 cr12 = 255
 cs12 = 255
endif

if pivots13 then
 cr13 = 255
 cs13 = 255
endif

if pivots23 then
 cr23 = 255
 cs23 = 255
endif

if avg123 then
 crave3 = 255
 csave3 = 255
endif

if avg12 then
 crave2 = 255
 csave2 = 255
endif

if avg123mid then
 cave3mid = 255
endif

if avg12mid then
 cave2mid = 255
endif

if resistance <> resistance[1] then
 hi3 = hi2
 hi2 = hi1
 hi3index = hi2index
 hi2index = hi1index
 hi1 = MyIndicator[BarsAfter]
 hi1index = BarIndex[BarsAfter]

 if not connected then
  cr12 = 0
  cr13 = 0
  cr23 = 0
  crave3 = 0
  crave2 = 0
  cave2mid = 0
  cave3mid = 0
 endif
endif

if support <> support[1] then
 lo3 = lo2
 lo2 = lo1
 lo3index = lo2index
 lo2index = lo1index
 lo1 = MyIndicator[BarsAfter]
 lo1index = BarIndex[BarsAfter]

 if not connected then
  cs12 = 0
  cs13 = 0
  cs23 = 0
  csave3 = 0
  csave2 = 0
  cave2mid = 0
  cave3mid = 0
 endif
endif

//12
if hi2 > hi1 then
 nexthi12 = hi1 - (((hi2 - hi1) / (hi1index - hi2index)) * (barindex - hi1index))
endif

if hi2 < hi1 then
 nexthi12 = hi1 + (((hi1 - hi2) / (hi1index - hi2index)) * (barindex - hi1index))
endif

if lo2 > lo1 then
 nextlo12 = lo1 - (((lo2 - lo1) / (lo1index - lo2index)) * (barindex - lo1index))
endif

if lo2 < lo1 then
 nextlo12 = lo1 + (((lo1 - lo2) / (lo1index - lo2index)) * (barindex - lo1index))
endif

//13
if hi3 > hi1 then
 nexthi13 = hi1 - (((hi3 - hi1) / (hi1index - hi3index)) * (barindex - hi1index))
endif

if hi3 < hi1 then
 nexthi13 = hi1 + (((hi1 - hi3) / (hi1index - hi3index)) * (barindex - hi1index))
endif

if lo3 > lo1 then
 nextlo13 = lo1 - (((lo3 - lo1) / (lo1index - lo3index)) * (barindex - lo1index))
endif

if lo3 < lo1 then
 nextlo13 = lo1 + (((lo1 - lo3) / (lo1index - lo3index)) * (barindex - lo1index))
endif

//23
if hi3 > hi2 then
 nexthi23 = hi2 - (((hi3 - hi2) / (hi2index - hi3index)) * (barindex - hi1index))
endif

if hi3 < hi2 then
nexthi23 = hi2 + (((hi2 - hi3) / (hi2index - hi3index)) * (barindex - hi1index))
endif

if lo3 > lo2 then
 nextlo23 = lo2 - (((lo3 - lo2) / (lo2index - lo3index)) * (barindex - lo1index))
endif

if lo3 < lo2 then
 nextlo23 = lo2 + (((lo2 - lo3) / (lo2index - lo3index)) * (barindex - lo1index))
endif

nextloave3 = (nextlo12 + nextlo13 + nextlo23)/3
nexthiave3 = (nexthi12 + nexthi13 + nexthi23)/3
nextloave2 = (nextlo12 + nextlo13)/2
nexthiave2 = (nexthi12 + nexthi13)/2
ave123mid = (nexthiave3 + nextloave3)/2
ave12mid = (nexthiave2 + nextloave2)/2

RETURN nexthi12 coloured(0,128,0,cr12) style(line,1) as "Resistance12", nextlo12 coloured (128,0,0,cs12) style(line,1) as "Support12", nexthi13 coloured(0,128,0,cr13) style(line,1) as "Resistance13", nextlo13 coloured (128,0,0,cs13) style(line,1) as "Support13", nexthi23 coloured(0,128,0,cr23) style(line,1) as "Resistance23", nextlo23 coloured (128,0,0,cs23) style(line,1) as "Support23", nexthiave3 coloured(0,128,0,crave3) style(line,1) as "Resistance Average 1-2-3", nextloave3 coloured (128,0,0,csave3) style(line,1) as "Support Average 1-2-3", nexthiave2 coloured(0,128,0,crave2) style(line,1) as "Resistance Average 1-2", nextloave2 coloured (128,0,0,csave2) style(line,1) as "Support Average 1-2", ave123mid coloured (0,0,255,cave3mid) style(line,1) as "Average Mid 1-2-3", ave12mid coloured (0,0,255,cave2mid) style(line,1) as "Average Mid 1-2", MyIndicator style(line,2) as "My Indicator"