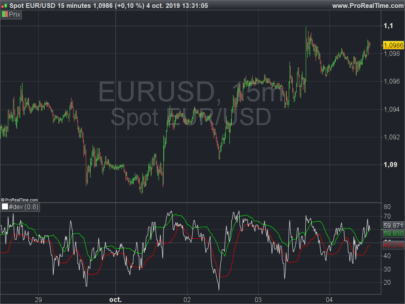
Returns the lower line of the Dynamic Zone RSI indicator.
The Dynamic Zone RSI oscillator is similar to a classic RSI with Bollinger Bands of 0.8 standard deviation applied on it.
Syntax:
|
1 |
dynamiczonersidown[RSIperiod,BBperiod](price) |
Where:
- RSIperiod: calculation period of the RSI oscillator (default is 14 periods)
- BBperiod: calculation period of the Bollinger Bands applied to the RSI (default is 20 periods)
DYNAMIC ZONE RSI Calculation: The “Dynamic Zone RSI” is an oscillator from 0 to 100 that indicates zones where the security is overbought or oversold. Unlike the classical RSI, the levels limiting the zones where the security is “overbought” or “oversold” are dynamic rather than fixed. The dynamic zones adjust depending on market conditions. Interpretation: If the Dynamic Zone RSI is higher than the limit of the upper level, the value is “overbought” and the price is likely to decrease.
On the other hand, if the Dynamic Zone RSI is lower than the limit of the lower level, the security is “oversold” and the price is likely to increase.
A bullish signal is generated when the Dynamic Zone RSI crosses over the limit of the lower level. A bearish signal is generated when the Dynamic Zone RSI crosses under limit of the the upper level.
Example:
|
1 2 3 |
a = DynamicZoneRSIDown[14,20](close) return a coloured(255,0,0) style(line,1) |
The lower line of the dynamic zone RSI is the same as:
|
1 |
c = average[20](rsi[14])-std[20](rsi[14])*0.8 |
 DynamicZoneRsiDown