How to use the ProRealTime Walk Forward analysis tool – FAQ

This article is a FAQ about the different questions that been asked on forums for the use of the new Walk Forward analysis tool of ProRealTime.

Why using Walk Forward analysis?

Prerequisites: what is the Walk Forward analysis? (to be read for a perfect comprehension of this article please!).

As I already talked here and there about over-fitting, it’s always a better idea to backtest a strategy on 70% of history while you develop it (IS), and then test it on the remaining 30% (OOS). If your result look similar in OOS than your IS test, the strategy have a better chance to continue performing the same way. Why? Because the 70% have certainly included a wide variety of price behaviour of the instrument (ranging, trending, market noises, economic news,..).

With the WF Module you can now multiply this kind of tests in the past history with X repetitions: understand X times making the same test in the past, optimise 70% and test in 30%, and so on until the end of the tests history.

Warning, Walk Forward analysis is not going to make a bad strategy over-optimized, better strategy less over-optimized.
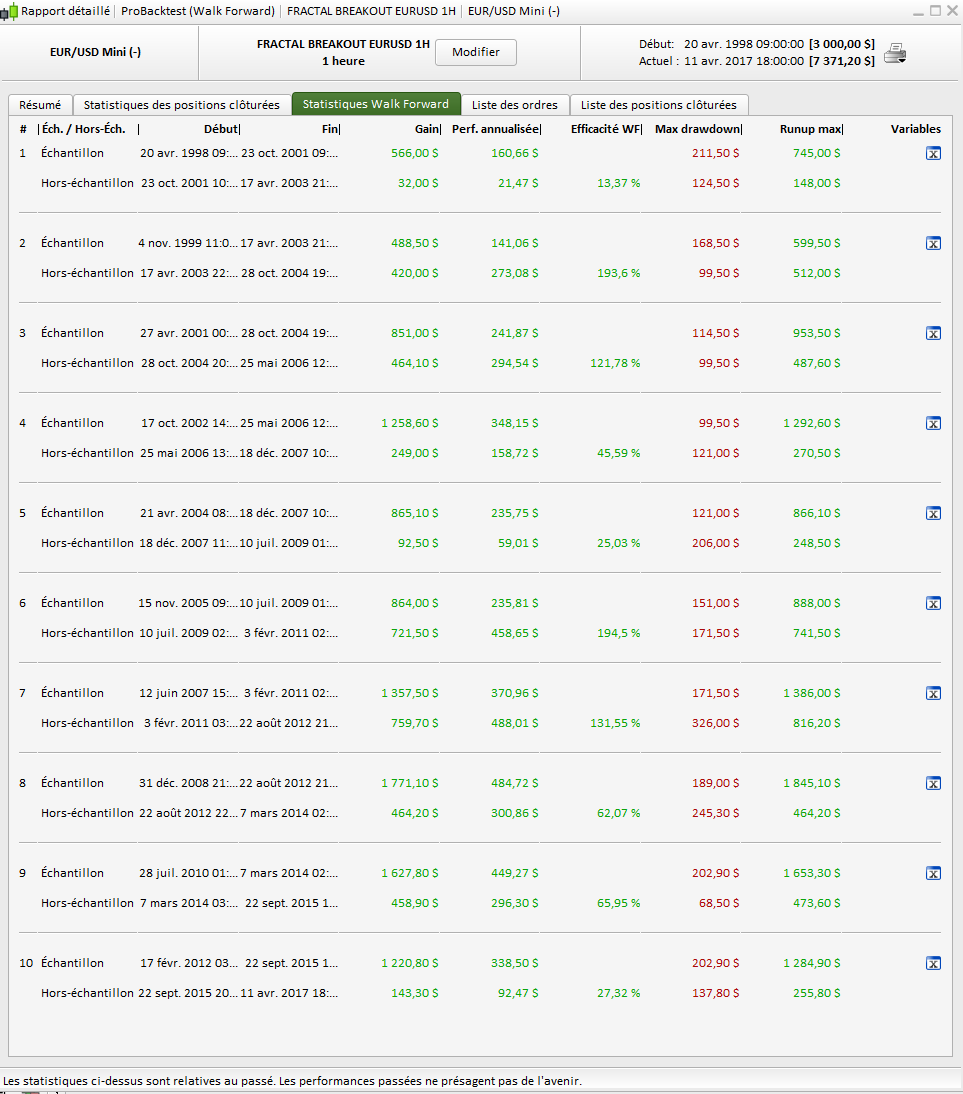
It is a tool that allows us to draw conclusions. In the Walk Forward tool, we have several instances, which allow us to simulate several times as a result of the trading ‘real time’ strategy and this for all the duration of our history. It could be done only once (only one occurrence), but we would only have one validation period. By multiplying the occurrences, we thus have more validation periods, allowing us to check if they have a good WFE.

Please keep in mind that this module is only suppose to help you have a clue about your strategy robustness by testing optimised variables in Out Of Sample periods (OOS), in 1 or more occurrences.


What is the WFE (Walk Forward Efficiency)?

The Walk Forward Efficiency is the “quality” ratio of the test to determine the robustness of the strategy.


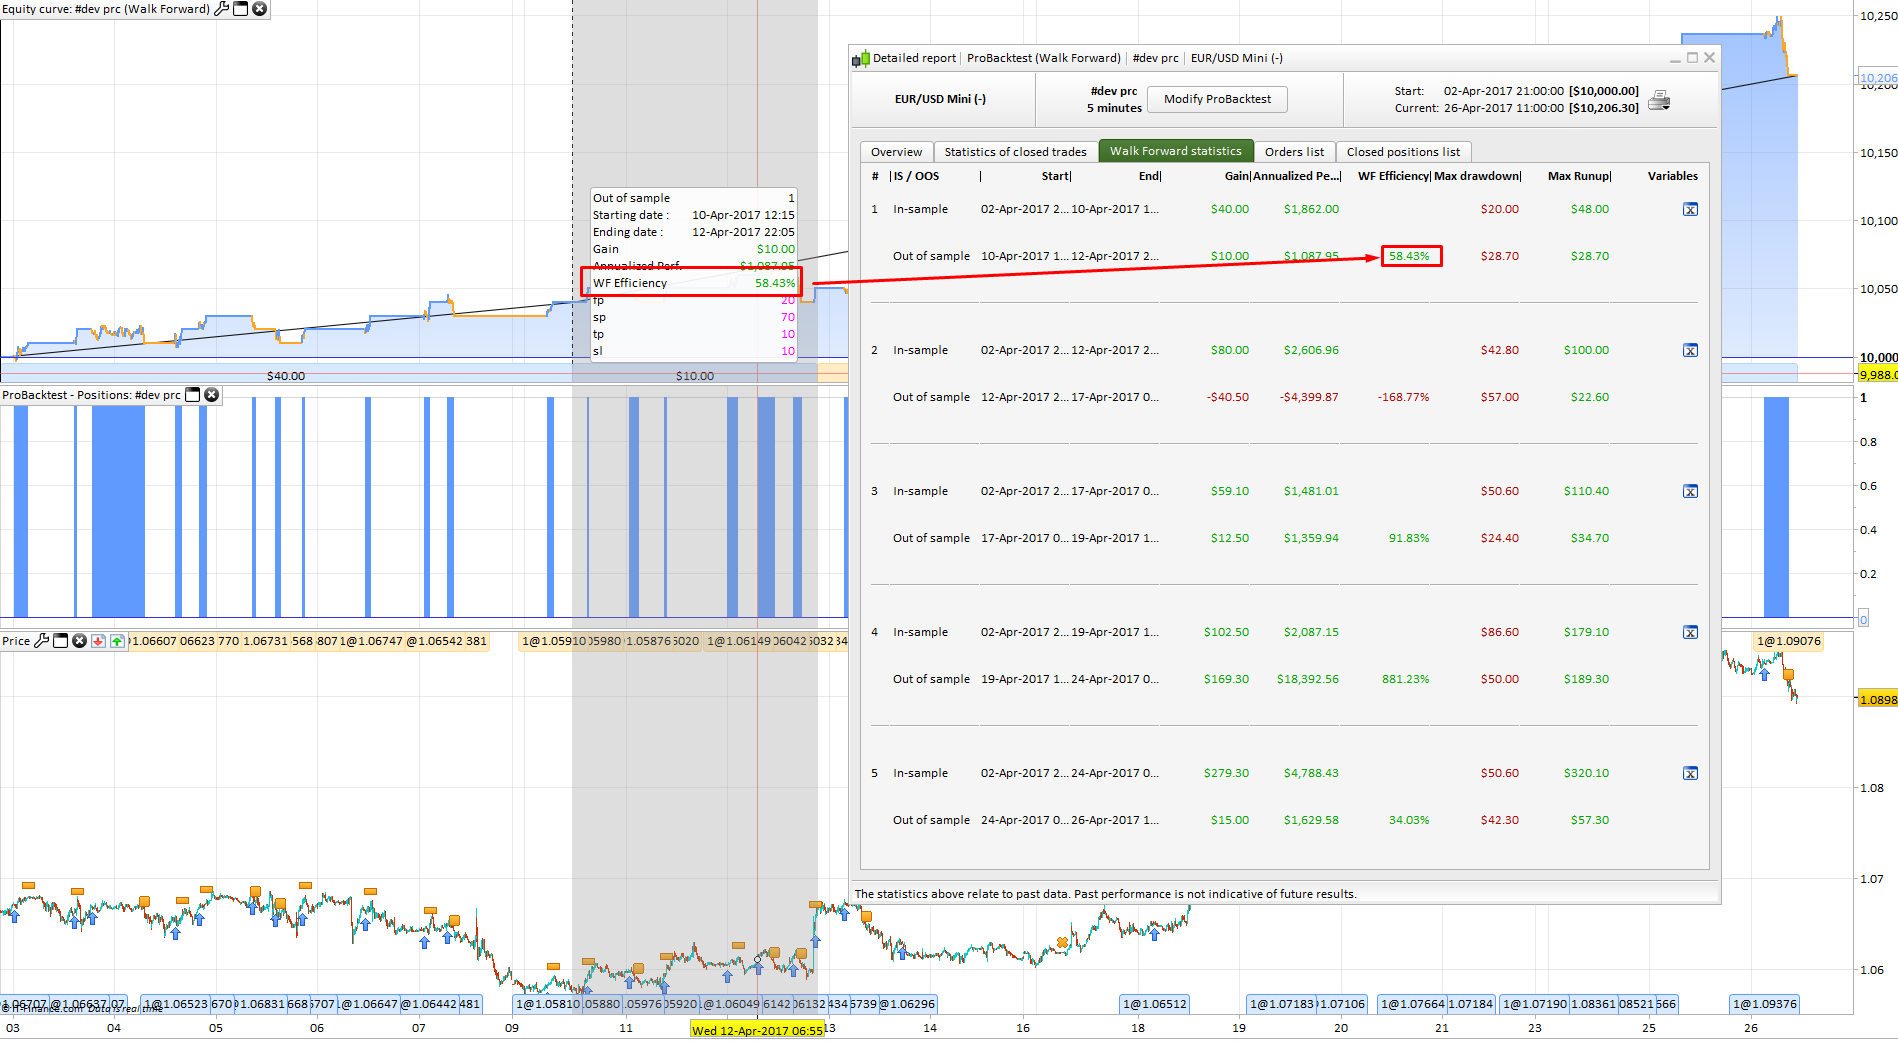
It is simply calculated by dividing the annualized return of the out-of-sample period (OOS) by the annualized return of the optimized sample (IS).
Logic, since these two periods do not have the same duration, we must be able to compare them together, so we annualize their performances.
If the WFE is greater than 50%, optimization is considered successful, since the performance of the strategy in the duration excluding the sample was at least 50% with respect to our optimization.
The more important it is, the better it would be. If it was lower, then probably optimization would have failed, the optimization would have led to an “over optimization”: one is too adapted to what happened and without worrying about how the strategy could perform in the future. It is here that takes advantage of this mode of optimization.

Warning: If an OOS period of the walk forward test is making too much profit comparing to the IS period, this is not so good. To be clear, the WFE (walk forward efficiency) must be superior to 50% (made at least 50% annualized profit than the In Sample period), but if it made.. let’s say 300%, this is something you couldn’t expect because it is not the “normal” behaviour of the optimised period (IS). Of course you would have been pleased by this result in real life, but your strategy were not designed to make so much profit! so it is not “normal”.

In conclusion, WFE>50% is good, but it should not be too high too 🙂 What we expect in an OOS test is that the strategy perform them same as in the IS period.


Which optimised variables are the most suitable for my strategy?

All of them are the best for each iteration that give you the best result for the whole backtest period. But it doesn’t mean that all ‘out of sample’ tests are good,
that’s the reason why the WFE (Walk Forward Efficiency) is given as the result of the test for each iteration.
The WFE calculate the ratio of the annual performance of the In Sample period (the optimised period) compared to the Out Of Sample period (the test period of the iteration). A good WFE must be superior to 50% (but not too high too, read paragraph above).
If your strategy is not over-fitted, the OOS period should have a result >= 50%.
You can add as many iterations as you like when you are optimising a strategy,
it can help you determine how much time your optimised variables are good according to the market behaviour and so when you need to optimise it again.

So the last optimised variables of your WF analysis should be the ones to keep for your real trading, if of course this last OOS test have at least a 50% Walk Forward Efficiency score and the whole strategy is considered as a robust one.

Walk forward analysis will tell you how and when you should re-optimise parameters of your strategy and see if it were a good idea to optimise them, because of the past behaviour of each optimised values in the out-of-sample territories of your backtest. I told you that you should take the last optimised values for the real trading.
It is true as long as the last backtest date is yesterday’s date and if you plan to launch your strategy today. Considering that a 70/30% walk forward test has been validated X times over the whole period of the backtest we can conclude that the optimisation should be run every X months.

A robust strategy is a strategy that adapts to the market and that benefits from the re-optimization and that is simulated with these X repetitions (5 by default).
If the WFE had been good on the X out-of-sample occurrences, then it could be said that the strategy is robust because it stalls properly with the market if optimized.
It can therefore be trusted for the future (so the period to be traded is then the Out Of Sample period).


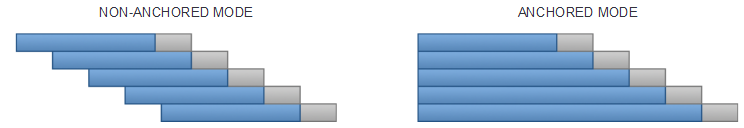
Anchored period or unanchored Out Of Sample?

There is no good or definitive answer to this question. It is up to you. For the anchored period, the beginning of the IN SAMPLE period window will stay fixed at the initial/original starting point of the backtest, while the unanchored one is always shifted forward for each test to encapsulate the chosen percentage of the whole history divided by the repetitions number.

If you asked me, I would tell you that I prefer the unanchored mode because of its accuracy with the recent instrument/security behaviour, while the anchored mode would represent an “average” of the whole history price behaviour.

Analogy with real-time trading

Let’s imagine you have optimised a strategy over the last year (from January to December 2016), this is the IN SAMPLE period. The result seems great to you and then you decide to give it a try with your live account, so since January 1st 2017 you are trading it live, this is the OUT OF SAMPLE period. In March you take a look at the results and they are not the one expected, they are very bad instead. In conclusion, you have lost 3 months and real money.

The WF module would have saved you from this inconvenience by making this job for you, on your computer screen while drinking a cup of coffee : optimize a set of data history and test it in the last set of it.

Because I seen so many times and so many people encountered this situation, I believe this tool was definitely something needed. It is now available, please use it! 🙂


3 different ways to use the new Walk Forward module

So to be clear, this is 3 ways to use the new Walk Forward module:

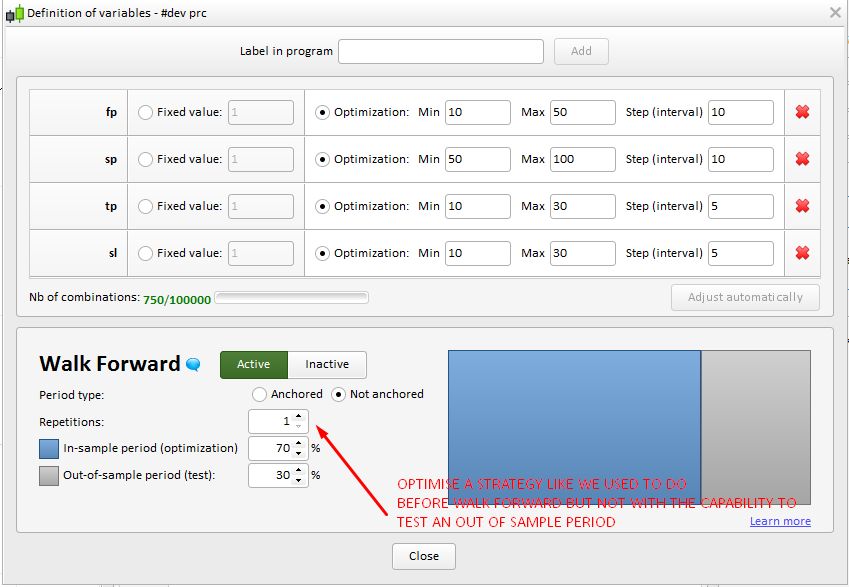
1/ if you want to optimise the old way, you can! but instead of using the old optimiser, use the WF module and use only 1 iteration with 70/30 (better chance to have a strategy to be not so over-fitted).

2/ you can also use the WF to determine how much (per your customized period, per year, per month, etc..) and so when relaunch a new optimisation by making many iterations in the WF window: if many of the OOS tests are >+50% (WFE=Walk Forward Efficiency), the strategy should be robust and benefit of X optimisations per period.

(lot of good WFE over 10 occurrences give us an estimated time period for this strategy that could perform well and so when we should re-optimised it).

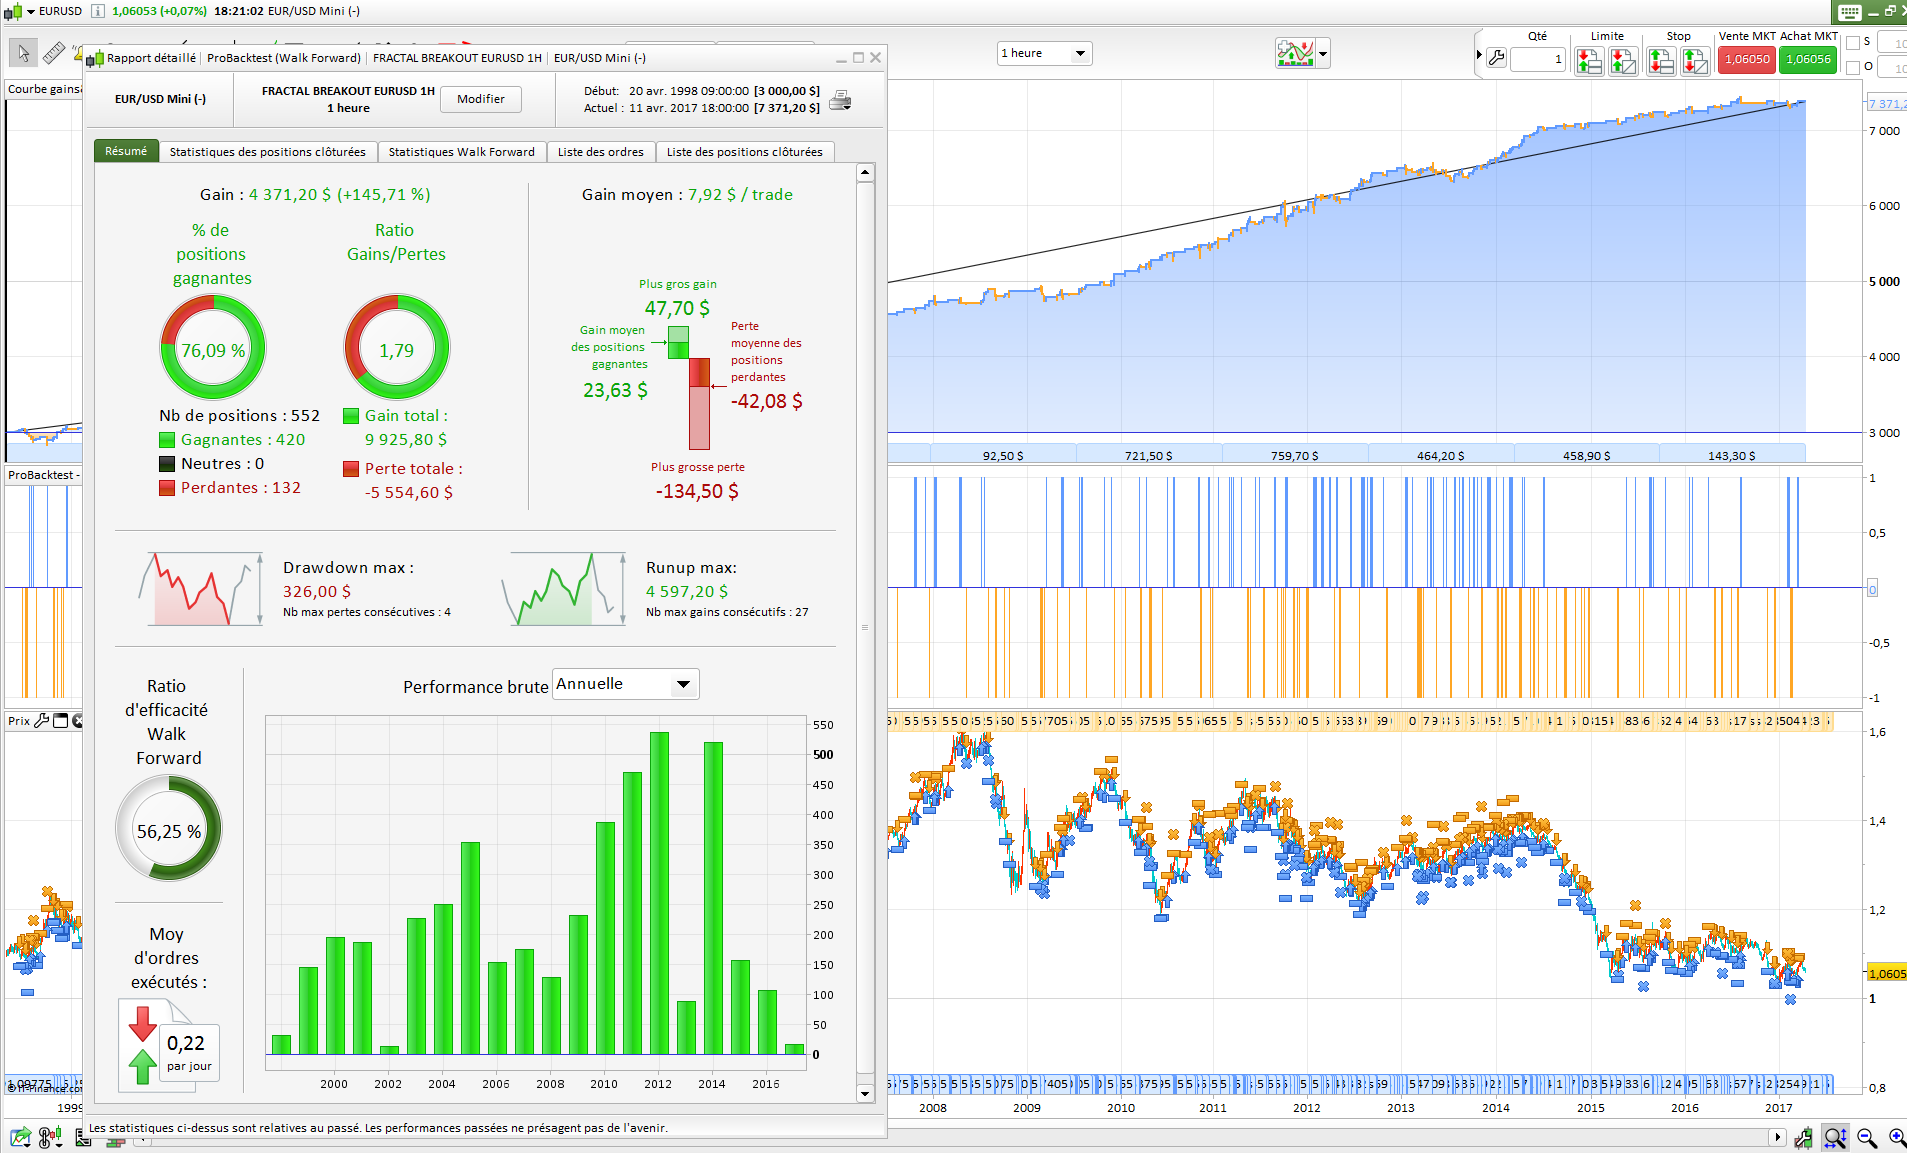
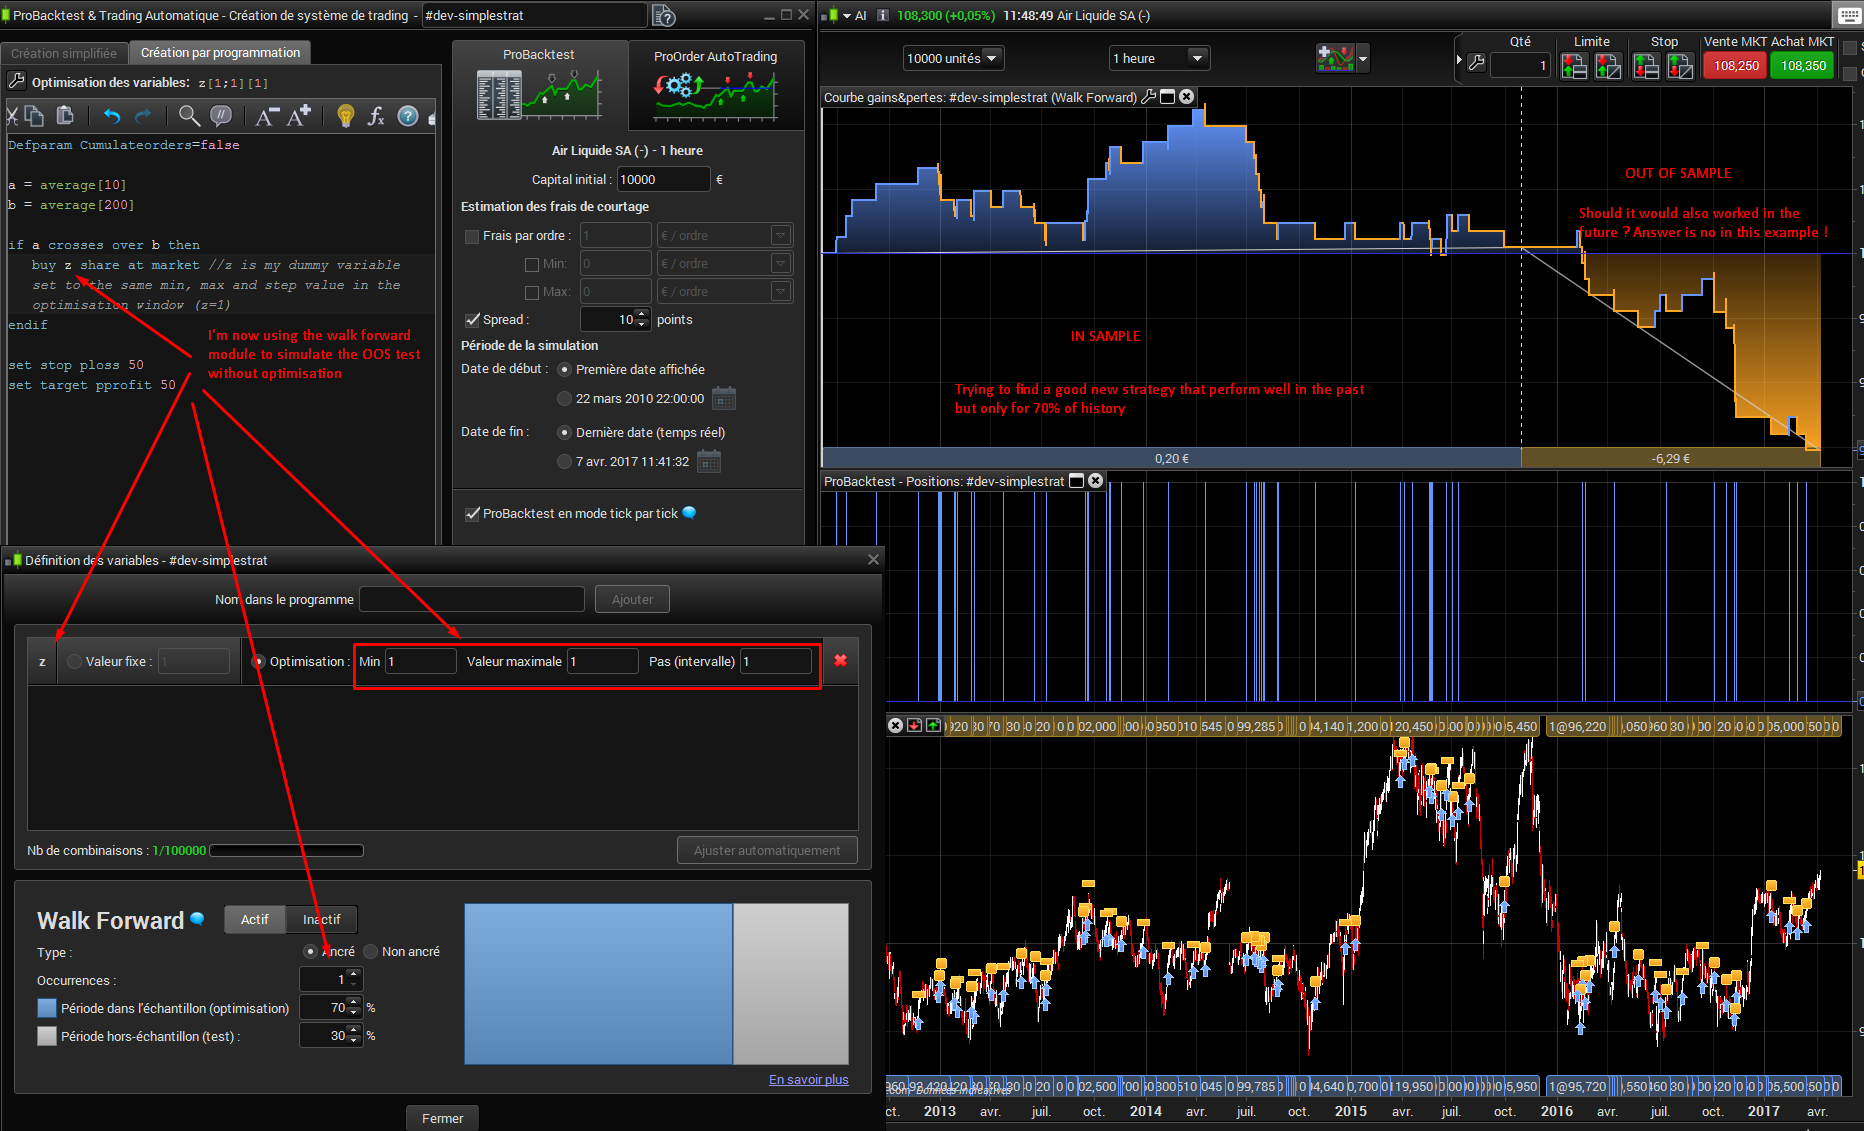
3/ use it with no optimisation at all. Instead, make an optimisation with a dummy variable that means nothing in your code to get the result of the OOS test, instead of do it manually (develop in 70% period and test in 30% period, like I said in the previous paragraph). This should replace completely the way you are using the backtester now!


To illustrate the point 3. above, I made a simple strategy with a dummy variable to get the benefit of the walk forward module that test the OOS period automatically for me. This dummy variable named “z” is not optimised at all, because  its range begin to 1 and finish to … 1 too 🙂

I hope It is now clear for everyone 🙂


glossary:

  • Walk Forward module/analysis: the tool provided in the platform in the optimisation window
  • WFE (Walk Forward Efficiency): the result criteria of each OOS period (should be >50%)
  • IS (In Sample period): The period of history when the variables have been optimised
  • OOS (Out Of Sample period): The period of history when the strategy been tested with the previous IS best optimised variables values

Share this

  1. ALE • 04/26/2017 #

    Thnak you very much Nicolas!

  2. Elsborgtrading • 04/26/2017 #

    that was nice 🙂

  3. Henrik • 04/26/2017 #

    Thanks!!

  4. barbagio • 04/26/2017 #

    Thanks Nicolas, great contribution. Only a point: I suppose the optimal value for each set of parameters is defined only looking at the strategy net profit and is not possible to define a custom “objective function”.
    In any case the WFA is a great improvement of prorealtime.

    • Nicolas • 04/26/2017 #

      That’s right, I would like to have more sorting criteria to make optimisation instead of only “net profit”. I heard this would be done in a future version of this module, but I couldn’t say how and when..

  5. Kenneth Kvistad • 04/26/2017 #

    If you optimise with 5 tests, do you simply choose the one with best result out of the 5 test is and oos? When you get resulta between 50~lets say 90% wf is this good? 
    Sometimes I see umbers way higher and this, is this the same as dont bother about them and always focus on wf numbers between 50~90%.
    Also when you have found the best optimisation of 5 is and oos do you then test the same periode with the best parameters for the hole timeframe too confirm again with tick mode ? 
    I use 5 min chart and if I optimise with 5 diffrent points/times I onl test 2 weeks or so. Does this.mean that I should save the first optimised parameters and wait 2 weeks for new information and run test again in.optimisation?

    • Nicolas • 04/26/2017 #

      Hi Kenneth, all your questions find answers in the article. Please take time to read it again 🙂 I could answer your interrogations but it would be redundant!
      But 5 OOS tests periods above 50% and not too high is very good.

  6. Kenneth Kvistad • 04/26/2017 #

    Sorry if you got offended by my question. I have read it several times. 
    But what you just answerd: should all 5 test be wf 50% too 90~/100%  or is it suffisiant if only one test is good out of 5 then use this optimalisation on the intiere timeframe? 
    My old crudeoil strategy seems to be working when i test and this makes me sceptic since it stopt working after 4 weeks last time i ran it on 10’2 version. So i feelt i did something wrong. Thats all. Thanks for the answer:)

    • Nicolas • 04/26/2017 #

      Don’t worry I’m not offend, it proves that I’m not so clear in my article 🙂 
      Walk Forward analysis is just the same way to optimise a strategy than the normal tool, but many times in the whole history to get a clear view of what would happened if you have traded it live through X Out Of Sample periods, that’s all. So you can consider that if most of the OOS performed good with a WFE>50%, your strategy benefit from optimisation and should be considered as a robust strategy to be traded in a live environment. 

  7. xors • 04/26/2017 #

    Thank you Nicolas for a great post. I’ve read it several times and starting to understand (i think). However, I have some questions I still dont quite understand on you summary ”Questions to your 3 different way to use the new Walk Forward Module”.
    1) I guess it’s still a good idea to save some of your available data (~20-30%) for I final robustness OSS test? So if you system pass several WF-iteration you could apply the values and include the last OSS period and confirm the system?
    2) Regarding the WF-results, I’m still not sure I understand the article or your response to Kenneth. I’m sorry. Assume that you have >50% efficency on all your five iterations but with different parameters.
    i) Which one should you chose? I can understand that you should use the last one if you plan to go live the day after. But assume you won’t start the day after. Or assume all iterations are good except the last one? Is it OK to pick parameters from one of the other earlier iterations?
    ii) How do you determine how often to do a reoptimization? If the results show good WF efficiencies but with different parameters?
    Regards

    • Nicolas • 04/26/2017 #

      1) don’t understand your question, sorry.
      2) i) none. The WFA is used to have a clue about the robustness of the strategy. If you plan to launch your strategy the day after the last optimisation, do another one IS+OOS (with same period division), to get the last optimised variables to use.
      ii) it is determined with the WFA itself. If you made 6 iterations over a year and you think your system is robust, then you already know that you should do a re-optimisation every 2 months (12 months / 6 = 2 months).

  8. xors • 04/26/2017 #

    Thank you for your quick resonse.
    1) Sorry, What I meant is that WF should not replace previous way of doing IS/OSS testing, right? Assume you have 1 year data. I guess it is still a good idea to do all your testing and WF optimization on ~70% of the data and when you are happy with the result and have chosen parameters you can do a last run and include the last 30% of the data. As a robustness test. Or it OK to include all data from the beginning thanks to the WF tool?
    2) i) Gotcha, different parameters is just saying that the system is robust since it works with several different parameters? So assume I did 6 iterations over the past year with good results and I plan to launch it. The next step should be to do _one_ last WF iteration with OSS = 2 months and IS 10 months to find out the last optimized variables to use?
    ii) And the reason that WFA itself has shown that during the past year, the market has changed (new parameters needed) every 2 months and therefore it can be assumed it can change every 2 months in the future?

    • Nicolas • 04/26/2017 #

      1/ it’s ok to include all the data into a big IS/OOS analysis. That’s what OOS is meant to do, test the IS optimized variables. Of course, you can play with data the way you like, there is no single way to do.
      2/ i) that’s right if you used anchored mode.
      ii) that’s a supposition, because a WFA is only a way to be sure the strategy development process in the past was not overfitted, but it will give you precious informations on how to optimized in the next months to come. But, no one will ever know what the future will be, and it is still obvious that the strategy could fail!

  9. JanWd • 04/26/2017 #

    Hi Nicolas,
    I hope I did not miss somewhere the answer, in that case I am sorry, but I have 2 questions:

    If I use the WFA with the maximum 5 non-anchored iterations, the variables mentioned on the right in the tab Walk Forward Statistics varies significantly for each iteration ;
    1) How to interpret the Walk Forward Efficiency ratio on the tab Overview, when using the 5 iterations ?
    2) And from which iteration should I take the variables for live trading ? (I thought the first, and ignore the different variables from the other iterations, or do you need to optimise till all variables of all 5 iterations are more or less in line with each other?)

    Thanks in advance for your answer.

    Jan van der Wind

    P.S. Using WFA just with one iteration with an 30% OOS is straightforward and clear to me.

    • Nicolas • 04/26/2017 #

      Yes the missed the answers 🙂
      1/ The WFE should be superior to 50 for each of the iteration to declare your strategy is robust, but there is no empirical rules..
      2/ The WFA is used to have a clue about the robustness of the strategy. If you plan to launch your strategy the day after the last optimisation, do another one IS+OOS (with same period division), to get the last optimised variables to use.

      If making a single WFA with only one iteration is clear to you, doing the same with 3, 4 or even 10 ones should be the same 🙂 WFA is just a normal way to optimize variables but test their accuracy in the past.

  10. JanWd • 04/26/2017 #

    Thanks Nicolas for the answers.
    I like your 3rd way of using a dummy variable in the code, which mean you can generate 2 or 3 or 4 or 5 out of sample results at once using the WFA analysis (as the same variables are used for each iteration, this tells a lot about the expected robustness of the model in future). Obviously AFTER first optimising the variables for a certain period.

    What I did so far is OPTIMISING with 3 or 5 iterations, that means the variables changes for each iteration, and in that case, in my opinion, the walk forward equity graph is misleading, because as far as I understand the iterations are completely independant from each other when based upon diffent variables, so in my opinion it is not fair to add the OOS results to each other in the equity graph. Also I would expect that the (totalled) Walk Forward Efficiency ratio in the Tab Overview is misleading because based on independent iterations.

    Looking forward for your thoughts.

    An example what I did to clarify my opinion:
    3 iterations non-anchored 70/30 % with 10.000 30 min bars
    (In my opinion the iterations are independent from each other due to different variables)
    1 IS: nov16 -may17 ann gain 1.200 Var1=11 and var2=36
    1OOS may17 -aug17 ann gain 1.360 WFE 114%

    2 IS: feb17 -aug17 ann gain 1.470 Var1=12 and var2=16 (so significantly different variables)
    2 OOS aug17 – nov17 ann gain 770 WFE 52%

    3 IS: may17 -nov17 ann gain 1.670 Var1=8 and var2=16 (again different variables)
    3 OOS nov17 – jan18 ann gain 220 WFE 13%

  11. Oystein.saveland • 04/26/2017 #

    Nicolas,

    Thank you for this great post!

    regarding your reply to “xors • 04/26/2017 #:”

    —————
    “2) i) none. The WFA is used to have a clue about the robustness of the strategy. If you plan to launch your strategy the day after the last optimisation, do another one IS+OOS (with same period division), to get the last optimised variables to use.”
    —————

    Let’s say I’ve performed a successful 70/30 WFD optimization, and plan to trade the next day. Assume that the IS periode was 1 year in the WFD analysis. Shouldn’t my variables be based on a one year “classic” optimization, i.e. no WFD analysis?

    • Nicolas • 04/26/2017 #

      Classic optimization: no. This is why we use the WFA, try to get variables settings that aren’t over-fitted.

  12. Amir362 • 04/26/2017 #

    Hello
    How can I manually take a backup test and push past prices and take a position with a personal strategy?
    (Is it possible to do a manual backup test?)
    Thankful

    • Nicolas • 04/26/2017 #

      Market replay tool doesn’t exist yet sorry.

  13. Jiacky • 04/26/2017 #

    Thanks for your post. You gave 3 diffierent ways of using the walk forward module, but I don’t understand the second one. What do you mean by “… give us an estimated time period for this strategy that could perform well and so when we should re-optimised it”. Thank you.

  14. monochrome • 04/26/2017 #

    Thank you nicolas. I have finally understood the walk forward tool.

  15. SB-FO • 04/26/2017 #

    Nicolas,

    I have built a 4H strategy and optimized it over 10 years, shorter time frames yield better results. If I used the indicator setting as fixed, then it will not walk forward. If I use variable setting but fixed between the actually setting, it will do a walk forward and most all result are very positive. If I use default optimization settings, it never finds my actual setting and thus produces worse results. I would have thought the WF could use fixed setting and then adjust from there.

    Please advise if I ma doing it correctly.

    Stuart

    • Nicolas • 04/26/2017 #

      A walk forward is an optimization on a period (IS) that select the best settings (according to your criteria) and then it tests that settings on the OOS, that produces a WFE to let you know how it behaves.
      If you make an optimization on not the same period, you will obviously not find the same settings.

  16. SB-FO • 04/26/2017 #

    Nicolas, I think I understand that. If I have optimized a strategy over 10 years, the WF test is testing time frames within those ten years.

    Again, when I run WF on the strategy, it does not find the optimized setting that many optimizations has produced great setting. When I run the optimized found settings, the WF in different time frames are all positive, sometimes well beyond 50%. Those time frames above 50% might just be the those years results or something to be concerned about, that is something I need to go research for a conclusion.

    As always, thank you for your help.

    Stuart

  17. egyptiantrader • 04/26/2017 #

    Thanks for writing this. After a day experimenting and a couple of reads I think I understand walk forward now.

avatar
Register or

Top