

Wave Trend Oscillator
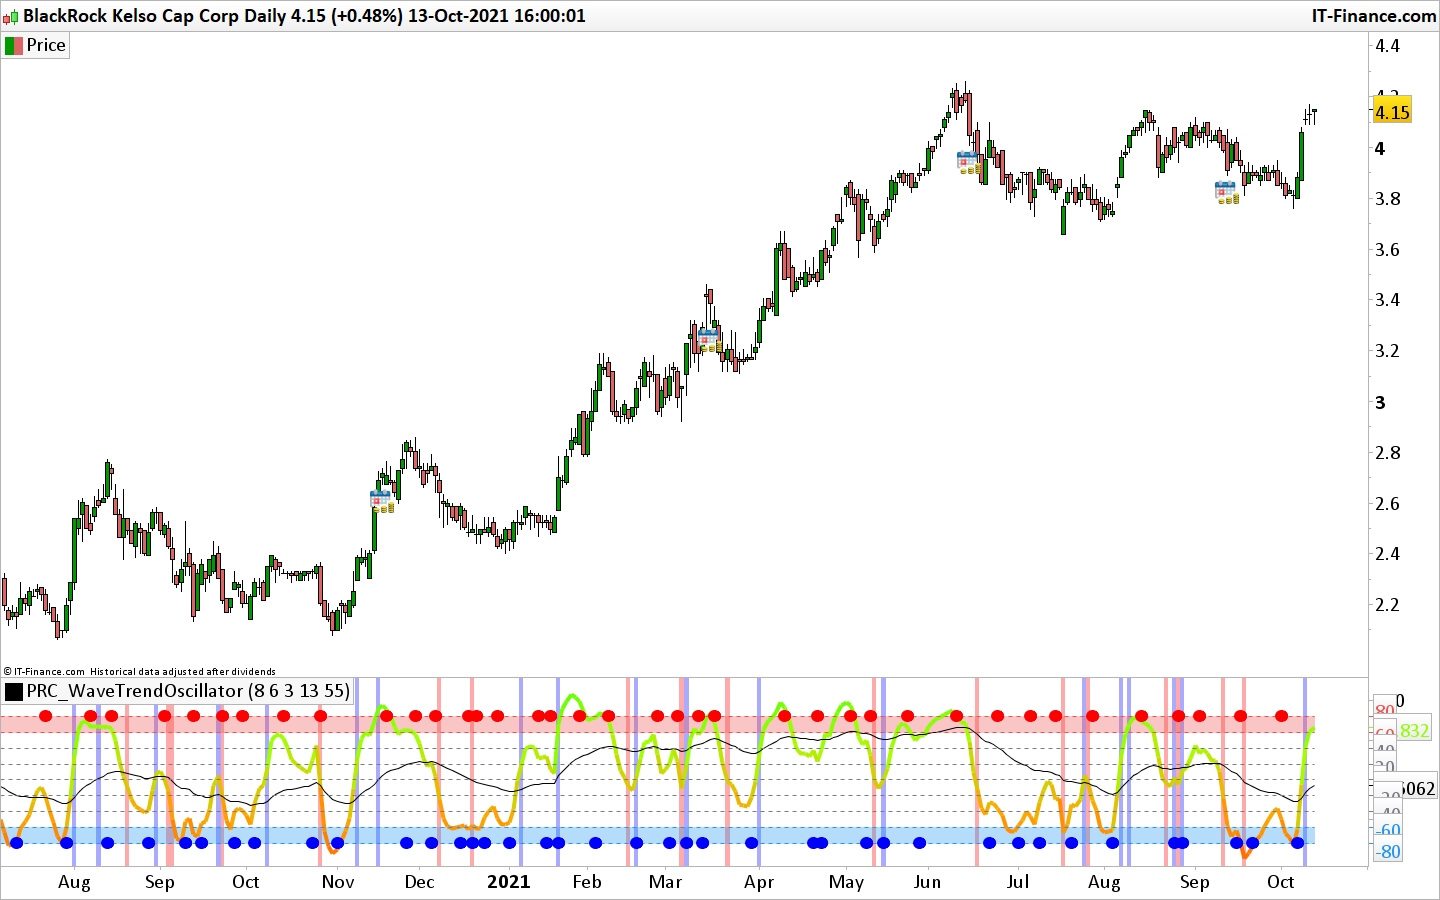
The Wave Trend Oscillator is an indicator which combine 2 oscillators: the longer plot gives you a longer timeframe momentum bias, and the shorter plot gives you entries and/or exits.
With the traditional Wavetrend Oscillator there is a simple moving average on the WTO that is to help provide entries and exits. In this version the crossing of the 2 MA are visible with the blue and red dots available at the top and bottom of the oscillator. This MA period is set with the wt1malen setting.
When one of the 2 oscillators crosses the zero line level, there is a background color change according of the direction (blue = up cross while red background color is for down cross).
The use of this indicator is similar to many other oscillators. Buying oversold and selling overbought, but being mindful of the momentum of the market. If the longer WTO is above the center line it’s best to be looking for dips to the center line, or for an overbought signal by the faster WTO, and vice versa if the longer WTO is below the center line. That said, you can also adjust the length of the SMA on the faster WTO to fine tune entries or exits. In this case you have that additional confirmation of market momentum.
(description modified from the original author: @ClassicScott)
//PRC_WaveTrendOscillator | indicator
//14.10.2021
//Nicolas @ www.prorealcode.com
//Sharing ProRealTime knowledge
//converted from pinescript

// --- settings
channellen = 8 //Channel Length
averagelen = 6 //Average Length
wt1malen = 3 //Moving Average Length
channellen2 = 13 //Channel Length
averagelen2 = 55 //Average Length
// --- end of settings

src = medianprice
esa = average[channellen,1](src)
d = average[channellen,1](abs(src - esa))
ci = (src - esa) / (0.015 * d)
tci = average[averagelen,1](ci)
wt1 = tci
wt1ma = average[wt1malen](wt1)

R = 10+(200-wt1)
G = 10+(200+wt1)

esa2 = average[channellen2,1](src)
d2 = average[channellen2,1](abs(src - esa2))
ci2 = (src - esa2) / (0.015 * d2)
tci2 = average[averagelen2,1](ci2)
wt2 = tci2

////MOMENTUM CHANGE & BACKGROUND COLORS

//PRIMARY WTO & SECONDARY WTO
momchangelong1 = wt1 crosses over 0
momchangeshort1 = wt1 crosses under 0

momchangelong2 = wt2 crosses over 0
momchangeshort2 = wt2 crosses under 0

if momchangelong1 then
backgroundcolor(0,0,255,85)
elsif momchangeshort1 then
backgroundcolor(255,0,0,85)
endif
if momchangelong2 then
backgroundcolor(0,0,255,85)
elsif momchangeshort2 then
backgroundcolor(255,0,0,85)
endif

//MOVING AVERAGE CROSS SIGNALS ON PRIMARY WAVETREND
if wt1 crosses over wt1ma then
drawtext("●",barindex,-80,dialog,bold,16) coloured(0,0,255)
elsif wt1 crosses under wt1ma then
drawtext("●",barindex,80,dialog,bold,16) coloured(255,0,0)
endif

if islastbarupdate then
drawrectangle(0,60,barindex,80) coloured(239, 83, 80,85) bordercolor(0,0,0,0)
drawrectangle(0,-60,barindex,-80) coloured(33, 150, 243,85) bordercolor(0,0,0,0)
endif

return wt1 coloured(r,g,0) style(line,4) as "Primary Wavetrend", wt2 as "Secondary Wavetrend", 0 coloured(120, 123, 134) style(dottedline) as "median", 40 coloured(120, 123, 134) style(dottedline) as "40",  20 coloured(120, 123, 134) style(dottedline) as "20", -40 coloured(120, 123, 134) style(dottedline) as "-40",  -20 coloured(120, 123, 134) style(dottedline) as "-20", 80 coloured(239, 83, 80) style(dottedline) as "80", 60 coloured(239, 83, 80) style(dottedline) as "60",-80 coloured(33, 150, 243) style(dottedline) as "-80", -60 coloured(33, 150, 243) style(dottedline) as "-60"
