

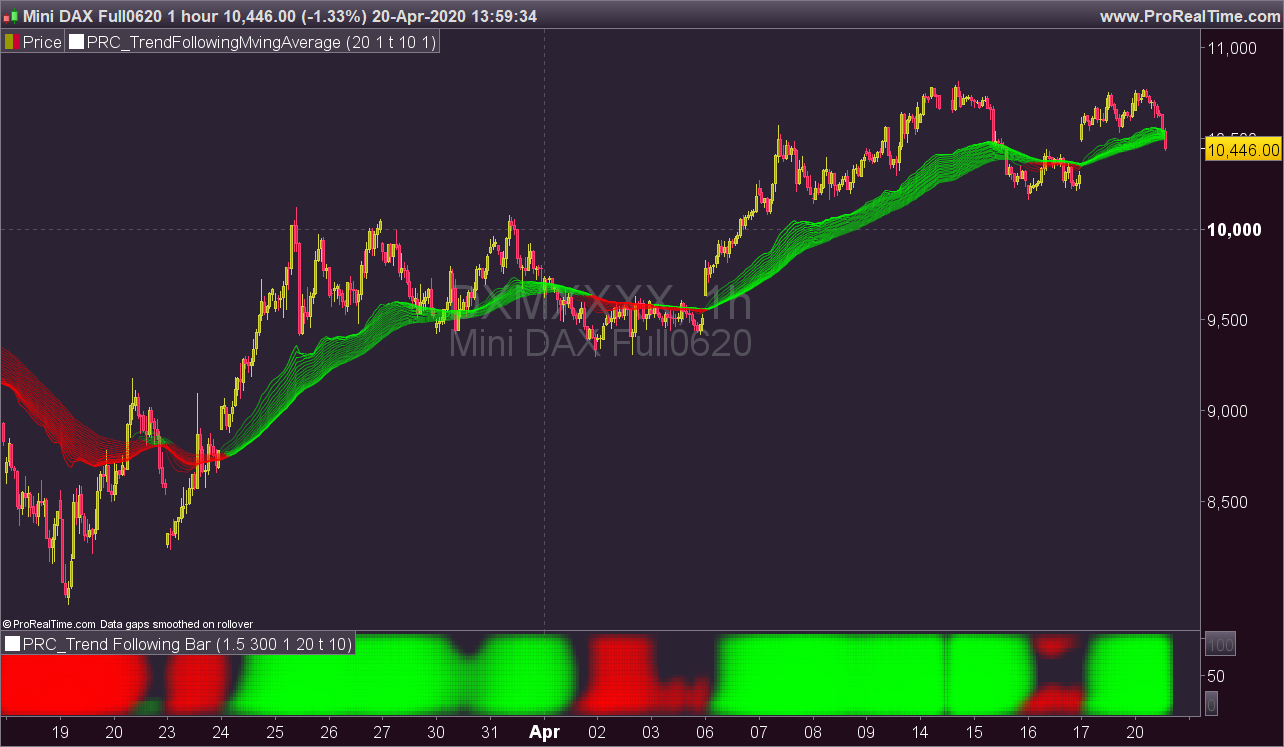
Trend Following Bars (heatmap)
While analysing a chart, one of the biggest problem is to see if there is trend or not. While thinking about it, I found the idea to analyse moving averages in channel and their momentum according to channel width.
How it Works?
On each bar it creates a channel by highest/lowest point of a MA. highest point is upper line and lowest point is lower line of the MA channel,
It gets highest and lowest point of last 300 bars, (say Price Channel )
If the width of MA channel is greater than certain rate of price channel then it decides there is trend
After it decided there is trend, it calculates the rate between channel and MA. Bigger result means stronger trend.
According to rate of MA channel and the price channel , bar color becomes lighter/darker. so when you look at the bar color you can see the trend strength.
(description from the original author LonesomeTheBlue, all credits go to him). Indicator converted from pinescript with some adaptation to make it works with ProRealTime.
Similar indicator as the other published here: Trend Following Moving Averages(but with heatmap below the chart this time).
//PRC_Trend Following Bar | indicator
//20.04.2020
//Nicolas @ www.prorealcode.com
//Sharing ProRealTime knowledge

// --- settings
rateinp = 1 //Trend Channel Rate %  minval = 0.1, step = 0.1
periodTC = 300 //Trend Channel Period
matype = 1 //ma type 0=sma, 1-ema, etc.
prd = 20 //Period to Check Trend
ulinreg = 1 // 1=true, Use Linear Regression
linprd = 10 //Linear Regression Period, minval = 2
// --- end of settings

rate = rateinp / 100
pricerange = highest[periodTC](close) - lowest[periodTC](close)
chan = pricerange * rate

p = 5
while p<100 do
 //trend
 masrc = average[p,matype](close)
 if ulinreg then
  ma = LinearRegression[linprd](masrc)
 else
  ma = masrc
 endif

 hh = highest[prd](ma)
 ll = lowest[prd](ma)
 diff = abs(hh-ll)

 if diff>chan then
  if ma>ll+chan then
   trend=1
  elsif ma<hh-chan then
   trend=-1
  else
   trend=0
  endif
 else
  trend=0
 endif

 ret = trend*diff/chan

 alpha = min(255,(0+abs(ret*10)))
 if ret<0 then
  r=255
  g=0
 else
  r=0
  g=255
 endif

 drawtext("■",barindex,p,dialog,bold,20) coloured(r,g,0,alpha)

 p=p+5
wend

return 0 coloured(100,100,100,0), 100 coloured(100,100,100,0)
