My first code and strategy
Forums › ProRealTime English forum › ProOrder support › My first code and strategy
- This topic has 18 replies, 2 voices, and was last updated 8 years ago by
 Elsborgtrading.
-
-
07/21/2016 at 10:28 AM #10751
Hi guys 🙂
I’d like to share my first code with you, and perhaps get your point of view on my ideas. I also like to discuss the problems that I encountered. Both coding problems and back testing problems- and perhaps strategy problems- feel free to comment 🙂
First the idea is based on Ichimoku without the tenkansen/kinjunsen cross- which in my testing it wasn’t successful. Initially I started back testing it on a DAX 4hour chart. The back testing was insane and too good to be true. And then it usually is (approx. 132.000.000 % gain over 4 years) so the idea is that the code needs to generate approximate 50/50 lose-win, and more than a 2.5 gain/loose ration. I think that is more realistic in many ways. however the lates ver. of the code does not apply to this, and is still to good to be true when back testing it. so something must be wrong.
The strategy I’d like to make is Ichimoku based, and these are the condition for a trade:
Long trades: Tenkensan, Kinjusan and Chikou need to be above the cloud, and I need 3 bullish candles in an up-trend and opening on a 3rd that is above the median price of prior candle, and also above the cloud before making a long trade. Trade should be placed on the opening of the 3rd candle if it meets the condition
Short trade: same as Long, but of cause inverted: Tenkensan, Kinjusan and Chikou needs to be below the cloud and I need 3 bearish candles in a downtrend and opening on a 3rd that is below the median price of prior candle, and also below the cloud before making a short trade. Trade should be placed on the opening of the 3rd candle if it meets the condition
I also tried to implement a strategy for low, medium and high volatile periods- playing with different stop/loss scenarios – the idea is still in the making but derived from the problems that maybe are with back testing (?) And also I wanted to scalp the price action in low volatile sideways trend. I don’t think it would work with the same SL/TP strategy as when you are in a strong up/down trend.
So my questions are:
Back testing:
To get the basics strait I think the problem with back testing is PRT only test on the whole candle- not the pips size action with the candle timeframe so in theory low SL is never stopped out and produce very good result, but in real trade they are meet almost every time. I don’t know if I’m right but it seems like it, as the 4H DAX test never stopped out with as small as an 8 point SL. Perhaps someone knows more about this?
Coding problems:
It’s my first code, so please bear that in mind as it’s properly not “beautiful” code, and I’m certain that someone could produce a more correct code (feel free :-)) anyway- the overall strategy works- trades are made above and below the cloud when the tenkansen/kijunsen and Chikou are above/below but the 2-3 candle test I don’t see is working as intended- and I can’t see why?
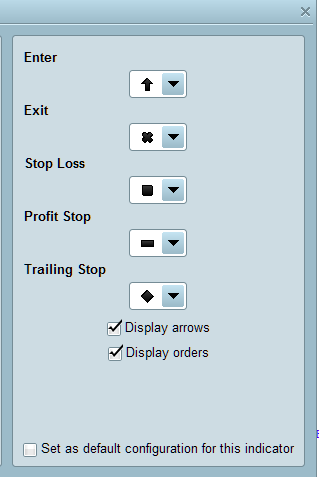
When back testing I can see an entry in the chart as an arrow, but not a cross when exiting, I see a square? When looking at some of all the strategy code here I see a cross when exiting?. Also sometimes the Positions window shows no bars, but it seems like the trade was made, both as an entry and an action on the equity curve. I will show a screen dump at this.
Anyway I know this was a long post and many questions, but I hope you can see the time to answer some of it 🙂
Cheers and happy summer days
Kasper Elsborg
123456789101112131415161718192021222324252627282930313233343536373839404142434445464748495051525354555657585960616263646566676869707172737475767778798081828384858687888990919293949596979899100101102103//-------------------------------------------------------------------------// Main code : Elsborgtrading 5magics DAX5min//-------------------------------------------------------------------------REM Elsborgtrading Ichimokudefparam cumulateorders=falsedefparam preloadbars=200defparam preloadbars=2000defparam flatbefore=090000defparam flatafter=220000//ONCE Crosslow=0//ONCE Crosshigh=0ONCE Tenkansen=0ONCE Kijunsen=0ONCE SenkouSpanA=0ONCE SenkouSpanB=0ONCE TreBarsAbove=0ONCE TreBarsBelow=0ONCE TenkansenBelow=0ONCE KijunsenBelow=0ONCE ChikouBelow=0//REM Money ManagementCapital = 1000Risk = 0.01StopLoss = 10 // Could be our variable X// Calculate contractsequity = Capital + StrategyProfitmaxrisk = round(equity*Risk)PositionSize = abs(round((maxrisk/StopLoss)/PointValue)*pipsize)//If PositionSize>100 then//PositionSize=100//endifTenkansen = (highest[9](high)+lowest[9](low))/2Kijunsen = (highest[26](high)+lowest[26](low))/2SenkouSpanA = (Tenkansen[26]+Kijunsen[26])/2SenkouSpanB = (highest[52](high[26])+lowest[52](low[26]))/2Chikou = close[26]// buy//TreBarsAbove = close[3] > SenkouSpanA and close[3] > SenkouSpanB and close[2] > SenkouSpanA and close[2] > SenkouSpanB and close > SenkouSpanA and close > SenkouSpanB and close[3]<Close[2] and Close[2]<Close //REM does not test for 3 bullish candle//TreBarsAbove = close[3] > SenkouSpanA and close[3] > SenkouSpanB and close[2] > SenkouSpanA and close[2] > SenkouSpanB and close > SenkouSpanA and close > SenkouSpanB and close[3]<Close[2] and Close[2]<Close and open[3]<close[3] and open[2]<close[2] and open<close //REM test for 3 bullish candle//TreBarsAbove = close[2] > SenkouSpanA and close[2] > SenkouSpanB and close > SenkouSpanA and close > SenkouSpanB and Close[2]<Close and open[2]<close[2] and open<close // REM test for only 2 bullish candles aboveTreBarsAbove = close[3] > SenkouSpanA and close[3] > SenkouSpanB and close[2] > SenkouSpanA and close[2] > SenkouSpanB and open[1] > SenkouSpanA and open[1] > SenkouSpanB and close[3]<Close[2] and medianprice[2]<open[1] and open[3]<close[3] and open[2]<close[2] and open[1]>medianprice[2] // REM test med open candle3//Crosshigh = Tenkansen crosses over Kijunsen: NOT USEDTenkansenAbove = Tenkansen > SenkouSpanA and Tenkansen > SenkouSpanBKijusenAbove = Kijunsen > SenkouSpanA and Kijunsen > SenkouSpanBChikouAbove = Chikou > SenkouSpanA[26] and Chikou > SenkouSpanB[26]IF TreBarsAbove and TenkansenAbove and KijusenAbove and ChikouAbove THENBUY PositionSize CONTRACTS AT MARKETENDIF// Sell//TreBarsBelow = close[3] < SenkouSpanA and close[3] < SenkouSpanB and close[2] < SenkouSpanA and close[2] < SenkouSpanB and close < SenkouSpanA and close < SenkouSpanB and close[3]>Close[2] and Close[2]>Close //REM does not test for 3 bearish candle//TreBarsBelow = close[3] < SenkouSpanA and close[3] < SenkouSpanB and close[2] < SenkouSpanA and close[2] < SenkouSpanB and close[1] < SenkouSpanA and close[1] < SenkouSpanB and close[3]>Close[2] and Close[2]>Close[1] and open[3]>close[3] and open[2]>close[2] and open[1]>close[1] // REM test for 3 berish candle//TreBarsBelow = close[2] < SenkouSpanA and close[2] < SenkouSpanB and close < SenkouSpanA and close < SenkouSpanB and Close[2]>Close and open[2]>close[2] and open>close // REM test for only 2 berish candles belowTreBarsBelow = close[3] < SenkouSpanA and close[3] < SenkouSpanB and close[2] < SenkouSpanA and close[2] < SenkouSpanB and open[1] < SenkouSpanA and open[1] < SenkouSpanB and close[3]>Close[2] and medianprice[2]>open[1] and open[3]>close[3] and open[2]>close[2] and open[1]<medianprice[2] // REM test med open candle3//Crosslow = Tenkansen crosses under Kijunsen: NOT USEDTenkansenBelow = Tenkansen < SenkouSpanA and Tenkansen < SenkouSpanBKijunsenBelow = Kijunsen < SenkouSpanA and Kijunsen < SenkouSpanBChikouBelow = Chikou < SenkouSpanA[26] and Chikou < SenkouSpanB[26]IF TreBarsBelow and TenkansenBelow and KijunsenBelow and ChikouBelow THENSELLSHORT PositionSize CONTRACTS AT MARKETENDIF// stop and profit//Sl=ABS(highest[3](high)-lowest[3](Low))/2candlesperiods=15NoMumentum1 = 30NoMumentum2 = 40If ABS(highest[candlesperiods](high)-lowest[candlesperiods](low))< NoMumentum1 THENTP=2SL=15ELSIF ABS(highest[candlesperiods](high)-lowest[candlesperiods](low))< NoMumentum2 THENTP=4SL=3elseTP=5SL=2Endifset stop ploss SLset target pprofit TP//Debugging//GRAPH SenkouSpanB COLOURED(0,0,255) AS "Take Profit" //Blue//GRAPH SenkouSpanA COLOURED(255,0,0) AS "Stop Loss" //Red//GRAPH Chikou COLOURED(0,0,0) AS "chikou" //BlackGRAPH TP COLOURED(0,255,255) AS "TP" //AquaGRAPH SL COLOURED(0,255,0) AS "SL" //Lime07/22/2016 at 3:53 PM #10798Hi Elsborg,
Read through your note, afraid I’m only a beginner, but in my limited experience the tester produces better profits with small stop losses. This is totally at odds with real trading and I agree with your interpretation. This looks a brilliant effort for a “newbie” I hope someone else can supply you with the expertise you require but sadly isn’t me.
Regards
Dymjohn
07/23/2016 at 8:33 AM #10811Hi Dymjohn, and thanks for taking your time to read my post and comment:-)
Yes I am a newbie, so something that seems like a problem could be straight ahead for some one else. I also thing it’s summer vacation time and people has someting better to do that sit here and read forums.
I did some more investigation, actually made some small indicators as well for debugging purpose, and it works quite well. I also fixed the 3 bars issue- so that was one down 🙂 here is the code and screendump of the backtesting.
123456789101112131415161718192021222324252627282930313233343536373839404142434445464748495051525354555657585960616263646566676869707172737475767778798081828384858687888990919293949596979899100101102//-------------------------------------------------------------------------// Main code : 5magic3 newtest4//-------------------------------------------------------------------------defparam cumulateorders=falsedefparam preloadbars=2000defparam flatbefore=090000defparam flatafter=220000//ONCE Crosslow=0//ONCE Crosshigh=0ONCE Tenkansen=0ONCE Kijunsen=0ONCE SenkouSpanA=0ONCE SenkouSpanB=0//ONCE TreBarsAbove=0//ONCE TreBarsBelow=0ONCE TenkansenBelow=0ONCE KijunsenBelow=0ONCE ChikouBelow=0ONCE Bullish0=0ONCE Bullish1=0//ONCE Bullish2=0ONCE Bearish0= 0ONCE Bearish1= 0//ONCE Bearish2= 0NoMomentum1=35candlesperiods=15//REM Money ManagementCapital = 1000Risk = 0.01StopLoss = 10 // Could be our variable X// Calculate contractsequity = Capital + StrategyProfitmaxrisk = round(equity*Risk)PositionSize = abs(round((maxrisk/StopLoss)/PointValue)*pipsize)//If PositionSize>100 then//PositionSize=100//endif//REM ICHIMOKUTenkansen = (highest[9](high)+lowest[9](low))/2Kijunsen = (highest[26](high)+lowest[26](low))/2SenkouSpanA = (Tenkansen[26]+Kijunsen[26])/2SenkouSpanB = (highest[52](high[26])+lowest[52](low[26]))/2Chikou = close[26]// REM BUYBullish0 = close > SenkouSpanA and close > SenkouSpanB and open < closeBullish1 = close [1]> SenkouSpanA and close[1] > SenkouSpanB and open[1] < close[1]//Bullish2 = close[2] > SenkouSpanA and close[2] > SenkouSpanB and open[2] < close[2]TenkansenAbove = Tenkansen > SenkouSpanA and Tenkansen > SenkouSpanBKijusenAbove = Kijunsen > SenkouSpanA and Kijunsen > SenkouSpanBChikouAbove = Chikou > SenkouSpanA[26] and Chikou > SenkouSpanB[26]If ABS(highest[candlesperiods](high)-lowest[candlesperiods](low))< NoMomentum1 THENcondition=0Elsecondition=1endifIF condition and Bullish0 and Bullish1 and TenkansenAbove and KijusenAbove and ChikouAbove THENBUY PositionSize CONTRACTS AT MARKETENDIF// REM SELLBearish0= close < SenkouSpanA and close < SenkouSpanB and close > openBearish1=close[1] < SenkouSpanA and close[1] < SenkouSpanB and close[1] > open[1]//Bearish2= close[2] < SenkouSpanA and close[2] < SenkouSpanB and close[2] > open[2]TenkansenBelow = Tenkansen < SenkouSpanA and Tenkansen < SenkouSpanBKijunsenBelow = Kijunsen < SenkouSpanA and Kijunsen < SenkouSpanBChikouBelow = Chikou < SenkouSpanA[26] and Chikou < SenkouSpanB[26]IF condition and TenkansenBelow and KijunsenBelow and ChikouBelow and Bearish0 and Bearish1 THENSELLSHORT PositionSize CONTRACTS AT MARKETENDIF// REM stop and profit//Sl=ABS(highest[3](high)-lowest[3](Low))/2candlesperiods=15TP=8SL=6set stop ploss SLset target pprofit TP//Debugging//GRAPH SenkouSpanB COLOURED(0,0,255) AS "Take Profit" //Blue//GRAPH SenkouSpanA COLOURED(255,0,0) AS "Stop Loss" //Red//GRAPH Chikou COLOURED(0,0,0) AS "chikou" //Black//GRAPH TP COLOURED(0,255,255) AS "TP" //Aqua//GRAPH SL COLOURED(0,255,0) AS "SL" //Lime//GRAPH TreBarsAbove COLOURED(0,255,255) AS "TreBarsAbove" //Aqua//GRAPH TreBarsBelow COLOURED(255,0,0) AS "TreBarsBelow" //red//GRAPH condition COLOURED(255,0,0) AS "condition" //red07/23/2016 at 8:35 AM #10814I also changed the strategy a bit to not include low volatile periods. I think it is simply to risky as IG require minimum a 6 point SL
07/23/2016 at 8:46 AM #10817I sit here and also looking at the chart- I think there could defeatedly be some improvement for the strategy as well. My initially thoughts is to exit the marked when tenkansen line croses price from below on Long and from above on Short. Think I will work on that 🙂
07/23/2016 at 8:48 AM #10820strange, the attachment keeps reattach it self, when nothing is selected in the window?
07/23/2016 at 9:05 AM #10821Also there is still something with the bar test on short marked.
I thinkt it need to be change to
Bearish0= close < SenkouSpanA and close < SenkouSpanB and close < open
Bearish1=close[1] < SenkouSpanA and close[1] < SenkouSpanB and close[1] < open[1]anyway enough for today, I will return when I have something more solid 🙂
Cheers
Kasper
07/24/2016 at 1:53 PM #10841Hi Again, in my quest for gold I found one answer myself:-D. It’s the one where I ask for the Icons in the trading window. well here it is- self explainable
 07/24/2016 at 3:32 PM #1084807/25/2016 at 5:33 PM #10870
Hi Kasper
Have tried in live mode and produces only losses because of unrealistic stops with much of the action on the entry bar. I tried using a more realistic stop on the DAX but in test this just takes any profit away. In the end I used your strategy with MFE (max favourable excursion) stop detailed in this web site as well as making entry 2 points above or below the signal bar. This produces only a very modest profit on test and with normal slippage is no better than break even. I must say, everything I’ve tested so far is unprofitable suggests ichimoku does not provide an edge like most other indicators and oscillators.
Regards
John
07/25/2016 at 6:28 PM #10871Hi John, I guess you are right. The backtest issue with SL has a significant drawback in live- I haven’t been able to produce something useful with this code other than experience. So it’s not entirely waisted, we just need a good strategy 🙂
So yet again thanks for your help John, much appreciated
Cheers
Kasper
07/27/2016 at 8:04 AM #10907Hi John, I ventured deeper in the DAX and the code/strategy I wrote. Not that it is entirely perfect ,but at least it shows profit. However I notes some very interesting things on the Market. I will try and explain them here.
First I feel comfortable that I somehow are not cheated by the backtesting issue as I almost don’t have 0 bars profit.
What I found was:
A SL=109 on a hourly basis is almost never meet.
DAX market changed after Aug 2015
I think this is an important information, as it seems like after Aug 2015 the trading hours for a profit is 07:00-12:00 and before it was 07:00-23:00.
Anyway I’d like to show that the code was actually able to make money. There are 2 ver. 9.0 and 9.5 they are both with a risk of 0.03 so it’s a bit high.
my notes to the ver. 9.0 is:
- All sell/buy kontrakts seems to be working now. I have added an exit strategy with Kijunsen crosses Tenkansen.
- The strategy has changed to use only 2 Bullish/Bearish candles as testconditions. 1 or 3 will strangely not work.
- Working hours has changed to 7:00-23:00
- KijunsenBelow now is spelled correct
- I have changed the time frame to DAX 1 Hour,
- and
- SL =109. 109 is tested to be the most profitable.
- By setting SL well above I am comfortable in the problem with low SL and backtesting. Also this seems to be my real trading problem, by running small SL that will in high volatile marketd be stopped out before you know it.
- And something with the
//Volitale testIf ABS(highest[candlesperiods](high)-lowest[candlesperiods](low))< NoMomentum1 THEN
condition=0
Else
condition=1
endif
my notes to the ver. 9.5 is:
- If it not in the code will not generate Any Money??? That’s is very strange and just a coincident derived from an idea
- Also Risk has encreased but limmited to 100 contract
***** new in 9.5
Accumolate orders =TRUE and also extra accomulation are made in trends
when Equity=600000 then quit
It looks like that most profit this year is within this timeframe.
But I still don’t like that within the last year it does not make any money overall- so I change the timeframe that for 2016 is profitable
defparam flatbefore=070000
defparam flatafter=120000
(But of cause the NoTradingAfter=17 will never be an issue)
*************
I also tried to play with traling stops, but with no luck or profit!!
123456789101112131415161718192021222324252627282930313233343536373839404142434445464748495051525354555657585960616263646566676869707172737475767778798081828384858687888990919293949596979899100101102103104105106107108109110111112113114115116//-------------------------------------------------------------------------// Main code : 5magic3 newtest9.0//-------------------------------------------------------------------------defparam cumulateorders=falsedefparam preloadbars=2000defparam flatbefore=070000defparam flatafter=230000ONCE Tenkansen=0ONCE Kijunsen=0ONCE SenkouSpanA=0ONCE SenkouSpanB=0ONCE TenkansenBelow=0ONCE KijunsenBelow=0ONCE ChikouBelow=0ONCE Bullish0=0ONCE Bullish1=0ONCE Bearish0= 0ONCE Bearish1= 0NoMomentum1=75candlesperiods=2//REM Money ManagementCapital = 1000Risk = 0.03StopLoss = 10 // Could be our variable X// Calculate contractsequity = Capital + StrategyProfitmaxrisk = round(equity*Risk)PositionSize = abs(round((maxrisk/StopLoss)/PointValue)*pipsize)If PositionSize>100 thenPositionSize=100endif//REM ICHIMOKU DEFINITITenkansen = (highest[9](high)+lowest[9](low))/2Kijunsen = (highest[26](high)+lowest[26](low))/2SenkouSpanA = (Tenkansen[26]+Kijunsen[26])/2SenkouSpanB = (highest[52](high[26])+lowest[52](low[26]))/2Chikou = close[26]//**************************************//************** REM LONG***************//**************************************// BULLISH/BEARISH CANDLE TEST AND CONDITIONBullish0 = close > SenkouSpanA and close > SenkouSpanB and open < closeBullish1 = close [1]> SenkouSpanA and close[1] > SenkouSpanB and open[1] < close[1]Bearish0 = close < SenkouSpanA and close < SenkouSpanB and open > closeBearish1 = close[1] < SenkouSpanA and close[1] < SenkouSpanB and open[1] > close[1]//ICHIMOKU TEST AND LONG CONDITIONTenkansenAbove = Tenkansen > SenkouSpanA and Tenkansen > SenkouSpanBKijunsenAbove = Kijunsen > SenkouSpanA and Kijunsen > SenkouSpanBChikouAbove = Chikou > SenkouSpanA[26] and Chikou > SenkouSpanB[26]//VOLITALE TEST AND CONDITIONIf ABS(highest[candlesperiods](high)-lowest[candlesperiods](low))< NoMomentum1 THENcondition=0Elsecondition=1endif//ENTER/EXIT LONG MARKET TESTIF condition and Bullish0 and Bullish1 and TenkansenAbove and KijunsenAbove and ChikouAbove THENBUY PositionSize CONTRACTS AT MARKETif low crosses under kijunsen thensell AT MARKETendifENDIF//**************************************//************** REM SHORT**************//**************************************//ICHIMOKU TEST AND SHORT CONDITIONTenkansenBelow = Tenkansen < SenkouSpanA and Tenkansen < SenkouSpanBKijunsenBelow = Kijunsen < SenkouSpanA and Kijunsen < SenkouSpanBChikouBelow = Chikou < SenkouSpanA[26] and Chikou < SenkouSpanB[26]//ENTER/EXIT SHORT MARKET TESTIF condition and Bearish0 and Bearish1 and TenkansenBelow and KijunsenBelow and ChikouBelow THENSELLSHORT PositionSize CONTRACTS AT MARKETif high crosses over kijunsen thenEXITSHORT AT MARKETendifENDIF// REM stop and profitSL=109set stop ploss SL//Debugging//GRAPH SenkouSpanB COLOURED(0,0,255) AS "Take Profit" //Blue//GRAPH SenkouSpanA COLOURED(255,0,0) AS "Stop Loss" //Red//GRAPH Chikou COLOURED(0,0,0) AS "chikou" //Black//GRAPH TP COLOURED(0,255,255) AS "TP" //Aqua//GRAPH SL COLOURED(0,255,0) AS "SL" //Lime//GRAPH xxx COLOURED(0,255,255) AS "TreBarsAbove" //Aqua//GRAPH xxx COLOURED(255,0,0) AS "TreBarsBelow" //red//GRAPH condition COLOURED(255,0,0) AS "condition" //red****************
//————————————————————————-
// Main code : 5magic3 newtest9.5
//————————————————————————-
defparam cumulateorders=TRUE
defparam preloadbars=2000
defparam flatbefore=070000
defparam flatafter=120000
ONCE Tenkansen=0
ONCE Kijunsen=0
ONCE SenkouSpanA=0
ONCE SenkouSpanB=0
ONCE TenkansenBelow=0
ONCE KijunsenBelow=0
ONCE ChikouBelow=0
ONCE Bullish0=0
ONCE Bullish1=0
ONCE Bearish0= 0
ONCE Bearish1= 0
//Trading Variables
NoMomentum1=75
candlesperiods=2
NoTradingAfter=17
//REM Money Management
Capital = 1000
Risk = 0.03
StopLoss = 10 // Could be our variable X
// Calculate contracts
equity = Capital + StrategyProfit
maxrisk = round(equity*Risk)
PositionSize = abs(round((maxrisk/StopLoss)/PointValue)*pipsize)
If PositionSize>100 then
PositionSize=100
endif
//REM ICHIMOKU DEFINITION
Tenkansen = (highest[9](high)+lowest[9](low))/2
Kijunsen = (highest[26](high)+lowest[26](low))/2
SenkouSpanA = (Tenkansen[26]+Kijunsen[26])/2
SenkouSpanB = (highest[52](high[26])+lowest[52](low[26]))/2
Chikou = close[26]
//**************************************
//************** REM LONG***************
//**************************************
// BULLISH/BEARISH CANDLE TEST AND CONDITION
Bullish0 = close > SenkouSpanA and close > SenkouSpanB and open < close
Bullish1 = close [1]> SenkouSpanA and close[1] > SenkouSpanB and open[1] < close[1]
Bearish0 = close < SenkouSpanA and close < SenkouSpanB and open > close
Bearish1 = close[1] < SenkouSpanA and close[1] < SenkouSpanB and open[1] > close[1]
//ICHIMOKU TEST AND LONG CONDITION
TenkansenAbove = Tenkansen > SenkouSpanA and Tenkansen > SenkouSpanB
KijunsenAbove = Kijunsen > SenkouSpanA and Kijunsen > SenkouSpanB
ChikouAbove = Chikou > SenkouSpanA[26] and Chikou > SenkouSpanB[26]
//VOLITALE TEST AND CONDITION
If ABS(highest[candlesperiods](high)-lowest[candlesperiods](low))< NoMomentum1 THEN
condition=0
Else
condition=1
endif
//ENTER/EXIT LONG MARKET TEST
IF condition and Bullish0 and Bullish1 and TenkansenAbove and KijunsenAbove and ChikouAbove THEN
//IF condition and Bullish0 and Bullish1 and TenkansenAbove and KijunsenAbove THEN
BUY PositionSize CONTRACTS AT MARKET
if low crosses under kijunsen then
sell AT MARKET
ENDIF
ENDIF
//Adding extra position if in good trend
IF CurrentHour < NoTradingAfter and BARINDEX-TRADEINDEX(1)>1 AND Close-TRADEPRICE(1)>10 AND LongOnMarket then// AND condition and Bullish0 and Bullish1 and TenkansenAbove and KijunsenAbove then// and ChikouAbove THEN
Buy PositionSize CONTRACTS AT MARKET
if low crosses under kijunsen then
sell AT MARKET
ENDIF
ENDIF
//**************************************
//************** REM SHORT**************
//**************************************
//ICHIMOKU TEST AND SHORT CONDITION
TenkansenBelow = Tenkansen < SenkouSpanA and Tenkansen < SenkouSpanB
KijunsenBelow = Kijunsen < SenkouSpanA and Kijunsen < SenkouSpanB
ChikouBelow = Chikou < SenkouSpanA[26] and Chikou < SenkouSpanB[26]
//ENTER/EXIT SHORT MARKET TEST
IF condition and Bearish0 and Bearish1 and TenkansenBelow and KijunsenBelow and ChikouBelow THEN
SELLSHORT PositionSize CONTRACTS AT MARKET
if high crosses over kijunsen then
EXITSHORT AT MARKET
endif
ENDIF
//Adding extra position if in good trend
IF CurrentHour < NoTradingAfter and BARINDEX-TRADEINDEX(1)>1 AND TRADEPRICE(1)-Close>20 AND ShortOnMarket then // AND condition and Bearish0 and Bearish1 and TenkansenBelow and KijunsenBelow and ChikouBelow THEN
SELLSHORT PositionSize CONTRACTS AT MARKET
if low crosses under kijunsen then
sell AT MARKET
ENDIF
ENDIF
// REM stop and profit
StopLoss=109
set stop ploss StopLoss
IF equity>50000 THEN
QUIT
ENDIF
//Debugging
//GRAPH SenkouSpanB COLOURED(0,0,255) AS “Take Profit” //Blue
//GRAPH SenkouSpanA COLOURED(255,0,0) AS “Stop Loss” //Red
//GRAPH Chikou COLOURED(0,0,0) AS “chikou” //Black
//GRAPH TP COLOURED(0,255,255) AS “TP” //Aqua
//GRAPH SL COLOURED(0,255,0) AS “SL” //Lime
//GRAPH xxx COLOURED(0,255,255) AS “TreBarsAbove” //Aqua
//GRAPH xxx COLOURED(255,0,0) AS “TreBarsBelow” //red
//GRAPH condition COLOURED(255,0,0) AS “condition” //red
//GRAPH Indicator COLOURED(255,0,0) AS “Longentry” //red
//GRAPH LongEntry COLOURED(255,0,0) AS “Longentry” //red
//Graph ind COLOURED(255,0,0) AS “condition” //red
07/27/2016 at 8:17 AM #10911The ver.9.0 is pre Aug 2015 and ver9.5 is profitable in 2016.
Even if the codes shows profit it also shows high losses, so in real live trading I would be careful using it- But perhaps some bright ideas and comments from others will lead to a more stable equity curve.
07/27/2016 at 8:41 AM #10915Correction to my note in previous post in the section “my notes to the ver. 9.0 is:”
it should say:
And something with the
//Volitale test
If ABS(highest[candlesperiods](high)-lowest[candlesperiods](low))< NoMomentum1 THEN
condition=0
Else
condition=1
endif
If it not in the code will not generate Any Money??? That’s is very strange and just a coincident derived from an idea
07/27/2016 at 7:50 PM #10937Hi Kasper
Quite a lot to digest in your note. Only, so far, looked at version 9. I’ve incorporated your changes into my MFE version but cannot use the 109 stop if trailing as this will never produce a profit. I’d be interested in knowing what your version does on 10th March 2016 which on hourly, for me, produces a buy at 13:00,correctly, at 9990.7(2 points above inside bar high). In my version I’ve incorporated a condition to not close the trade on the same bar as the entry bar being mindful of the stop loss problem. I believe this gives a better indication of real trading e.g.
Rule1 = (BarIndex-TradeIndex)>=1
Anyway, the tester closes on the next bar for a loss 90 points.
Still some development to do I think but I can post the version if you wish, although, I’m getting overload of versions now!
-
AuthorPosts
Find exclusive trading pro-tools on ![]()