Build a simple indicators dashboard with prorealtime v10.3

Recently on forum, someone ask me how to build a dashboard with multiple indicators informations. While it is not possible with version 10.2, the new graphical instructions of the new prorealtime version 10.3 can build an informative dashboard with any useful information you can imagine. Let’s see how to build a simple one in this blog article.

A dashboard to rule them all

With an informative dashboard, you can “compile” a lot of informations in one place. It also mean that you don’t even need to add the bunch of indicators you need in your every day trading on chart. A simple dashboard indicator will take the place of all the other ones.

Let’s say you need to define the actual trend of the current timeframe, you only need to test if a fast moving average is above or below a slower one. This information could be compiled as a simple arrow on the bottom right corner of your screen, with no need of moving average on your chart. That’s the main purpose of a dashboard and I gonna give you some examples in the next paragraphs.


Important things to do first

Firstly, we define that we want to do graphical instruction only one time, on the last bar only (the actual one) with the drawonlastbaronly instruction ; otherwise, the prorealtime graphical engine will draw our dashboard on every bar instead while loading the whole data history and it will be the mess on your screen! 🙂

Secondly, to draw things on screen we need X and Y coordinates. With prorealtime, these informations are stored in “barindex” for the X coordinate and in price for the Y one. So it’s pretty much easy to know in real time where to place our graphical components. But, because these coordinates are not absolute ones, we need to define an X offset to be sure that multiple components will not overlaid on other ones.

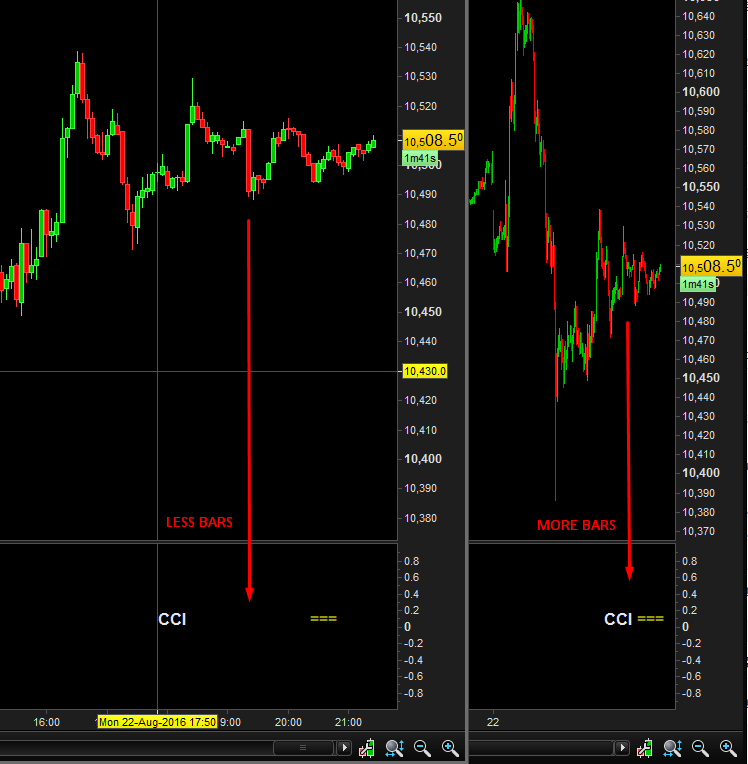
While we are zooming in on chart, less “barindex” will be visible and distance between them (between candlesticks) will widen. And because of the same behaviour or the barindex, while zooming out, more barindex will be visible and more candlesticks too, and distance between them will be very tight. Our X offset will reduce this effect, but can’t delete it completely. That’s how we have to deal with these no-absolute (no pixels ones!) coordinates .. when we want to align text on the same row.

This parameter could be an external one that you can modify at will to have the best result on screen. It depends mainly of the quantity of candlesticks drawn on your chart window.

barindex drawtext

Another solution would be to write the label with the information in the same line, but the entire line would have the same colour (indicator label + information). Since I want to introduce you how to make a nice looking dashboard with different components, let’s keep it that way.

First example, oversold/overbought information of an oscillator

Let’s take the Commodity Channel Index (CCI) indicator and retrieve its overbought and oversold informations. If the oscillator is above 100, it’s overbought, under -100 = oversold, otherwise we only test if it is declining or rising and write it up on screen:

dashboard indicator prorealtime cci test

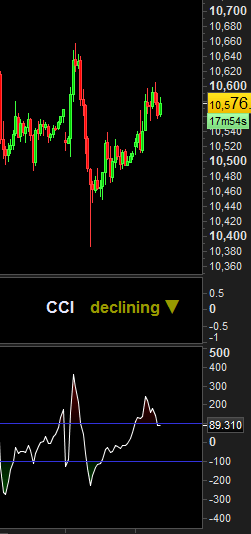
Here is the code for this first example :

The Y coordinate is near 0 because PRT don’t know in advance where you put your graphical component. By default, an indicator will always open at 0. So if you draw something at 1 or 10 on Y coordinate, you will not see it, unless you change yourself the scale of the indicator by hand.


Second example, add the current trend information

By comparing 2 simple moving average, a fast one over or below a slower one, we define if the current trend is bullish or bearish:

bullish trend prorealtime dashboard

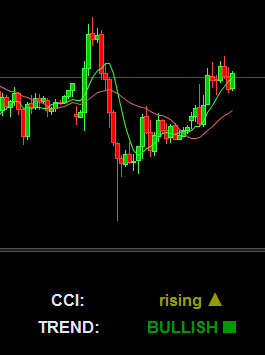
Simple and effective code with a nice looking on chart!


Adding a signal from the current above conditions

Simple condition for a signal:

  • if the CCI is rising and the trend is bullish, then it’s a buy signal
  • if the CCI is declining and the trend is bearish, it’s a sell signal

By adding some variables in our previous conditions, we don’t need to make the whole test once again:

I added the “CCIstate” and “TRENDstate” to store the conditions needed to draw the trades signals.

Now we can add our signals labels in the dashboard:

dashboard prorealtime

trade signals indicator

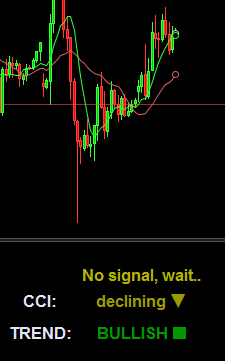
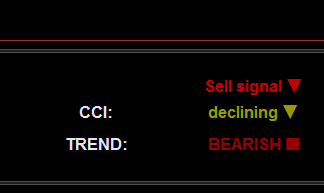
and the signals code:


As usual, the complete code can be downloaded below this post. Hope you like it. If you need assistance to make your own dashboard with your own ideas, you can create a new forum topic and I’ll help you there.

Share this

  1. Willievs • 08/23/2016 #

    Hi
    I am using ProRealtime though IG but it loads version 10.2. How can I get it to load version 10.3. Also, does 10.3 support auto trading inside a candle?
    Regards
    Willie

    • Nicolas • 08/23/2016 #

      Hi, you can get PRT v10.3 directly through prorealtime.com website. The prorealtime.com trading brokerage don’t offer automatic trading sorry, it’s only possible with PRT-CFD or directly through IG. The PRT 10.3 version will come soon or late to IG, it will support the inside bar trading with the multitimeframe feature.

  2. Stef • 08/23/2016 #

    Hi @Nicolas. Has 10.3 been released yet? When I go to the prorealtime website I only get v10.3 beta still?

    • Nicolas • 08/23/2016 #

      Yes, it will be named Beta until its final release, but you can use this version. Because it is in continuous development, new features will come to this version, that’s why it is called “beta”.

  3. Dimi.A • 08/23/2016 #

    Nic, I tried adding the code to my chart and it keeps saying “Syntax Error An indicator code must end with keyword RETURN”.What have I done wrong?

  4. Nicolas • 08/23/2016 #

    Did you try with PRT 10.3? You can download the file from the article instead of copy/paste, to avoid syntax error problem.

    • Dimi.A • 08/23/2016 #

      Awesome, that solved it!How do I changemaFast = average[7](close)maSlow = average[21](close)into EMA 13 and EMA 55 close?
      I tried changing it to:emaFast = average[13](close)emaSlow = average[55](close)but no luck!

  5. Sofitech • 08/23/2016 #

    Dans un dashboard, est-il possible de faire appel à la valeur d’un indicateur dans un timeframe défini, différent de celui de la fenêtre utilisée.
    Exemple : je trade en 70 ticks. Mais je veux afficher la valeur du RSI(14) du M5.

    • Nicolas • 08/23/2016 #

      Non, tant que nous n’aurons pas le support multitimeframe, cela ne sera pas possible. Ça arrive bientôt !

  6. JohnVS • 08/23/2016 #

    Hi Nicolas,
    Is there any development on this dashboard?
    Would love to see a a few things being added to it 
    rgds
    John
     

    • Nicolas • 08/23/2016 #

      This dashboard code is an example and can be adjusted to add any other indicators or price information you would find useful!

  7. JohnVS • 08/23/2016 #

    Yeah even with my poor skills in programming i succeeded in changing it to the RSI 🙂
    yaaay for me.
    But what i would like is there to put some more indicators in there.
    Like stochastic and the swingcounter which you are making now.
    Could you give me an axample how to add at least 1 more indicator so i try and put 1 or 2 more i like in there myself
    rgds
    John
     

    • Nicolas • 08/23/2016 #

      To add another indicator, you have to copy/paste the CCI example from the code and change it to your preferred indicator. Don’t forget to change the X/Y coordinates to not overlap the other indicator.

  8. JohnVS • 08/23/2016 #

    Nicolas,
     
    hahaha yeah i was afraid you was gonna say that 😀
    okay i will try my best 
    I probably get back to you 😛
    rgds
    John

  9. JohnVS • 08/23/2016 #

    Nicolas,
    Wow much to my surprise I managed to get another indicator on the dasboard 🙂
    Now i have a question to you regarding adding the swingteller as you made.
    Is it possible to get the current swing number on the dashboard? 
    I have been trying but for some reason i cant get it visable
    Thanks in advance again
    John
     

    • Nicolas • 08/23/2016 #

      Please make a whole new thread for this request in ProBuilder support forum.

  10. JohnVS • 08/23/2016 #

    Hey all,
    I’ve working on this Dashboard and it wasnt easy 😛 but here is what i have uptil now
    dont know if this the right way to post it but here goes
    for now it works best viewed on a daily screen witj 100 units to show
    defparam drawonlastbaronly=true//symbolen//â– //â–¼//â–²//—indicatorsmyStochastic = stochastic[12,3](close)mashort = ExponentialAverage[8](close)mamiddle = average[50] (close)maLong = average[200] (close)
    rem Dynamische RSIDRAWTEXT(” Dyn. RSI :”,barindex-Xoffset-35,+0.4,SansSerif,Bold,12)coloured(0,0,0)periodmoy=50periodeRSI=12coeff=2monrsi=RSI[periodeRSI](close)
    ind = SQUARE(monrsi)ind1 = Average[periodmoy](monrsi)ind2 = Average[periodmoy](ind)
    variance = ind2 – SQUARE(ind1)ecart = SQRT(variance)
    UpBand = ind1 + coeff*ecartDownBand = ind1 – coeff*ecart
    if Monrsi>UPband thenDRAWTEXT(” Overbought”,barindex-Xoffset-25,+0.4,SansSerif,Bold,12)coloured(0,200,0)elsif Monrsi crosses under Upband thenDRAWTEXT(” Sell â–¼”,barindex-25,+0.4,SansSerif,Bold,12)coloured(255,0,0)elsif Monrsi<downband thenDRAWTEXT(” Oversold”,barindex-Xoffset-25,+0.4,SansSerif,Bold,12)coloured(255,0,0)elsif Monrsi crosses over Downband thenDRAWTEXT(” Go Long â–²”,barindex-25,+0.4,SansSerif,Bold,12)coloured(0,200,0)elsif monrsi>=monrsi[1] thenDRAWTEXT(” Rising â–²”,barindex-25,+0.4,SansSerif,Bold,12)coloured(0,200,0)elsif monrsi<=monrsi[1] thenDRAWTEXT(” Decline â–¼”,barindex-25,+0.4,SansSerif,Bold,12)coloured(255,0,0)endif
    //—adjust Xoffsetif barindex>1000 thenXoffset = 1elsif barindex>=20000 thenXoffset = 1elseXoffset = 1
    //—Trend Short//labelDRAWTEXT(“Short Sup/Res:”,barindex-Xoffset-8,+0.7,SansSerif,Bold,12)coloured(0,0,0)//informationsa=round(mashort*100)/100if mashort<mashort[1] thenDRAWTEXT(” BEAR â–¼”,barindex+0.5,+0.7,SansSerif,Bold,12)coloured(255,0,0)Drawtext(“#a#”,barindex-Xoffset-1.35,+0.7,SansSerif,Bold,12)coloured(0,0,0)elseDRAWTEXT(” BULL â–²”,barindex+0.5,+0.7,SansSerif,Bold,12)coloured(0,200,0)Drawtext(“#a#”,barindex-Xoffset-1.35,+0.7,SansSerif,Bold,12)coloured(0,0,0)endif
    //—adjust Xoffsetif barindex>1000 thenXoffset = 1elsif barindex>=20000 thenXoffset = 1elseXoffset = 1
    //—Trend Middle//LabelDRAWTEXT(“Middl Sup/Res:”,barindex-Xoffset-8,0.25,SansSerif,Bold,12)coloured(0,0,255)//informationsb=round(mamiddle*100)/100if mamiddle<mamiddle[1] thenDRAWTEXT(” BEAR â–¼”,barindex+0.8,+0.25,SansSerif,Bold,12)coloured(255,0,0)Drawtext(“#b#”,barindex-Xoffset-1.35,+0.25,SansSerif,Bold,12)coloured(0,0,0)elseDRAWTEXT(” BULL â–²”,barindex+0.1,+0.25,SansSerif,Bold,12)coloured(0,200,0)Drawtext(“#b#”,barindex-Xoffset-1.35,+0.25,SansSerif,Bold,12)coloured(0,0,0)endif
    //—adjust Xoffsetif barindex>1000 thenXoffset = 1elsif barindex>=20000 thenXoffset = 1elseXoffset = 1
    //—Trend Long//Labelc=round(malong*100)/100DRAWTEXT(“Long Sup/Res:”,barindex-Xoffset-8,-0.2,SansSerif,Bold,12)coloured(255,0,0)//informationsif malong<malong[1] thenDRAWTEXT(” BEAR â–¼”,barindex+0.1,-0.2,SansSerif,Bold,12)coloured(255,0,0)Drawtext(“#c#”,barindex-Xoffset-1.35,-0.2,SansSerif,Bold,12)coloured(0,0,0)elseDRAWTEXT(” BULL â–²”,barindex+0.1,-0.2,SansSerif,Bold,12)coloured(0,200,0)Drawtext(“#c#”,barindex-Xoffset-1.35,-0.2,SansSerif,Bold,12)coloured(0,0,0)endif
    //—Stochastic//labelDRAWTEXT(” Stochastic : “,barindex-Xoffset-35,+0.1,SansSerif,Bold,12)coloured(0,0,0)//informationsif myStochastic>80 thenDRAWTEXT(” Overbought”,barindex-25,+0.1,SansSerif,Bold,12)coloured(0,200,0)elsif myStochastic crosses under 80 thenDRAWTEXT(” Sellâ–¼”,barindex-25,+0.1,SansSerif,Bold,12)coloured(255,0,0)elsif myStochastic<20 thenDRAWTEXT(” Oversold”,barindex-25,+0.1,SansSerif,Bold,12)coloured(255,0,0)elsif myStochastic crosses over 20 thenDRAWTEXT(” Go Long â–²”,barindex-25,+0.1,SansSerif,Bold,12)coloured(0,200,0)elsif mystochastic>mystochastic[1] thenDRAWTEXT(” Rising â–²”,barindex-25,+0.1,SansSerif,Bold,12)coloured(0,200,0)elsif mystochastic<mystochastic[1] thenDRAWTEXT(” Decline â–¼”,barindex-25,+0.1,SansSerif,Bold,12)coloured(255,0,0)
    endif//Swingcounter//labelDRAWTEXT(“Swingcounter : “,barindex-Xoffset-35,+0.7,SansSerif,Bold,12)coloured(0,0,0)Lb=4
    //continue swing Upif UpCount>0 and Close>Close[Lb] thenDownCount=0UpCount=UpCount+1
    //draw countif UpCount=2 thendrawtext(” +2″,barindex-27,0.7,SansSerif,Bold,12)coloured(0,200,0)elsif UpCount=3 thendrawtext(” +3″,barindex-27,0.7,SansSerif,Bold,12)coloured(0,200,0)elsif UpCount=4 thendrawtext(” +4″,barindex-27,0.7,SansSerif,Bold,12)coloured(0,200,0)elsif UpCount=5 thendrawtext(” +5″,barindex-27,0.7,SansSerif,Bold,12)coloured(0,200,0)elsif UpCount=6 thendrawtext(” +6″,barindex-27,0.7,SansSerif,Bold,12)coloured(0,200,0)elsif UpCount=7 thendrawtext(” +7″,barindex-27,0.7,SansSerif,Bold,12)coloured(0,200,0)elsif UpCount=8 thendrawtext(” +8″,barindex-27,0.7,SansSerif,Bold,12)coloured(0,200,0)elsif UpCount=9 thendrawtext(” +9″,barindex-27,0.7,SansSerif,Bold,12)coloured(0,200,0)last9bar=barindex//reset countUpCount=0endif//up swing failelsif UpCount>0 and Close<Close[Lb] then//draw fail countdrawtext(“F”,barindex-29,0.7,SansSerif,Bold,16)coloured(255,0,0)//reset countUpCount=0endif
    //continue swing Downif DownCount>0 and Close<Close[Lb] thenUpCount=0DownCount=DownCount+1
    //draw countif DownCount=2 thendrawtext(” -2″,barindex-27,0.7,SansSerif,Bold,12)coloured(255,0,0)elsif DownCount=3 thendrawtext(” -3″,barindex-27,0.7,SansSerif,Bold,12)coloured(255,0,0)elsif DownCount=4 thendrawtext(” -4″,barindex-27,0.7,SansSerif,Bold,12)coloured(255,0,0)elsif DownCount=5 thendrawtext(” -5″,barindex-27,0.7,SansSerif,Bold,12)coloured(255,0,0)elsif DownCount=6 thendrawtext(” -6″,barindex-27,0.7,SansSerif,Bold,12)coloured(255,0,0)elsif DownCount=7 thendrawtext(” -7″,barindex-27,0.7,SansSerif,Bold,12)coloured(255,0,0)elsif DownCount=8 thendrawtext(” -8″,barindex-27,0.7,SansSerif,Bold,12)coloured(255,0,0)elsif DownCount=9 thendrawtext(” -9″,barindex-27,0.7,SansSerif,Bold,12)coloured(255,0,0)last9bar=barindex//reset countDownCount=0endif//down swing failelsif DownCount>0 and Close>Close[Lb] then//draw fail countdrawtext(“F”,barindex-29,0.7,SansSerif,Bold,16)coloured(0,200,0)//reset countDownCount=0endif
    //begin swing Upif UpCount=0 and barindex-last9bar>1 thenr = close[Lb]if close>r thenUpCount=1DownCount=0//draw countdrawtext(” +1″,barindex-27,0.7,SansSerif,Bold,12)coloured(0,200,0)endifendif
    //begin swing Downif DownCount=0 and barindex-last9bar>1 thenr = close[Lb]if close<r thenDownCount=1UpCount=0//draw countdrawtext(” -1″,barindex-27,0.7,SansSerif,Bold,12)coloured(255,0,0)endifendifendifendifendif
    //Pattern//labelDRAWTEXT(” Candlestick Pattern :”,barindex-Xoffset-38,-0.5,SansSerif,Bold,12)coloured(0,0,0)
    // Trend direction identification//(choose 0=No Trend check, 1=MACD, 2=SAR[default], 3=Directional Movement, 4=Moving Averagea crossing, 5=Stochastic)TDS=0//text color// white = 255,255,255 ; black = 0,0,0r = 0g = 0b = 0
    atr = averagetruerange[10](close)*0.50
    body=close-open
    abody=abs(body)
    if range>0 thenratio=abody/rangeelseratio=0endif
    middle=(open+close)/2
    bodytop=max(open, close)
    bodybottom=min(open, close)
    shadowtop=high-bodytop
    shadowbottom=bodybottom-low
    longcandle= (ratio>0.6)
    DojiSize = 0.05data=(abs(open – close) <= (high – low) * DojiSize)if data thenDRAWTEXT(“Doji”, barindex, high+atr*0.50, Dialog, Standard, 10) COLOURED(R,G,B)endif
    //Trend Detectionif TDS=0 thenTrendUp=1TrendDown=1elseif TDS=1 thenTrendUp=(MACDline[12,26,9](close)>0 AND MACD[12,26,9](close)>0)TrendDown=(MACDline[12,26,9](close)<0 AND MACD[12,26,9](close)<0)elseif TDS=2 thenTrendUp=(SAR[0.02,0.02,0.2]<low)TrendDown=(SAR[0.02,0.02,0.2]>high)elseif TDS=3 thenTrendUp=(ADX[14]>23 AND DI[14](close)>0)TrendDown=(ADX[14]>23 AND DI[14](close)<0)elseif TDS=4 thenTrendUp=(Average[3](close)>Average[12](close))TrendDown=(Average[3](close)<Average[12](close))elseif TDS=5 thenTrendUp=(Stochastic[12,3](close)>Average[3](Stochastic[12,3](close)))TrendDown=(Stochastic[12,3](close)<Average[3](Stochastic[12,3](close)))endifendifendifendifendifendif
    //Bullish Signal
    BullSeparatingLine=(body[1]<0 AND longcandle[1] AND body>0 AND longcandle AND open>=open[1] AND shadowtop<0.1*abody)if BullSeparatingLine thenDRAWTEXT(” Kickup”,barindex-25,-0.5,SansSerif,Bold,12)coloured(0,200,0)DRAWARROWUP(barindex,low) COLOURED(0,155,10)endif
    MorningStar=(body[2]<0 and body>0 and longcandle[2] and open[1]<close[2] and open>close[1] and ratio[1]<0.3 and abody[1]<abody[2] and abody[1]<abody and low[1]<low and low[1]<low[2] and high[1]<open[2] and high[1]<close)if TrendDown[2] AND MorningStar thenDRAWTEXT(” Morning star”,barindex-25,-0.5,SansSerif,Bold,12)coloured(0,200,0)DRAWARROWUP(barindex-1,low[1]) COLOURED(0,155,10)endif
    PiercingLine=(body[1]<0 and body>0 and longcandle[1] and longcandle and open<low[1] and close>middle[1] and close<open[1])if TrendDown[2] AND PiercingLine thenDRAWTEXT(” Piercing Line”,barindex-25,-0.5,SansSerif,Bold,12)coloured(0,200,0)DRAWARROWUP(barindex,low) COLOURED(0,155,10)endif
    AbandonedBabyBottom=(body[2]<0 and body>0 and longcandle[2] and ratio[1]<0.3 and high[1]<low[2] and high[1]<low)if TrendDown[2] AND AbandonedBabyBottom thenDRAWTEXT(” Abandoned Baby”,barindex-25,-0.5,SansSerif,Bold,12)coloured(0,200,0)DRAWARROWUP(barindex,low) COLOURED(0,155,10)endif
    BullishHarami=(body[1]<0 and body>0 and longcandle[1] and bodybottom>bodybottom[1] and bodytop<bodytop[1])if TrendDown[2] AND BullishHarami thenDRAWTEXT(” Bullish Harami”,barindex-25,-0.5,SansSerif,Bold,12)coloured(0,200,0)DRAWARROWUP(barindex,low) COLOURED(0,155,10)endif
    BullishEngulfing=(body[1]<0 and body>0 and bodybottom<bodybottom[1] and bodytop>bodytop[1] and longcandle)if TrendDown[2] AND BullishEngulfing thenDRAWTEXT(” Bullish Engulfing”,barindex-25,-0.5,SansSerif,Bold,12)coloured(0,200,0)DRAWARROWUP(barindex,low) COLOURED(0,155,10)endif
    DragonflyDojiBottom=(body[1]<0 and longcandle[1] and low<low[1] and shadowbottom>3*abody and shadowtop<shadowbottom/3)if TrendDown[2] AND DragonflyDojiBottom thenDRAWTEXT(” Dragonfly Doji”,barindex-25,-0.5,SansSerif,Bold,12)coloured(0,200,0)DRAWARROWUP(barindex,low) COLOURED(0,155,10)endif
    GravestoneDojiBottom=(body[1]<0 and longcandle[1] and low<low[1] and shadowtop>3*abody and shadowbottom<shadowtop/3)if TrendDown[2] AND GravestoneDojiBottom thenDRAWTEXT(” Gravestone Doji”,barindex-25,-0.7,SansSerif,Bold,12)coloured(0,200,0)DRAWARROWUP(barindex,low) COLOURED(0,155,10)endif
    DojiStarBottom=(body[1]<0 AND longcandle[1] AND low<low[1] AND open<close[1] AND ratio<0.3 AND range<0.3*range[1])if TrendDown[2] AND DojiStarBottom thenDRAWTEXT(” Doji”,barindex-25,-0.5,SansSerif,Bold,12)coloured(255,0,0)endif
    BullishHaramiCross=(body[1]<0 and longcandle[1] and bodybottom>bodybottom[1] and bodytop<bodytop[1] and ratio<0.3 and range<0.3*range[1])if TrendDown[2] AND BullishHaramiCross thenDRAWTEXT(” Bullish Harami Cross”,barindex-25,-0.5,SansSerif,Bold,12)coloured(0,200,0)DRAWARROWUP(barindex,low) COLOURED(0,155,10)endif
    Hammer=(body[1]<0 and longcandle[1] and low<low[1] and shadowbottom>2*abody and shadowtop<0.3*abody)if TrendDown[2] AND Hammer thenDRAWTEXT(” Hammer”,barindex-25,-0.7,SansSerif,Bold,12)coloured(0,200,0)DRAWARROWUP(barindex,low) COLOURED(0,155,10)endif
    InvertedHammer=(body[1]<0 and longcandle[1] and low<low[1] and shadowtop>2*abody and shadowbottom<0.3*abody)if TrendDown[2] AND InvertedHammer thenDRAWTEXT(” Inverted Hammer”,barindex-25,-0.6,SansSerif,Bold,12)coloured(0,200,0)DRAWARROWUP(barindex,low) COLOURED(0,155,10)endif
    //Bearish Signal—————————————
    BearSeparatingLine=(body[1]>0 AND longcandle[1] AND body<0 AND longcandle AND open<=open[1] AND shadowbottom<0.1*abody)if BearSeparatingLine thenDRAWTEXT(” Kicker down”,barindex-25,-0.5,SansSerif,Bold,12)coloured(255,0,0)DRAWARROWDOWN(barindex,high) COLOURED(255,0,10)endif
    EveningStar=(body[2]>0 AND body<0 and longcandle[2] and open[1]>close[2] and open<close[1] and ratio[1]<0.3 and abody[1]<abody[2] and abody[1]<abody and high[1]>high and high[1]>high[2] and low[1]>open[2] and low[1]>close)if TrendUp[2] AND EveningStar thenDRAWTEXT(” Evening Star”,barindex-25,-0.5,SansSerif,Bold,12)coloured(255,0,0)DRAWARROWDOWN(barindex-1,high[1]) COLOURED(255,0,10)endif
    DarkCloudCover=(body[1]>0 and body<0 and longcandle[1] and longcandle and open>high[1] and close<middle[1] and close>open[1])if TrendUp[2] AND DarkCloudCover thenDRAWTEXT(” Dark Cloud”,barindex-25,-0.5,SansSerif,Bold,12)coloured(255,0,0)DRAWARROWDOWN(barindex,high) COLOURED(255,0,10)endif
    AbandonedBabyTop=(body[2]>0 and body<0 and longcandle[2] and ratio[1]<0.3 and low[1]>high[2] and low[1]>high)if TrendUp[2] AND AbandonedBabyTop thenDRAWTEXT(” Abandoned Baby”,barindex-25,-0.5,SansSerif,Bold,12)coloured(255,0,0)DRAWARROWDOWN(barindex,high) COLOURED(255,0,10)endif
    BearishHarami=(body[1]>0 and body<0 and longcandle[1] and bodybottom>bodybottom[1] and bodytop<bodytop[1])if TrendUp[2] AND BearishHarami thenDRAWTEXT(” Bearish Harami”,barindex-25,-0.5,SansSerif,Bold,12)coloured(255,0,0)DRAWARROWDOWN(barindex,high) COLOURED(255,0,10)endif
    BearishEngulfing=(body[1]>0 and body<0 and bodybottom<bodybottom[1] and bodytop>bodytop[1] and longcandle)if TrendUp[2] AND BearishEngulfing thenDRAWTEXT(” Bearish Engulfing”,barindex-25,-0.5,SansSerif,Bold,12)coloured(255,0,0)DRAWARROWDOWN(barindex,high) COLOURED(255,0,20)endif
    DragonflyDojiTop=(body[1]>0 and longcandle[1] and high>high[1] and shadowbottom>3*abody and shadowtop<shadowbottom/3)if TrendUp[2] AND DragonflyDojiTop thenDRAWTEXT(” Dragonfly Doji”,barindex-25,-0.5,SansSerif,Bold,12)coloured(255,0,0)DRAWARROWDOWN(barindex,high) COLOURED(255,0,10)endif
    GravestoneDojiTop=(body[1]>0 and longcandle[1] and high>high[1] and shadowtop>3*abody and shadowbottom<shadowtop/3)if TrendUp[2] AND GravestoneDojiTop thenDRAWTEXT(” Gravestone Doji”,barindex-25,-0.5,SansSerif,Bold,12)coloured(255,0,0)DRAWARROWDOWN(barindex,high) COLOURED(255,0,10)endif
    DojiStarTop=(body[1]>0 AND longcandle[1] AND high>high[1] AND open>close[1] AND ratio<0.3 AND range<0.3*range[1])if TrendUp[2] AND DojiStarTop thenDRAWTEXT(“Doji”,barindex-25,-0.5,SansSerif,Bold,12)coloured(255,0,0)endif
    BearishHaramiCross=(body[1]>0 and longcandle[1] and bodybottom>bodybottom[1] and bodytop<bodytop[1] and ratio<0.3 and range<0.3*range[1])if TrendUp[2] AND BearishHaramiCross thenDRAWTEXT(” Bearharami Cross”,barindex-25,-0.5,SansSerif,Bold,12)coloured(255,0,0)DRAWARROWDOWN(barindex,high) COLOURED(255,0,10)endif
    ShootingStar=(body[1]>0 and longcandle[1] and high>high[1] and shadowtop>2*abody and shadowbottom<0.3*abody)if TrendUp[2] AND ShootingStar thenDRAWTEXT(” Shooting Star”,barindex-25,-0.6,SansSerif,Bold,12)coloured(255,0,0)DRAWARROWDOWN(barindex,high) COLOURED(255,0,10)endif
    HangingMan=(body[1]>0 and longcandle[1] and high>high[1] and shadowbottom>2*abody and shadowtop<0.3*abody)if TrendUp[2] AND HangingMan thenDRAWTEXT(” Hanging Man “,barindex-25,-0.7,SansSerif,Bold,12)coloured(255,0,0)DRAWARROWDOWN(barindex,high) COLOURED(255,0,10)endif
    //GapsGapUp=(low>high[1])GapDown=(high<low[1])if GapUp thenDRAWTEXT(“G “, barindex, (high[1]+low)/2, Dialog, Bold, 10) COLOURED(0,0,0)elseif GapDown thenDRAWTEXT(“G “, barindex, (high+low[1])/2, Dialog, Bold, 10) COLOURED(0,0,0)endifendif
    //Tweezers Top and BottomTweezersTop=(body[1]>0 AND longcandle[1] AND body<=0 AND high=high[1])if TrendUp[2] AND TweezersTop thenDRAWTEXT(” Tweezer Top”, barindex-25,-0.7,SansSerif,Bold,12)coloured(255,0,0)DRAWARROWDOWN(barindex,high) COLOURED(255,0,10)endif
    TweezersBottom=(body[1]<0 AND longcandle[1] AND body>=0 AND low=low[1])if TrendDown[2] AND TweezersBottom thenDRAWTEXT(” Tweezer Bottom”, barindex-25,-0.7,SansSerif,Bold,12)coloured(0,200,0)DRAWARROWUP(barindex,low) COLOURED(0,155,10)endif
    // inputsPeriod = 12Lookback = 3ob = 70os = 30
    //calc
    //—indicator RMI// LabelDRAWTEXT(” Rel.Momentum : “,barindex-Xoffset-36,-0.2,SansSerif,Bold,12)coloured(0,0,0)momup=max(close-close[lookback],0)momdown=max(close[lookback]-close,0)
    up = average[period,1](momup)dn = average[period,1](momdown)
    rm=up/dn
    rmi = 100*rm/(1+rm)if RMI > ob thenDRAWTEXT(” Overbought”,barindex-Xoffset-25,-0.2,SansSerif,Bold,12)coloured(0,200,0)elsif RMI crosses under ob thenDRAWTEXT(” Sell â–¼”,barindex-25,-0.2,SansSerif,Bold,12)coloured(255,0,0)elsif RMI< os thenDRAWTEXT(” Oversold”,barindex-Xoffset-25,-0.2,SansSerif,Bold,12)coloured(255,0,0)elsif RMI crosses over os thenDRAWTEXT(” Go Long â–²”,barindex-25,-0.2,SansSerif,Bold,12)coloured(0,200,0)elsif rmi>=rmi[1] thenDRAWTEXT(” Rising â–²”,barindex-25,-0.2,SansSerif,Bold,12)coloured(0,200,0)elsif rmi<=rmi[1] thenDRAWTEXT(” Decline â–¼”,barindex-25,-0.2,SansSerif,Bold,12)coloured(255,0,0)endif
    RETURN
    Hope you like it.
    rgds
    John

    • Newbie70 • 82 days ago #

      I just registered on ProRealCode and found this old post….
      I am trying to copy the code, without success. could you please upload the file?
      Thanks in advance

  11. Moritz Müller • 08/23/2016 #

    Salut Nicolas,

    I was just wondering if there is a dashboard “out of the box” included in V11 or if there is a nice way planned for the future. I think it would be super, if there could be a customizable table somewhere in the chart window or as a customizable table in a separate window (just like the screeners, charts etc).
    if there is already a solution, just let me know.
    thanks and great work in V11
    all the best

avatar
Register or

Top