

Pivots JF. Carter.
December 18, 2018, 2:59 PM
Indicators
0 Comments
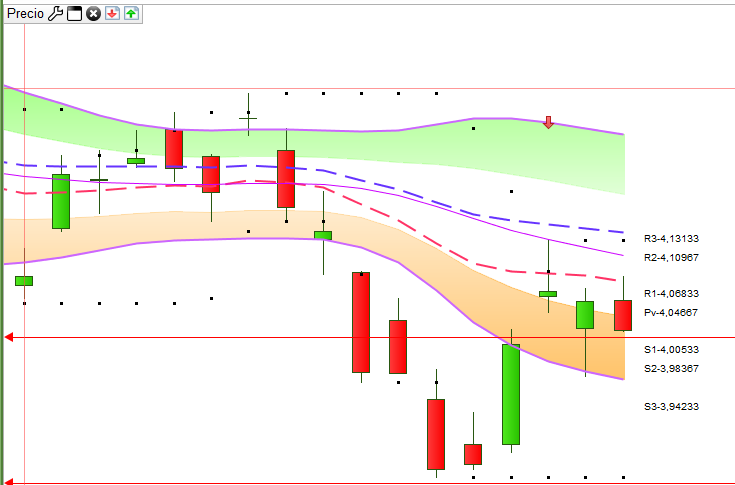
Here is an indicator that shows the pivots according to the formula used by J.F Carter in his book “Dominate Trading”.
The color of the pivots can be configured to your own taste.
// Pivots JF Carter
// J.J.P.
// Diciembre 2018.

DefParam DrawOnLastBarOnly = true
if day <> day[1] then
 startbar = barindex
endif


Pv=(high+low + close)/3
Rs1=2*pv-low
Rs2=pv+(high-low)
Rs3=Rs1 + (high-low)
Ss1=2*pv-high
Ss2=pv-(high-low)
Ss3=Ss1-(high-low)

//r=255
//g=255
//b=255
drawtext("                                 Pv-#pv#",startbar,pv,Dialog,Standard,10) coloured(r,g,b)
drawtext("                                 R1-#Rs1#",startbar,rs1,Dialog,Standard,10) coloured(r,g,b)
drawtext("                                 R2-#Rs2#",startbar,rs2,Dialog,Standard,10) coloured(r,g,b)
drawtext("                                 R3-#Rs3#",startbar,rs3,Dialog,Standard,10) coloured(r,g,b)
drawtext("                                 S1-#ss1#",startbar,ss1,Dialog,Standard,10) coloured(r,g,b)
drawtext("                                 S2-#ss2#",startbar,ss2,Dialog,Standard,10) coloured(r,g,b)
drawtext("                                 S3-#Ss3#",startbar,Ss3,Dialog,Standard,10) coloured(r,g,b)
return
Download
Filename:
JJP-Pivots-Carter.itf
Downloads:
158
Veteran
As an architect of digital worlds, my own description remains a mystery. Think of me as an undeclared variable, existing somewhere in the code.
Author’s Profile
Loading...