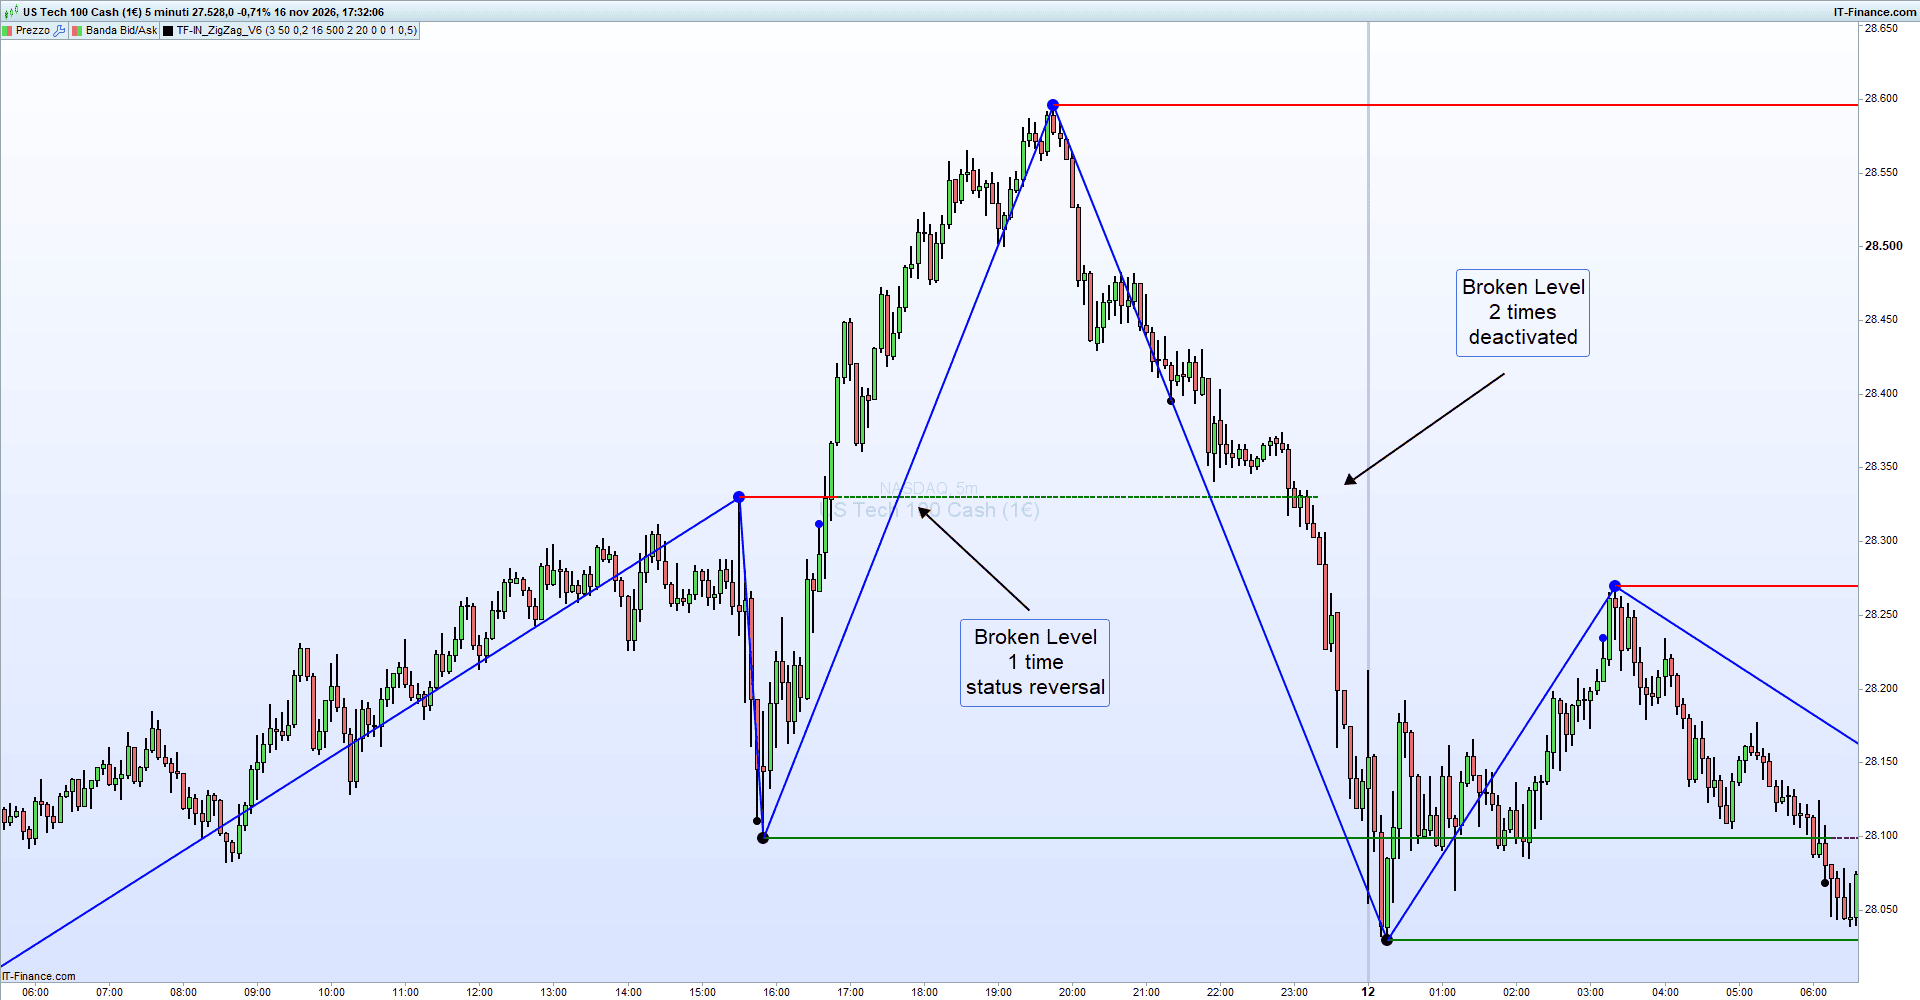
Salve, per chi può essere interessato, ho scritto una nuova versione dell’indicatore ZigZag con l’aggiunta di alcune funzioni che mi servivano.
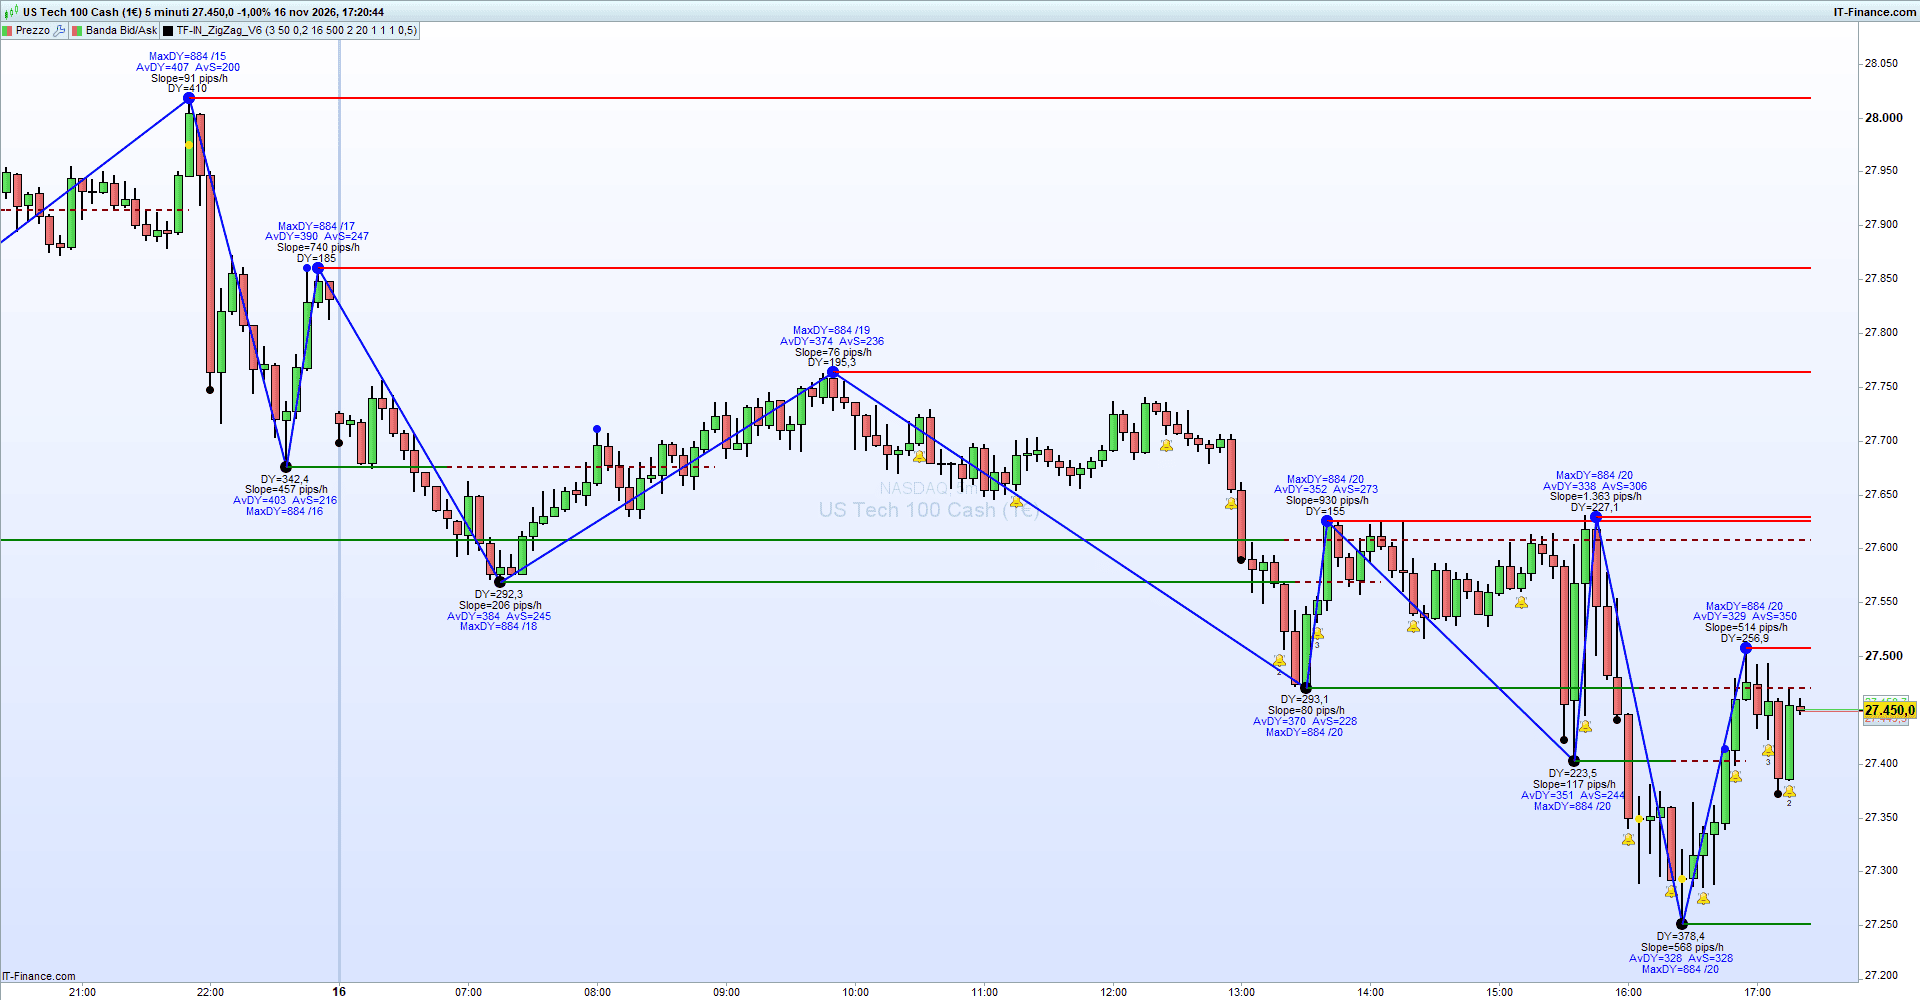
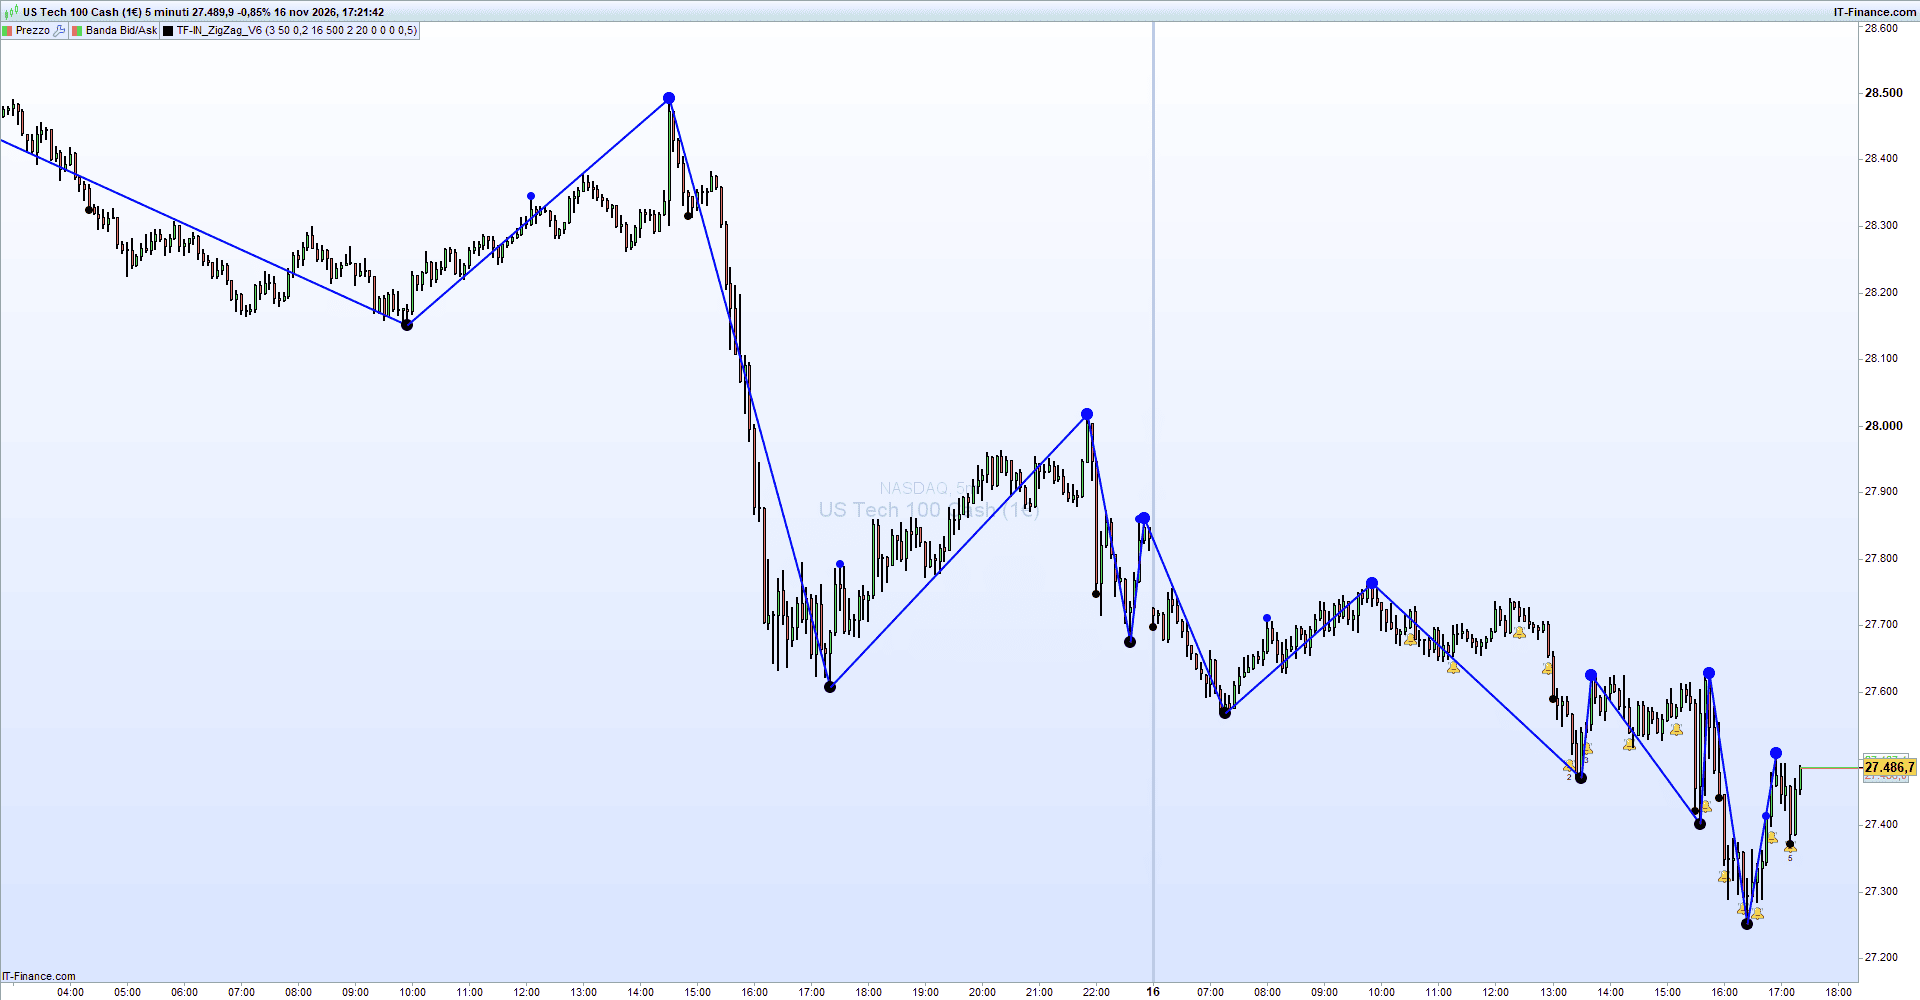
- No repaint del segmento in corso di formazione. Viene evidenziata la prima candela a partire dalla quale il segmento precedente diventa definitivo
- Funzionamento con 4 modalità: 1) con DeltaY determinato da soglia in Pips (ZZPointsT1); 2) con DeltaY in percentuale del prezzo dello strumento (ZZPercT2); 3) con DeltaY in percentuale dell’ATR daily degli ultimi 5 giorni; 4) con DeltaY in percentuale dell’ATR del timeframe corrente a 14 periodi
- Possibilità di selezionare quale elemento della candela utilizzare per il tracciamento degli angoli: VarType=1 customclose; VarType=2 usa alternativamente i minimi e i massimi per i vertici inferiori e superiori
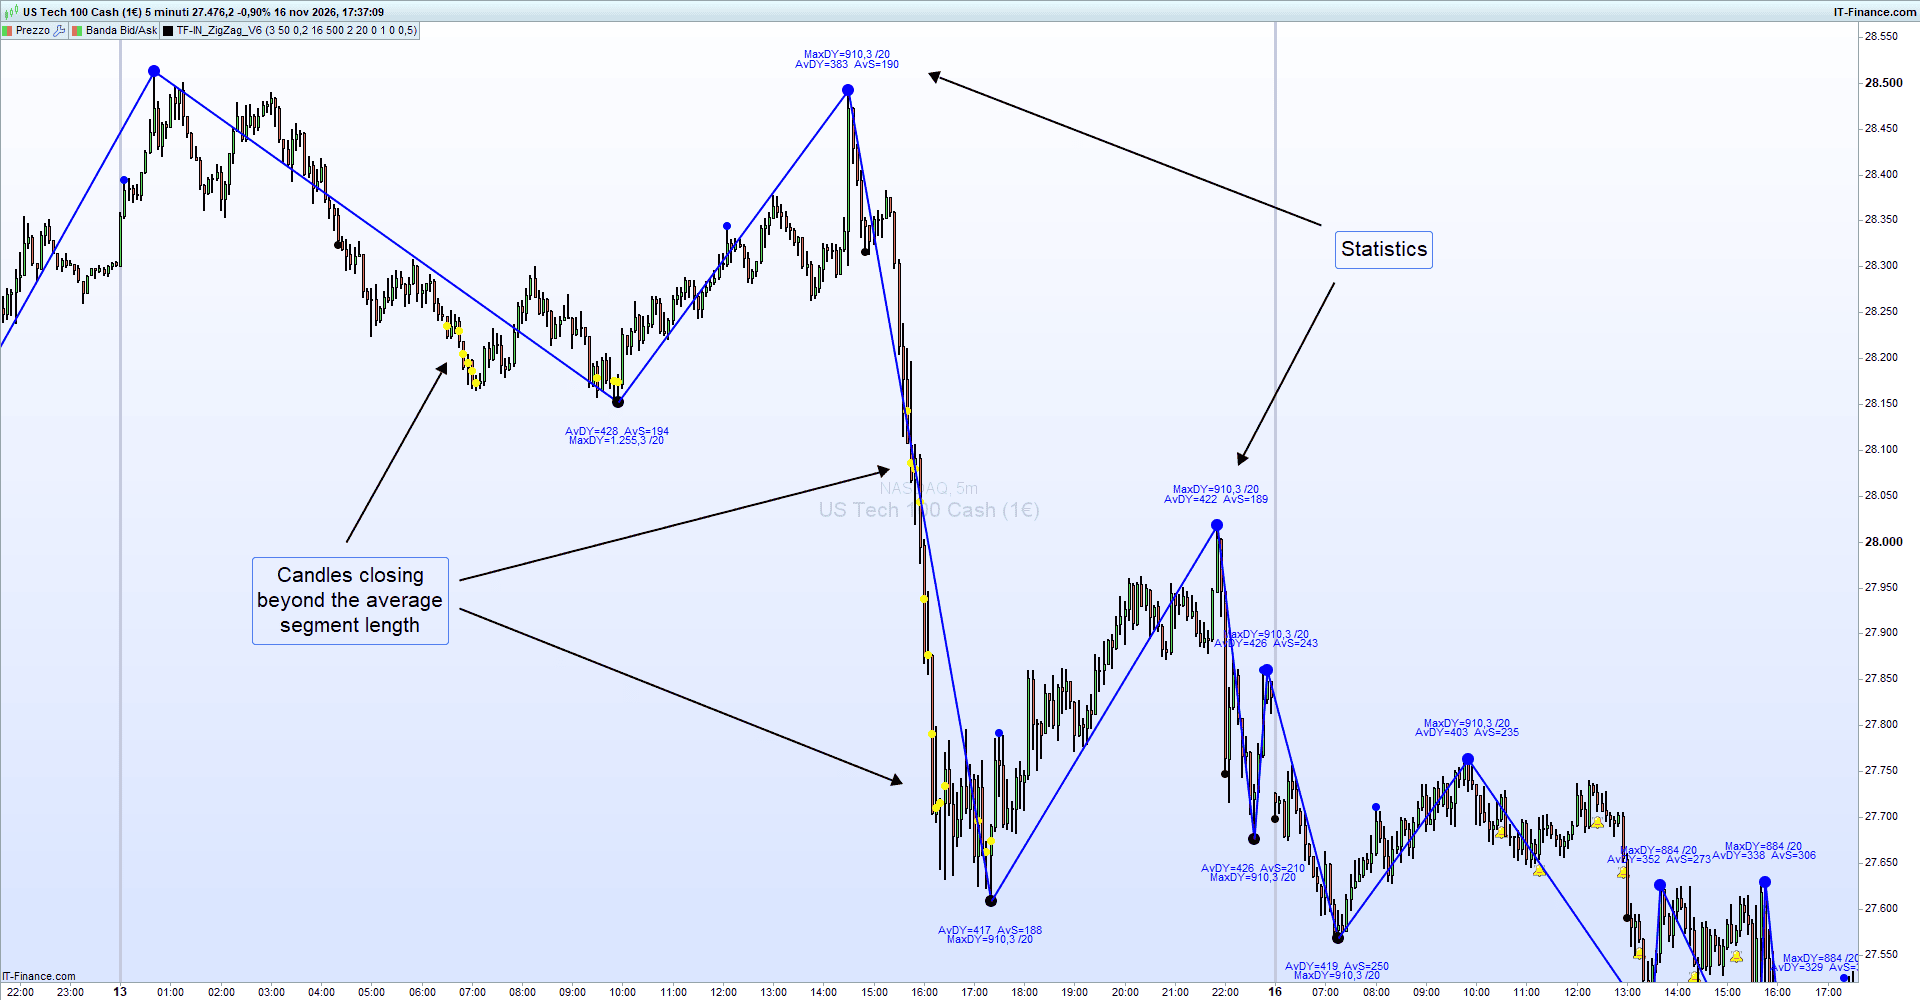
- Statistiche memorizzando in un array (di dimensione fissa, che viene riempito a scorrimento) gli ultimi N segmenti determinati dalla variabile Segments.
- Impostando Stats=1, viene individuato il valore massimo e medio del dei segmenti nell’array, e vengono evidenziate con un pallino giallo le candele che risiedono su segmenti che hanno dimensioni maggiori al valore medio (pre alert inversione zig); viene calcolato anche il valore medio della pendenza dei segmenti, espressa sempre in pips/ora indipendentemente dal timeframe utilizzato
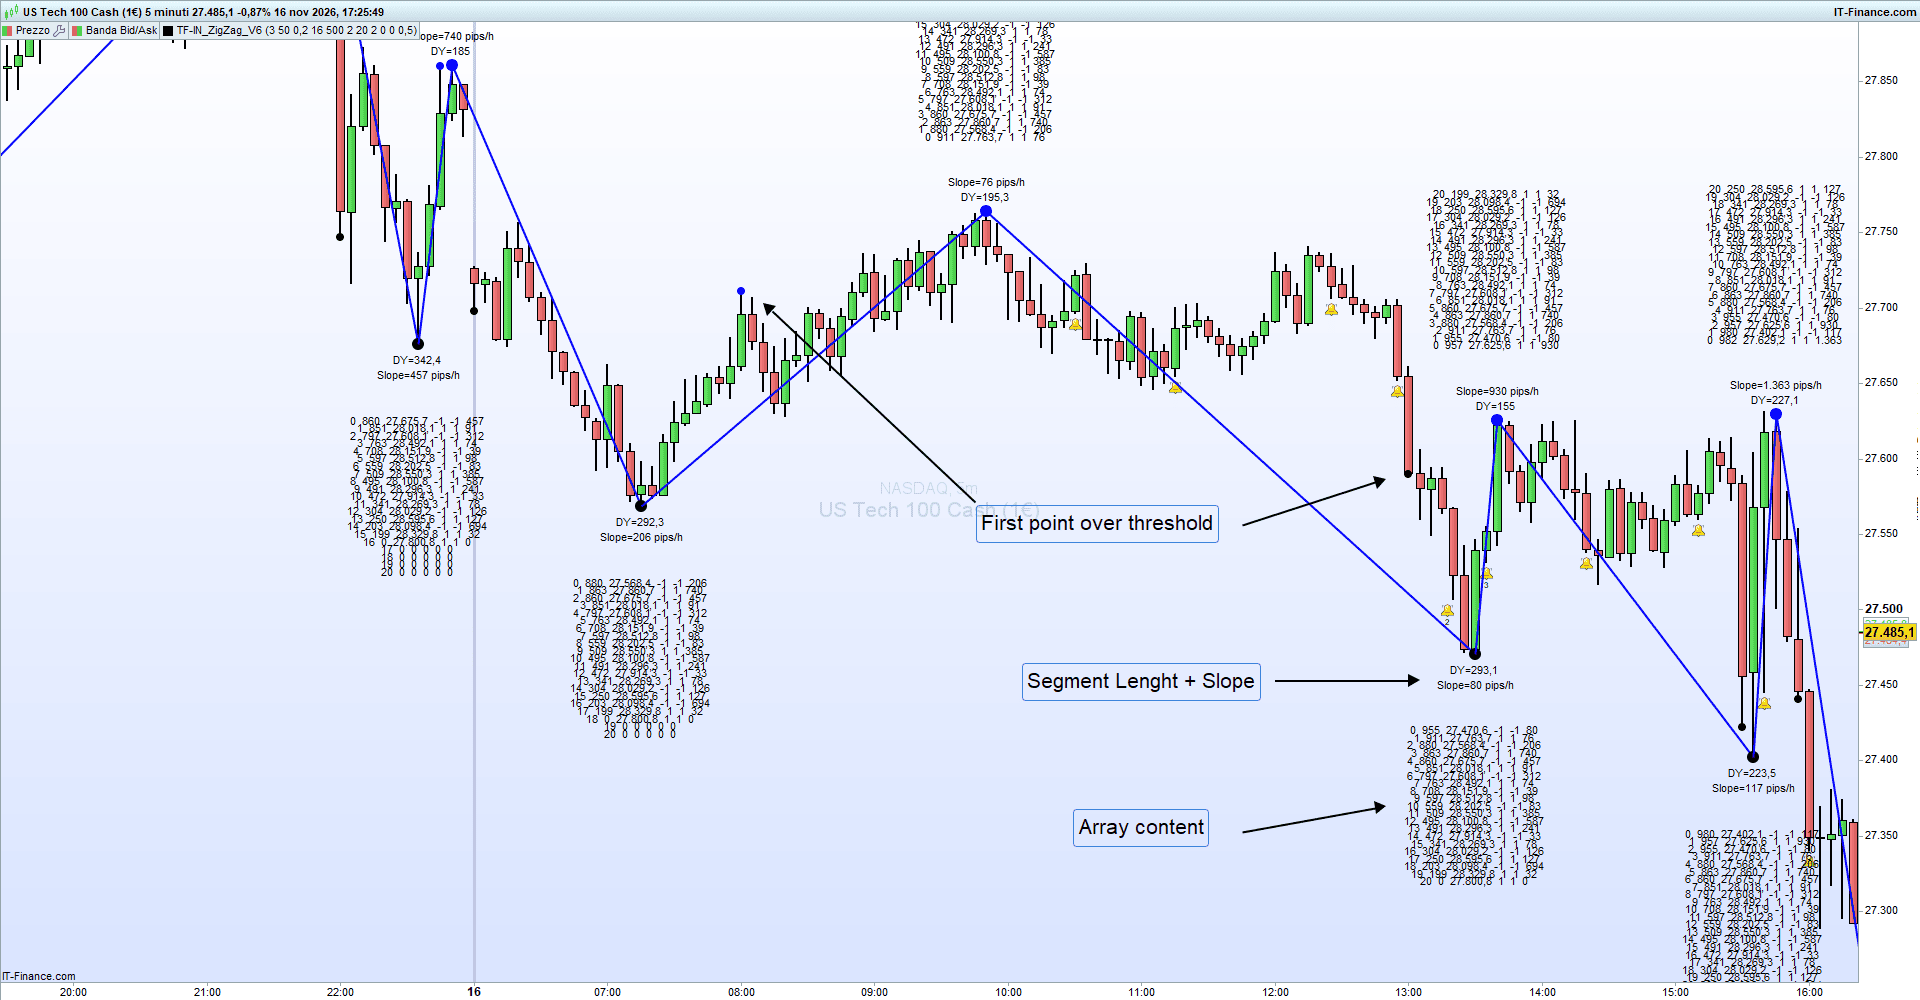
- Con la variabile “Info” si possono far comparire informazioni aggiuntive: Info=1 vengono indicate le dimensioni di ogni segmento e la relativa pendenza; Info=2 tabella con lo stato di tutti i valori attualmente memorizzati nell’array
- Con la variabile “Levels” vengono tracciati livelli di supporto/resistenza a partire dai vertici confermati dello zig e memorizzati nell’array. Ovviamente i livelli tracciati sui valori che vengono espulsi dall’array si arrestano (anche perché, a seconda del valore di Levels, diventerebbero molto vecchi); il codice gestisce il cambio di colore in caso di rottura di un livello (una resistenza rotta si trasforma in un possibile supporto, e viceversa), mentre alla seconda rottura il livello si considera disattivato. Ogni rottura avviene quando una candela successiva si trova con High e Low oltre al livello, con la possibilità di aggiungere una tolleranza con il parametro “KLevStateChange” che aggiunge una parte dell’atr corrente alla soglia
//V6 16/11/2026 - T.F. - ZigZag code with Array
//V6 general general overhaul, with a single array for per zzHigh e zzLow, added type 3 and 4, error correction, statistics, levels

//Variables:
//ZZType=3 //1=pips; 2=perc; 3=perc on ATRD6; 4==perc on ATR current timeframe
//ZZPointsT1=50 //Pips using Type=1
//ZZPercT2=0.25 //% of price using Type=2
//ZZPercT3=15 //% of ATRD5 using Type=3
//ZZPercT4=500 //% of ATR14 current timeframe using Type=4
//VarType=2 //1=customclose; 2=High/Low
//Segments=40  //n. segments up/dw to store in the array
//Info=0 //1=show slope and delta between points; 2=show array contents;
//Stats=0 //1=show max and average DY of array content
//Levels=0 //1=show levels with resistance and support management
//KLevStateChange=0.5 //ATR multiplier for the current timeframe, used for managing level state changes

//define first point of ZZ
once LastPoint = 1
once Hx0    = barindex
once Hy0    = Close
once Lx0    = barindex
once Ly0    = Close
//initializing array
once $zzX[0] = barindex //barindex vertex
once $zzY[0] = Close    //price level vertex
once $zzT[0] = 1        //vertex type: 1=high ;-1=low
once $zzLS[0] = 1       //level status: 1=resistence; -1=support; 11=resistace (was a broken support); -11=support (was a broken resistace)
once $zzS[0] = 0        //slope previous segment

//ZZ Type
If ZZType=1 then //ZZ in pips
DeltaY=ZZPointsT1*pipsize
elsif ZZType=2 then //ZZ in % of price
DeltaY=ZZPercT2/100*Dclose(1) //Dclose used as ref.
elsif ZZType=3 then //ZZ in % of AtrD5
if day<>day[1] then
AtrD5=(Dhigh(5)-Dlow(5)+Dhigh(4)-Dlow(4)+Dhigh(3)-Dlow(3)+Dhigh(2)-Dlow(2)+Dhigh(1)-Dlow(1))/5
endif
DeltaY=ZZPercT3/100*AtrD5
elsif ZZType=4 then //ZZ in % of Atr14 current timeframe
DeltaY=ZZPercT4/100*averagetruerange[14](close)
endif

//Variable Type
if Vartype=1 then
VarH=Customclose
VarL=customclose
elsif Vartype=2 then
VarH=High
VarL=Low
endif

//ZZ in phase 1 - now search for a new lower vertex
if LastPoint=1 then //lastpoint was a top - start search for a bottom
if VarH>Hy0 then //update last top and stay in LastPoint=1
Hy0=VarH
Hx0=barindex
//drawpoint(Hx0,Hy0,2) coloured("blue") //new temporary top
if abs(Hy0-Ly0)>AvDeltaZZ*pipsize and stats=1 and (date=today OR date=Yesterday) then
drawpoint (barindex,(open+close)/2,2) coloured("yellow")
//drawarrowdown(barindex,(open+close)/2) coloured("cyan")
endif
//drawsegment(Lx0,Ly0,Hx0,Hy0) //new temporary segment
elsif VarL<(Hy0-DeltaY) and barindex>Hx0+1 then //first point in low - confirm last top stored Hy0
for i=Segments-1 downto 0 do //array shifting
$zzX[i+1]=$zzX[i]
$zzY[i+1]=$zzY[i]
$zzT[i+1]=$zzT[i]
$zzLS[i+1]=$zzLS[i]
$zzS[i+1]=$zzS[i]
next
drawsegment(Lx0,Ly0,Hx0,Hy0) coloured ("blue") style (line,2)
drawpoint(Hx0,Hy0,3) coloured ("blue") //new final ZZhigh
Slope=round(abs((Hy0-Ly0)/pipsize/(Hx0-Lx0)/gettimeframe*3600)) //slope in pips/hour
$zzX[0]=Hx0 //store last index ZZhigh
$zzY[0]=Hy0 //store last value ZZlhigh
$zzT[0]=1   //type high
$zzLS[0]=1  //level status=resistance
$zzS[0]=slope //slope
if Info=>1 then //delta & slope
dy=abs((Hy0-Ly0)/pipsize)
drawtext ("DY=#dy#",Hx0,Hy0+10*pipsize)
drawtext ("Slope=#slope#pips/h",Hx0, Hy0+20*pipsize)
endif
if Info=2 then //array contents
for i=0 to segments do
n=i
a=$zzX[i]
b=$zzY[i]
c=$zzT[i]
d=$zzLS[i]
e=$zzS[i]
drawtext("#n# #a# #b# #c# #d# #e#", Hx0, Hy0+50*pipsize+i*5*pipsize)
next
endif
//store new temporary low and change lastpoint status
Ly0=VarL
Lx0=barindex
drawpoint(Lx0,Ly0,2) coloured("black") //first temporary low
LastPoint=-1
endif
endif

//ZZ in phase -1 - now search for a new higher vertex
if LastPoint=-1 then //lastpoint was a low - start search for a top
if VarL<Ly0 then //update last low and stay in LastPoint=-1
Ly0=VarL
LX0=barindex
//drawpoint(Lx0,Ly0,2) coloured("black") //new temporary low
if abs(Hy0-Ly0)>AvDeltaZZ*pipsize and stats=1 and (date=today OR date=Yesterday) then
drawpoint(barindex,(open+close)/2,2) coloured("yellow")
//drawarrowup(barindex,(open+close)/2) coloured("magenta")
endif
//drawsegment(Lx0,Ly0,Hx0,Hy0) //new temporary segment
elsif VarH>(Ly0+DeltaY) and barindex>Lx0+1 then //first point in top - confirm last low stored Ly0
for i=Segments-1 downto 0 do  //array shifting
$zzX[i+1]=$zzX[i]
$zzY[i+1]=$zzY[i]
$zzT[i+1]=$zzT[i]
$zzLS[i+1]=$zzLS[i]
$zzS[i+1]=$zzS[i]
next
drawsegment(Hx0,Hy0,Lx0,Ly0) coloured ("blue") style (line,2)
drawpoint(Lx0,Ly0,3) coloured ("black") //new final ZZlow
Slope=round(abs((Hy0-Ly0)/pipsize/(Hx0-Lx0)/gettimeframe*3600)) //slope in pips/hour
$zzX[0]=Lx0  //store last index ZZlow
$zzY[0]=Ly0  //store last value ZZlow
$zzT[0]=-1   //type low
$zzLS[0]=-1  //level status=support
$zzS[0]=slope //slope
if Info=>1 then //delta & slope
dy=abs((Hy0-Ly0)/pipsize)
drawtext ("DY=#dy#",Lx0,Ly0-10*pipsize)
drawtext ("Slope=#slope#pips/h",Lx0,Ly0-20*pipsize)
endif
if Info=2 then //array contents
for i=0 to segments do
n=i
a=$zzX[i]
b=$zzY[i]
c=$zzT[i]
d=$zzLS[i]
e=$zzS[i]
drawtext("#n# #a# #b# #c# #d# #e#", LX0, Ly0-50*pipsize-i*5*pipsize)
next
endif
//store new temporary high and change lastpoint status
Hy0=VarH
Hx0=barindex
drawpoint(Hx0,Hy0,2) coloured("blue") //first temporary top
LastPoint=1
endif
endif

//STATISTICS
//search for mean and maximum values, segments, and slope
if stats=1 and lastpoint<>lastpoint[1] and (date=today OR date=Yesterday) then
SumDeltaZZ=0
SumValue=0
MaxDeltaZZ=0
SumSlope=0
for i=0 to lastset($zzY)-1 do
if $zzX[i]<>0 then //nel caso in n. di segmenti sia eccessivo per le candele sul grafico
SumDeltaZZ=SumDeltaZZ+abs($zzY[i]-$zzY[i+1])
SumSlope=SumSlope+$zzS[i]
SumValue=SumValue+1
if abs($zzY[i]-$zzY[i+1])>MaxDeltaZZ then
MaxDeltaZZ=abs($zzY[i]-$zzY[i+1])
endif
endif
next
AvDeltaZZ=SumDeltaZZ/SumValue
AvSlope=SumSlope/SumValue
aa=round(AvDeltaZZ/pipsize) //average in pips for text
bb=round(AvSlope)
drawtext("AvDY=#aa# AvS=#bb#", $zzX[0],$zzY[0]+30*pipsize*$zzT[0]) coloured ("blue")
cc=MaxDeltaZZ/pipsize //max value in pips for text
drawtext("MaxDY=#cc#/#SumValue#", $zzX[0],$zzY[0]+40*pipsize*$zzT[0]) coloured ("blue")
endif

//LEVELS
atrCT=averagetruerange[14](close)*KLevStateChange
if levels=1 then
//primo tratto dal vartice al punto di cambio stato ZZ
if lastpoint crosses under 0 then
drawsegment(Hx0,Hy0,barindex,Hy0) coloured ("red") style (line,2)
endif
if lastpoint crosses over 0 then
drawsegment(Lx0,Ly0,barindex,Ly0) coloured ("green") style (line,2)
endif
for i=0 to lastset($zzY) do
//cambio stato livelli
if $zzLS[i]=1 and low>$zzY[i]+atrCT then //Resistance level broken, it becomes support and changes color.
$zzLS[i]=-11
endif
if $zzLS[i]=-11 and high<$zzY[i]-atrCT then //Level that has become a support is broken a second time, it is deactivated.
$zzLS[i]=0
endif
if $zzLS[i]=-1 and high<$zzY[i]-atrCT then //Support level broken, it becomes resistance and changes color.
$zzLS[i]=11
endif
if $zzLS[i]=11 and low>$zzY[i]+atrCT then //Level that has become a resistance is broken a second time, it is deactivated.
$zzLS[i]=0
endif
//grafica segmenti - traciati solo da quando il vertice è confermato
if $zzLS[i]=1 then
drawsegment(barindex,$zzY[i],barindex+1,$zzY[i]) coloured ("red") style (line,2)
elsif $zzLS[i]=11 then
drawsegment(barindex,$zzY[i],barindex+1,$zzY[i]) coloured ("darkred") style (dottedline,2)
elsif $zzLS[i]=-1 then
drawsegment(barindex,$zzY[i],barindex+1,$zzY[i]) coloured ("green") style (line,2)
elsif $zzLS[i]=-11 then
drawsegment(barindex,$zzY[i],barindex+1,$zzY[i]) coloured ("darkgreen") style (dottedline,2)
endif
next
endif

return