Hey guys!
Since the release of PRT version 10.3 to IG (demo) this morning I´ve been having a blast backtesting “tick-by-tick” and checking out all the cool indicators that I have been drooling over for a couple of months now.
For example this indicator:
Fractals ZigZag
I dont´t really get how the code works but wouldn’t it be cool if we could build a strategy of it? It probably isn´t possible since Nicolas haven´t done it yet…
I tried to change a couple of things but didn´t really get it to work…
Anyway! If you have something to add, then please to it! 🙂
Take care!
//---external parameters
Defparam flatbefore =080000
Defparam flatafter= 173000
cp = 20

once lastpoint = 0

if high[cp] >= highest[2*cp+8](high) then
LH = 1
else
LH = 0
endif

if low[cp] <= lowest[2*cp+8](low)  then
LL = -1
else
LL = 0
endif

if LH = 1 then
TOPy = high[cp]
TOPx = barindex[cp]
endif

if LL = -1 then
BOTy = low[cp]
BOTx = barindex[cp]
endif

indicator1 = TOPx + TOPy
indicator2 = BOTx + BOTy

if LH>0 and (lastpoint=-1 or lastpoint=0) and indicator1 then
buy 1 contract at market
endif


if LL<0 and (lastpoint=1 or lastpoint=0) and indicator2 then
sell at market
endif
Building a strategy made of the last zigzag points of this indicator is of course possible. I called it “zigzag” because points are linked together,it has nothing to do with the real zigzag indicator of the platform.
The peaks and valleys of this indicator are made with fractals, but as you may already know it, they are drawn on the past before it takes time to validate the pattern.
I see an error in your code, if you want to be short at market, you should use SELLSHORT instead of SELL at line 39, but it may be correct as I don’t know the strategy behind your code.
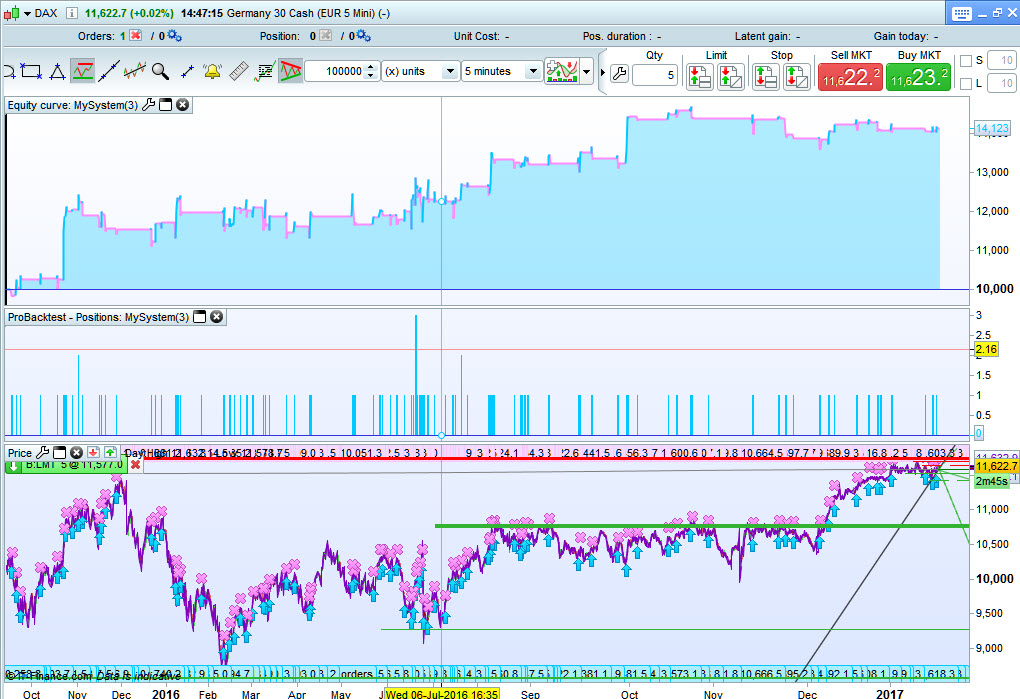
Works good over 10,000 units but not good over 100,00 units. I noted that, in the main, losses were made during ‘down periods’ so I added a few Indicators in Line 33 to reduce the number of Buys during down periods
Much improved curve attached for the Dax over 100,000 Units @5 mins.
(Insert PRT Code is missing (??) so apologies Mods)
Line 33
If LH>0 and (lastpoint=-1 or lastpoint=0) and indicator1 and RSI[14](close) > 42 and ADX[14] > 20 and Close > Supertrend[3,10] then
So keep on ‘having a blast & drooling‘ Joachim 🙂
GraHal
The strategy is accumulating order, is it wanted?
If the strategy is long only, it may have bad results in “down periods” as GraHal noticed 🙂
Hi there,
I am wondering if it is possible to derive a binary indicator from the fractal zigzag indicator of mention in this post?
In particular – if the last box on the screen is red – let the binary indicator = -1 ; and if the last box on the screen is green let the binary indicator = 1.
Such an indicator would only useful if the binary indicator transitioned at the exact time of change in the colour of the box last box. I know that this indicator can’t predict/look into the future – and that there is a lag between current price action and given box signals.
My attempt to do this was to hopefully do a difference in rate of change slope calc between TopX-lastX and TopY-lastY but they don’t seem to reference where needed? The slopes that I was seeing with this did not match the original indicator. So what I was trying to do wouldn’t work.
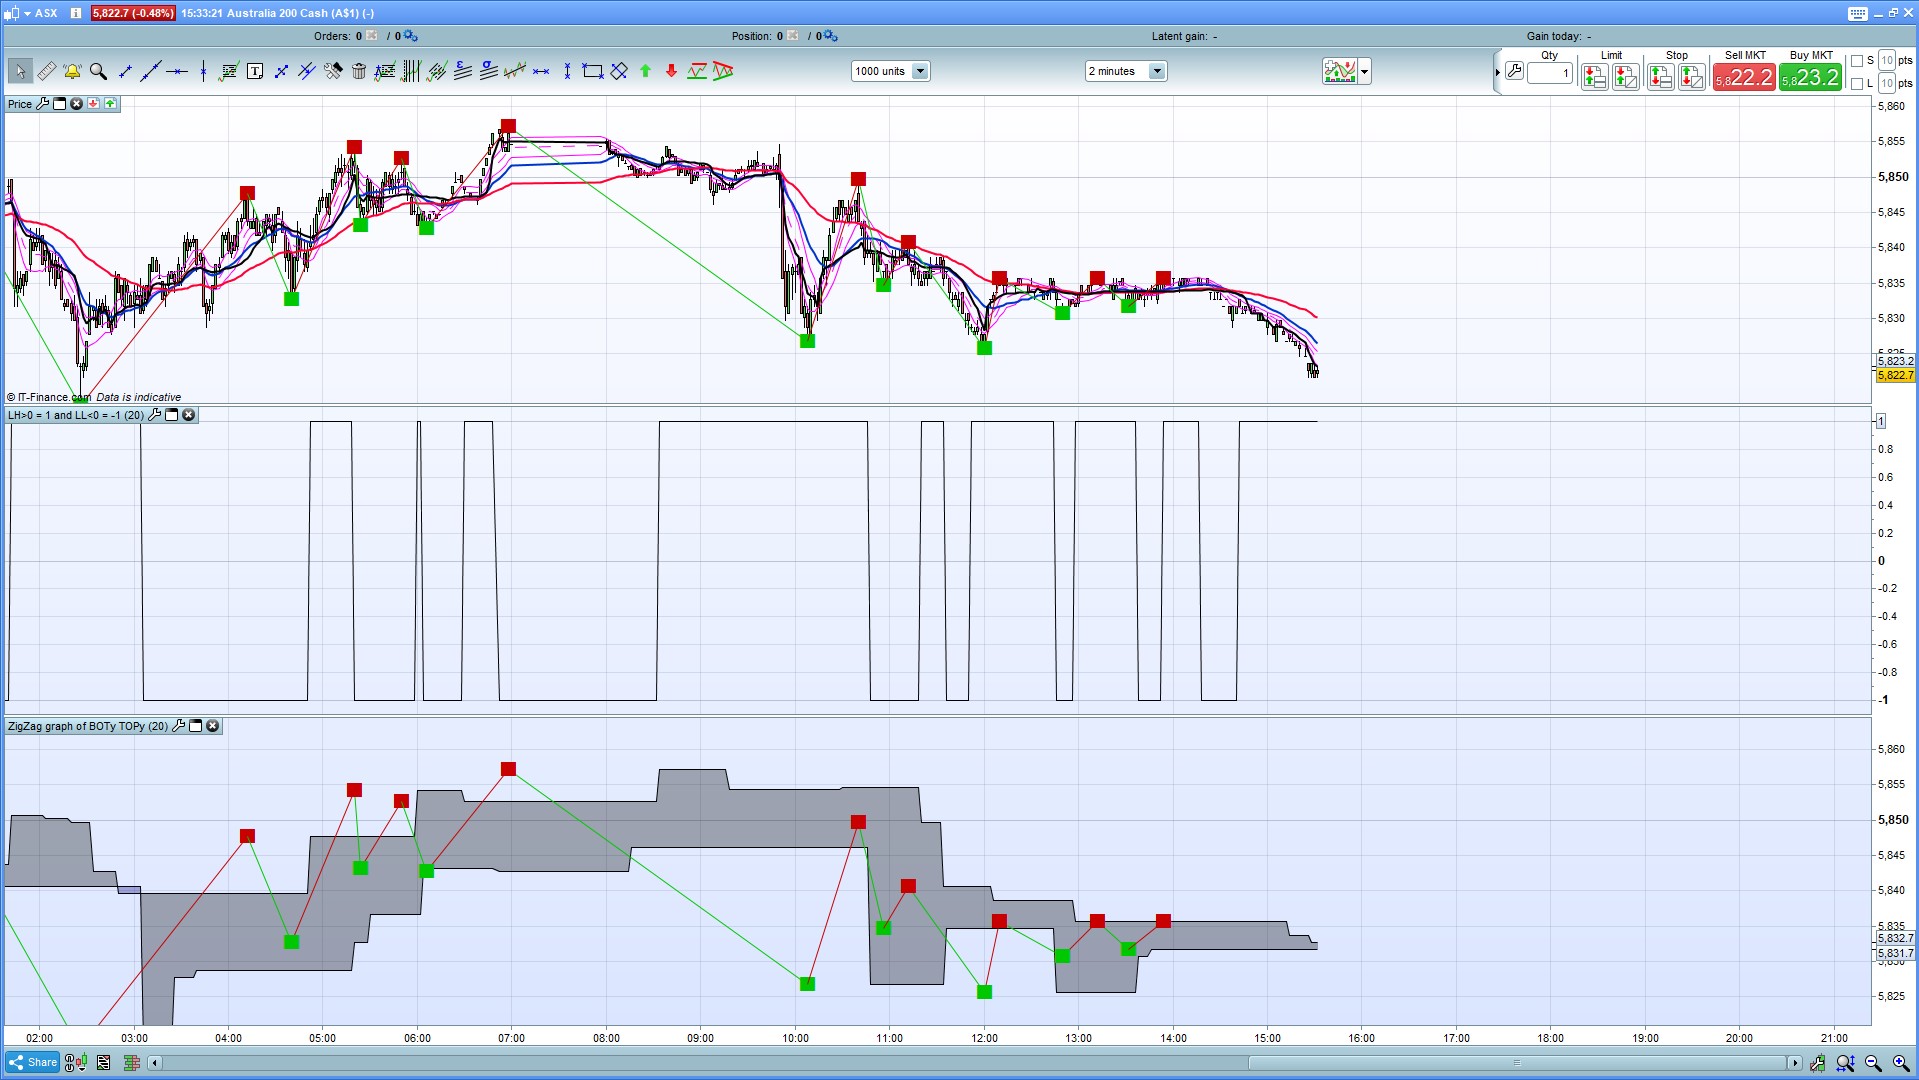
I tried to investigate this inability to reference by graphing/plotting slightly after when the drawsegment/drawtext lines were activated – see graph of LH>0 =1 and LL<0 = -1. This seemed to give signals that did not match up with the boxes in any way I could see.
I also then tried to graph the BOTy and TOPy in the indicator. There seems to be a correlation between when a box is formed and a flat bar of value at some time in the future? This didn’t seem to help me too much either.
In any case, I can’t get the above wanted indicator to work.
I’m only a month or so into using this software – so I may be missing a couple of things?
Any thoughts or suggestions would be much appreciated.
Many thanks,
Brett.
LH and LL are the signals to state when a new highest high or lowest low is forming. If you want to plot the signal only once when they are discovered, you can test LH with its previous value for instance:
if LH>0 and LH[1]=0 then
 drawtext("new HH",barindex,close)
endif
Hi Nicolas,
thank you for your reply.
I copied a portion of your suggestion onto different copies of onto the bottom of the indicator and graphed the result for LH and LL in separate graphs. I couldn’t get it to all work in one graph, but that’s another story…
Copied formulas used below in separate checking indicators.
if LL<0 and LL[1]=0 then
a = 1
else
a = 0
endif
RETURN a
and in a separate indicator
if LH>0 and LH[1]=0 then
a = 1
else
a = 0
endif
RETURN a
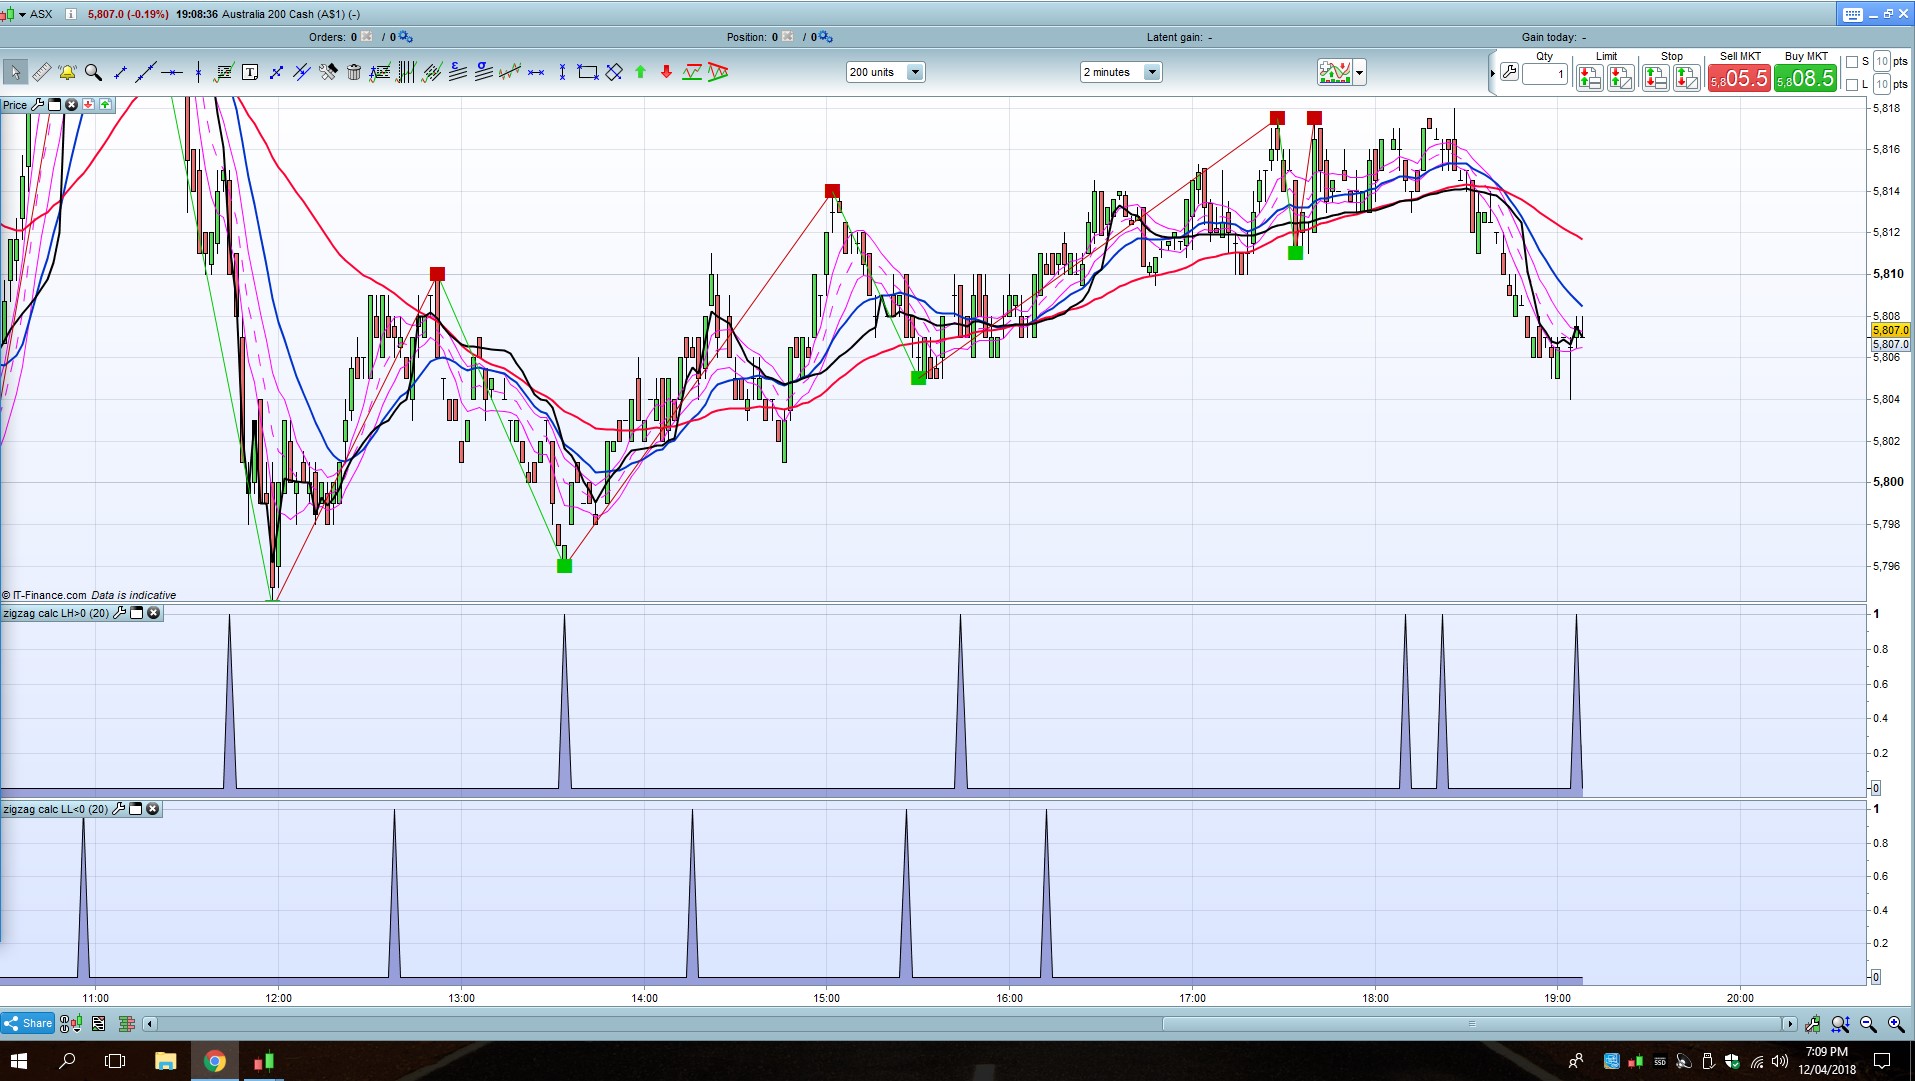
I attached a screengrab of the result of this.
For LH, I could see a relationship – though quite delayed at times – between red boxes forming (in most cases after the next green box had formed) and for LL – the relationship seemed a lot more shaky. Is this along the lines of what you thought it would look like??
To be more succinct in what I wrote above in my initial question – all I am looking for – is to be able to identify on what bar the last box formed, and what colour it was. The purpose of this being for backtesting etc.
I’m not sure if the triggers given here in the check graphs match the actual reality of the box changes?
Brett
Firstly, be sure to set the same “cp” period for the indicators that plot the boxes and the codes you made to identify signals (with spikes).
Secondy, the zigzag indicator I made, due to the nature of zigzag plotting successively highest high and lowest low, has conditions to only plot red and green boxes the same way. Understand that even if a new LL or LH is discovered, it doesnt mean that the indicator will display a new box, that’s why you spot differences between the twos.
“lastpoint” variable is the condition tested, like in the first code of this page:
if LH>0 and (lastpoint=–1 or lastpoint=0) and indicator1 then…
thanked this post
Thanks Nicolas. I had a bit more of a play around with it – I could create the yes/no indicator I was looking for – however the lag due to the high/low lookup time makes it not suitable for what I need. Thanks for your help and ideas with this.