Zigo
ZigoParticipant
Master
Hi, I want to share this new Indicator. I have posted it yesterday in the library, unfortunately the graph is not in the postof yesterday.
As you can see in the attachement the arrows are at the wright place. Will someone help build a backtest with this Indicator.
Thanks
Zigo
ZigoParticipant
Master
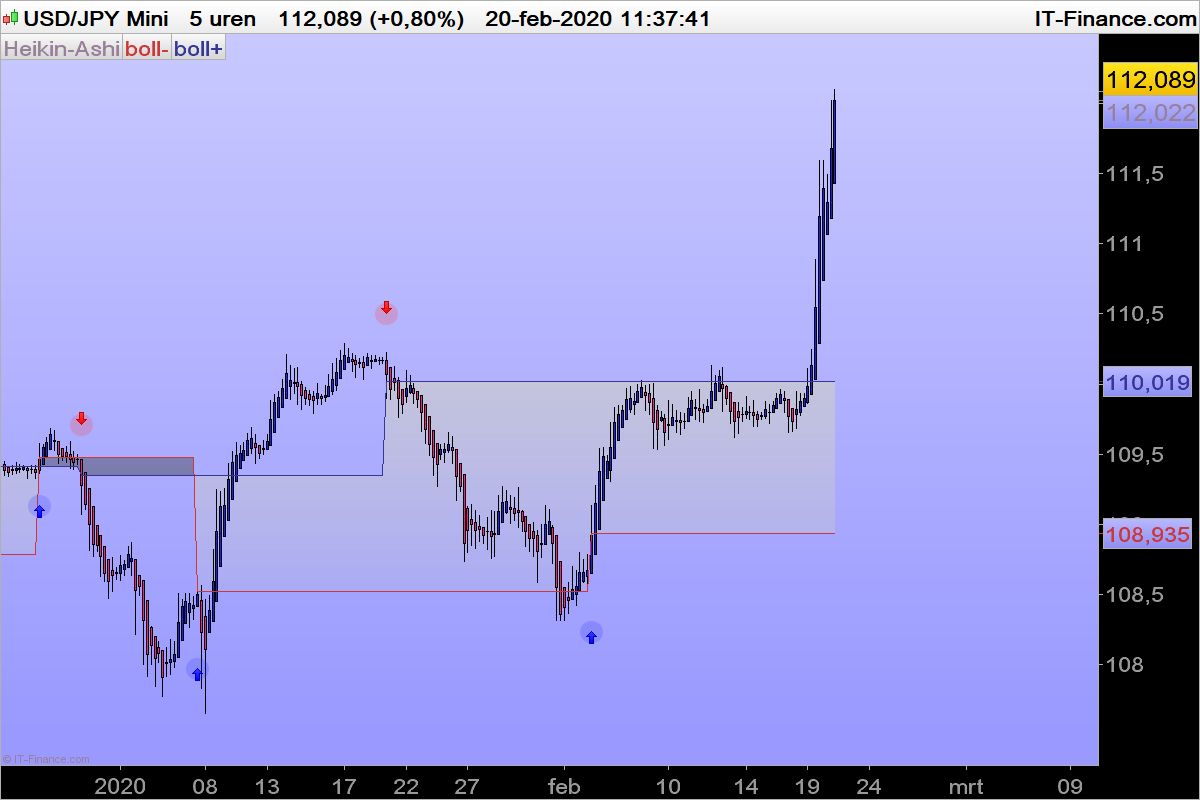
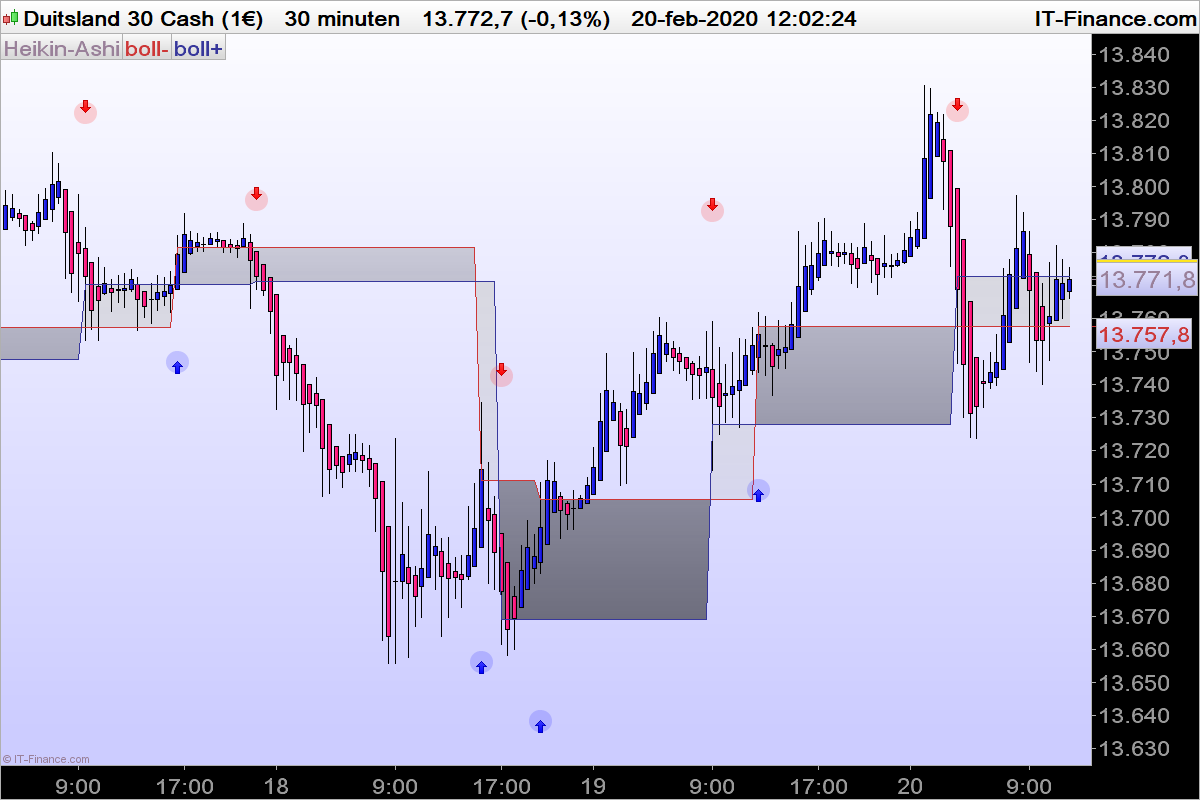
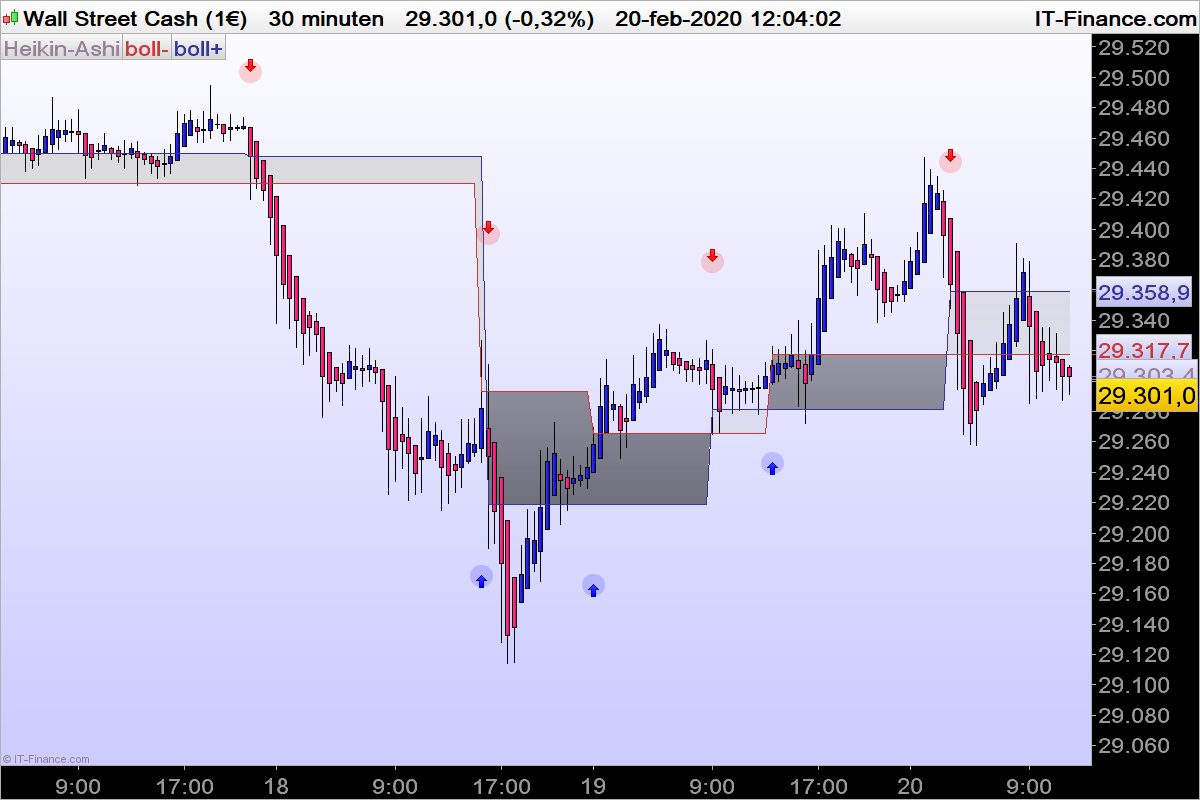
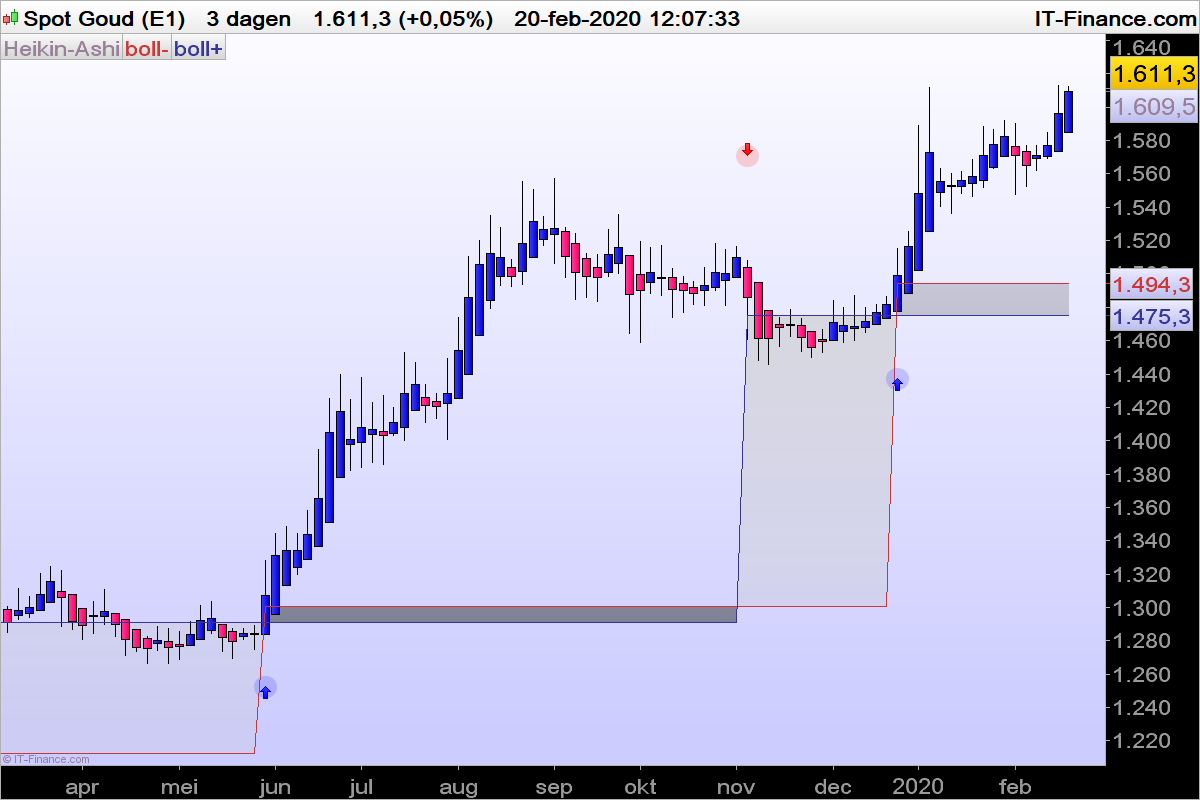
Indicator ZiBoll applied to other instruments.
You find the code by clicking on the page on mytopics (Zigo)
The indicator can be found here: ZiBoll Style Execution
ZigoParticipant
Master
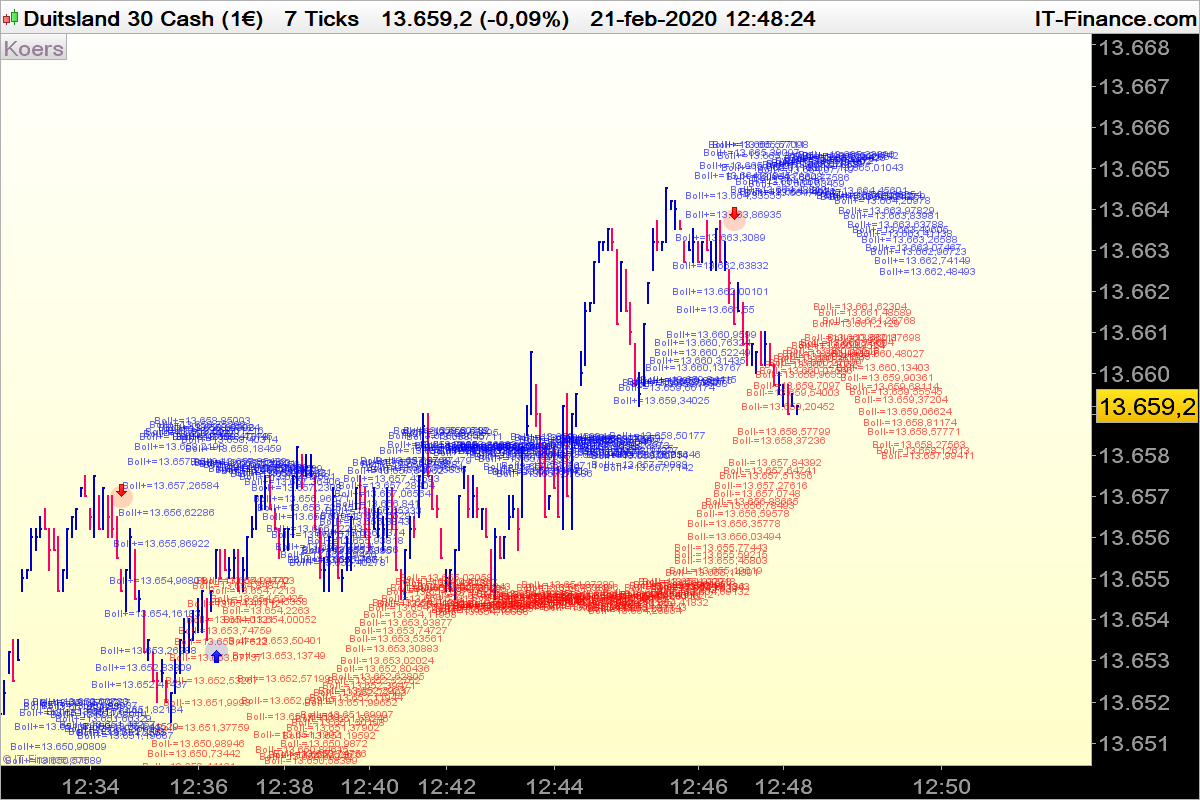
I will show you another vieuw of this new indicator.
As long as it is useful for trading, why not? 😉
ZigoParticipant
Master
@Nicolas, a 7 ticks graph is not meant for trading , but sometimes use a very low tickframe for learning the behaevings of an indicator, it’s only for studying.
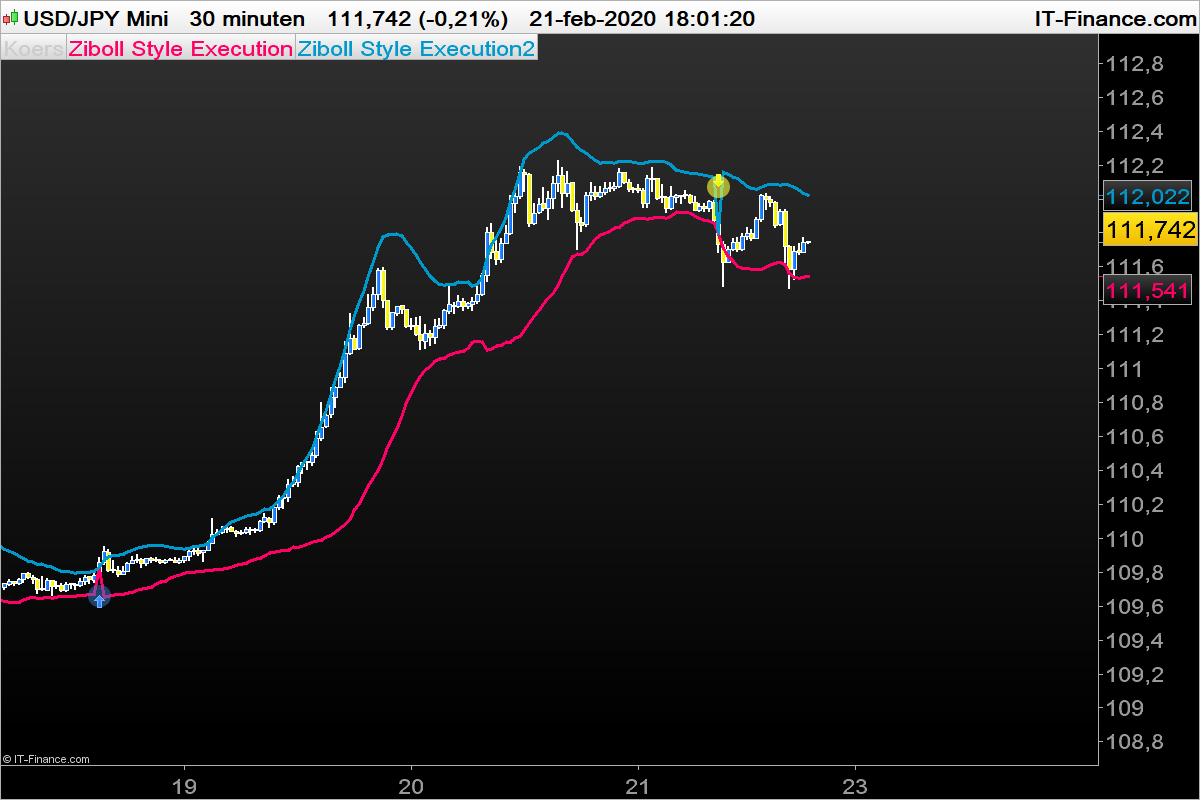
It can also like this (see attachement) and then its for trading.
What you have done with this indicator is very similar to an hi/lo activator technique. When the price breach the upper line it is a long trigger and vice-versa for a short order. Indeed, very powerful when price is not retracing or staying in a short price range.
ZigoParticipant
Master
@Nicolas
Indeed, what I did was calculate at first 2 WMA, calculated on the high and the low, and took the Boll+ from the High and took the Boll- from the low, and those are the trigger lines.
In a way very simple.
Regards
Carl
ZigoParticipant
Master
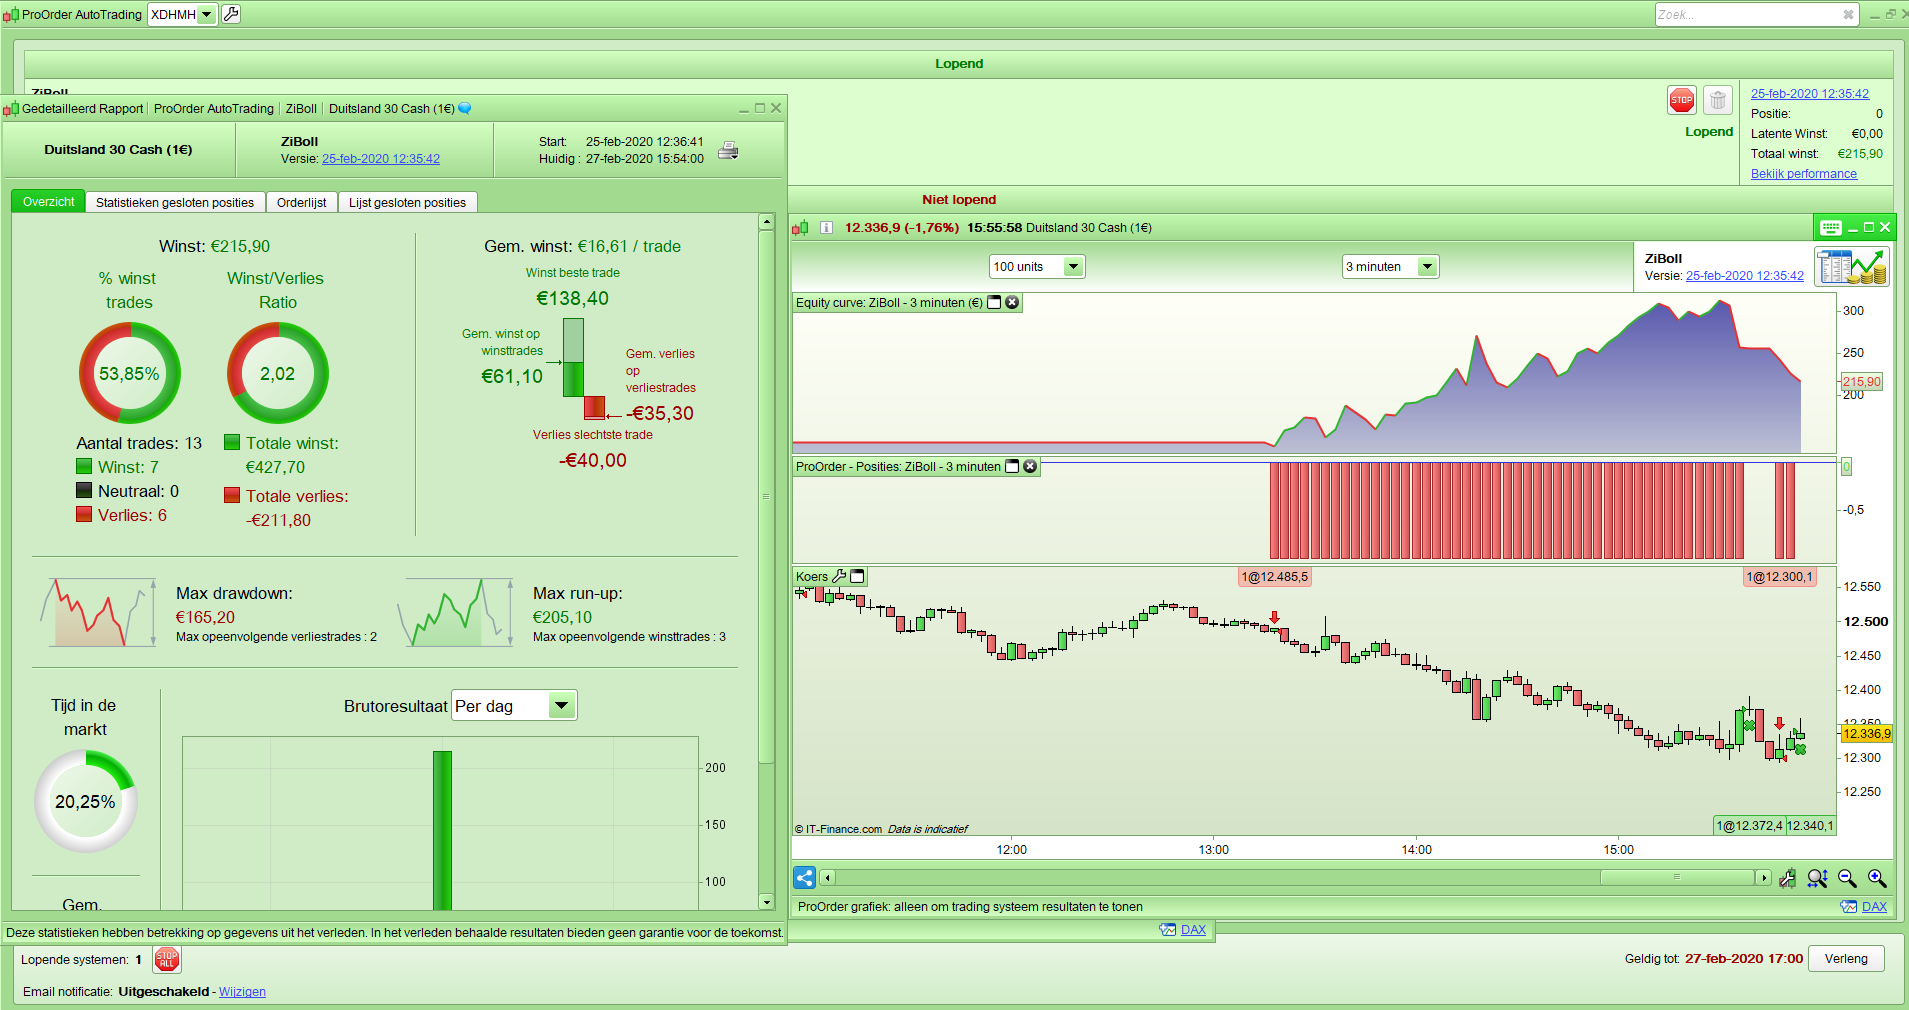
ZiBoll indicator in an automatic 3 min graph (Demo) , its still running till 17u00
ZigoParticipant
Master
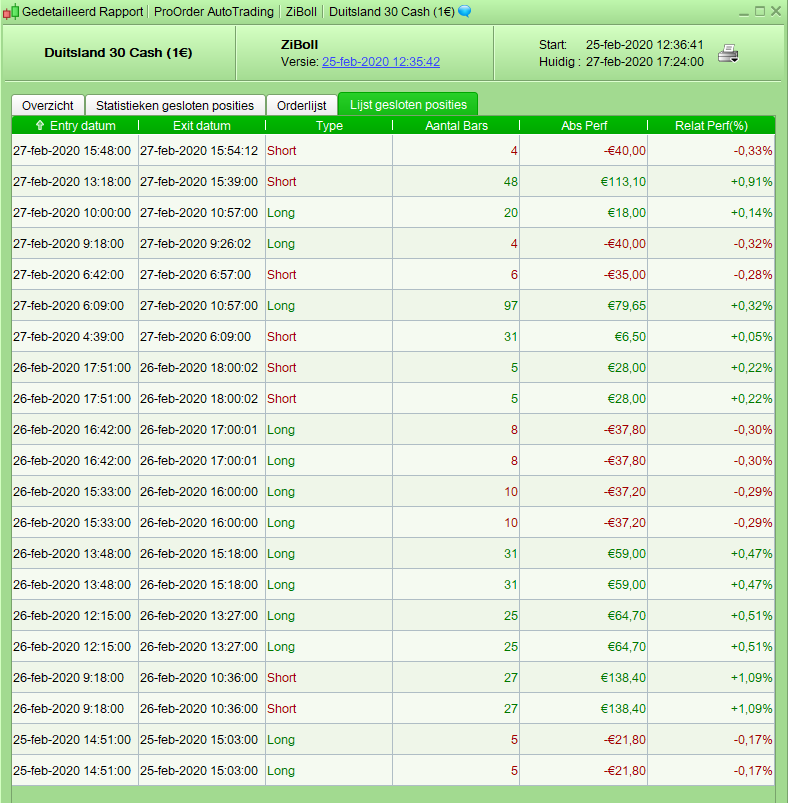
The automatic system is stopped.
The closed orders (see attachement)
Looks very interesting (new techniques!) @Zigo … might you share the System please or are you just teasing us? 🙂
ZigoParticipant
Master
@Grahal
No, I am not teasing You. but it is a first try to automatisation the ZiBol Indicator and I would appreciate if you help me to perpect the Indicator.
Below you can see what I already have:
// Settings
Defparam cumulateorders=false
Defparam flatbefore =080000
Defparam flatafter =180000

p=11
s=0.5

// Computes the basic moving average from the low and from the high

BollMALow = WeightedAverage[p](Low)
BollMAHigh= Weightedaverage[p](High)

// Computes the Standard Deviation (You can also take fx for colculate the "StdSTD[20](close)")


//Compute the Special Bollinger Bands.
//Instead of two times the STDDEV we calculate 0.5 times the STDDEV , and subtract it from the LowMA
//For the upper value we take 0.5 times the STDDEV and add it to the HighMA
BupH = BollMaHigh + (s * STD[p](high)) //Boll+
BdnL = BollMALow - (s * STD[p](low))//Boll-

//Compare the results with the close of each candle
//Lower than the close its -1
//Higher than the close its +1
//Between the two values equals the previous values


if close < BdnL then
ZHL=-1
elsif close> Buph then
ZHL=1
else
ZHL=ZHL[1]
endif

//First check the trend by means of the regressionslope

zbsl=sin(LinearRegressionSlope[p](bdnl)+LinearRegressionSlope[p](buph))/2

//The Boolean value of ZHL

if zbsl > 0 then
if ZHL crosses over 0 then
buy 1 contract at market
endif
elsif zbsl < 0 then
if zhl crosses under 0 then
sellshort 1 contract at market
endif
endif

if longonmarket then
if zhl crosses under 0 then
sell at market
endif
elsif shortonmarket then
if zhl > 0 then
exitshort at market
endif
endif

// Stops en targets (No Target)
set stop ploss 40

//No defined target
What timeframe and instrument are the settings intended for?
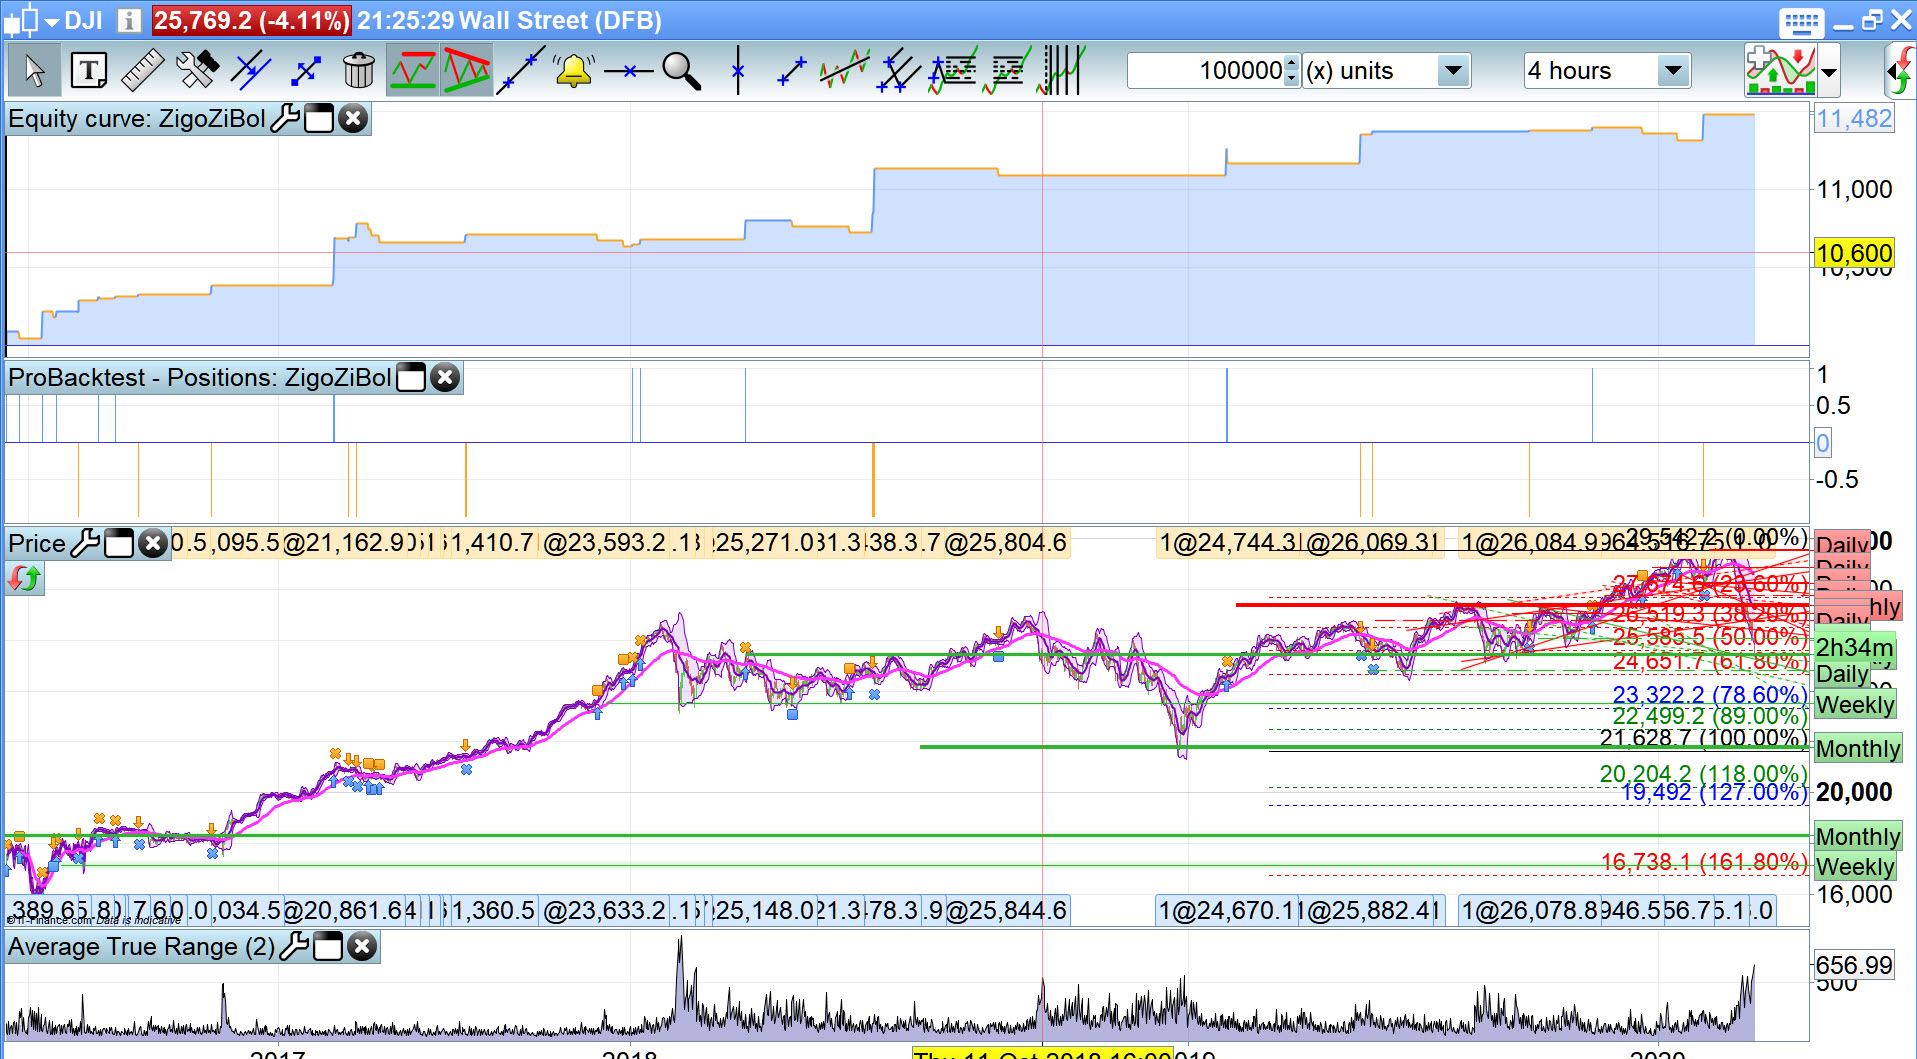
Looks good on the DJI H4 TF … see attached.
If I come up with any improvements, I’ll report back.
Thank You
ZigoParticipant
Master
@GraHal
I don’t know yet, I didn’t testeted yet, because there will be a version 2.0 soon.
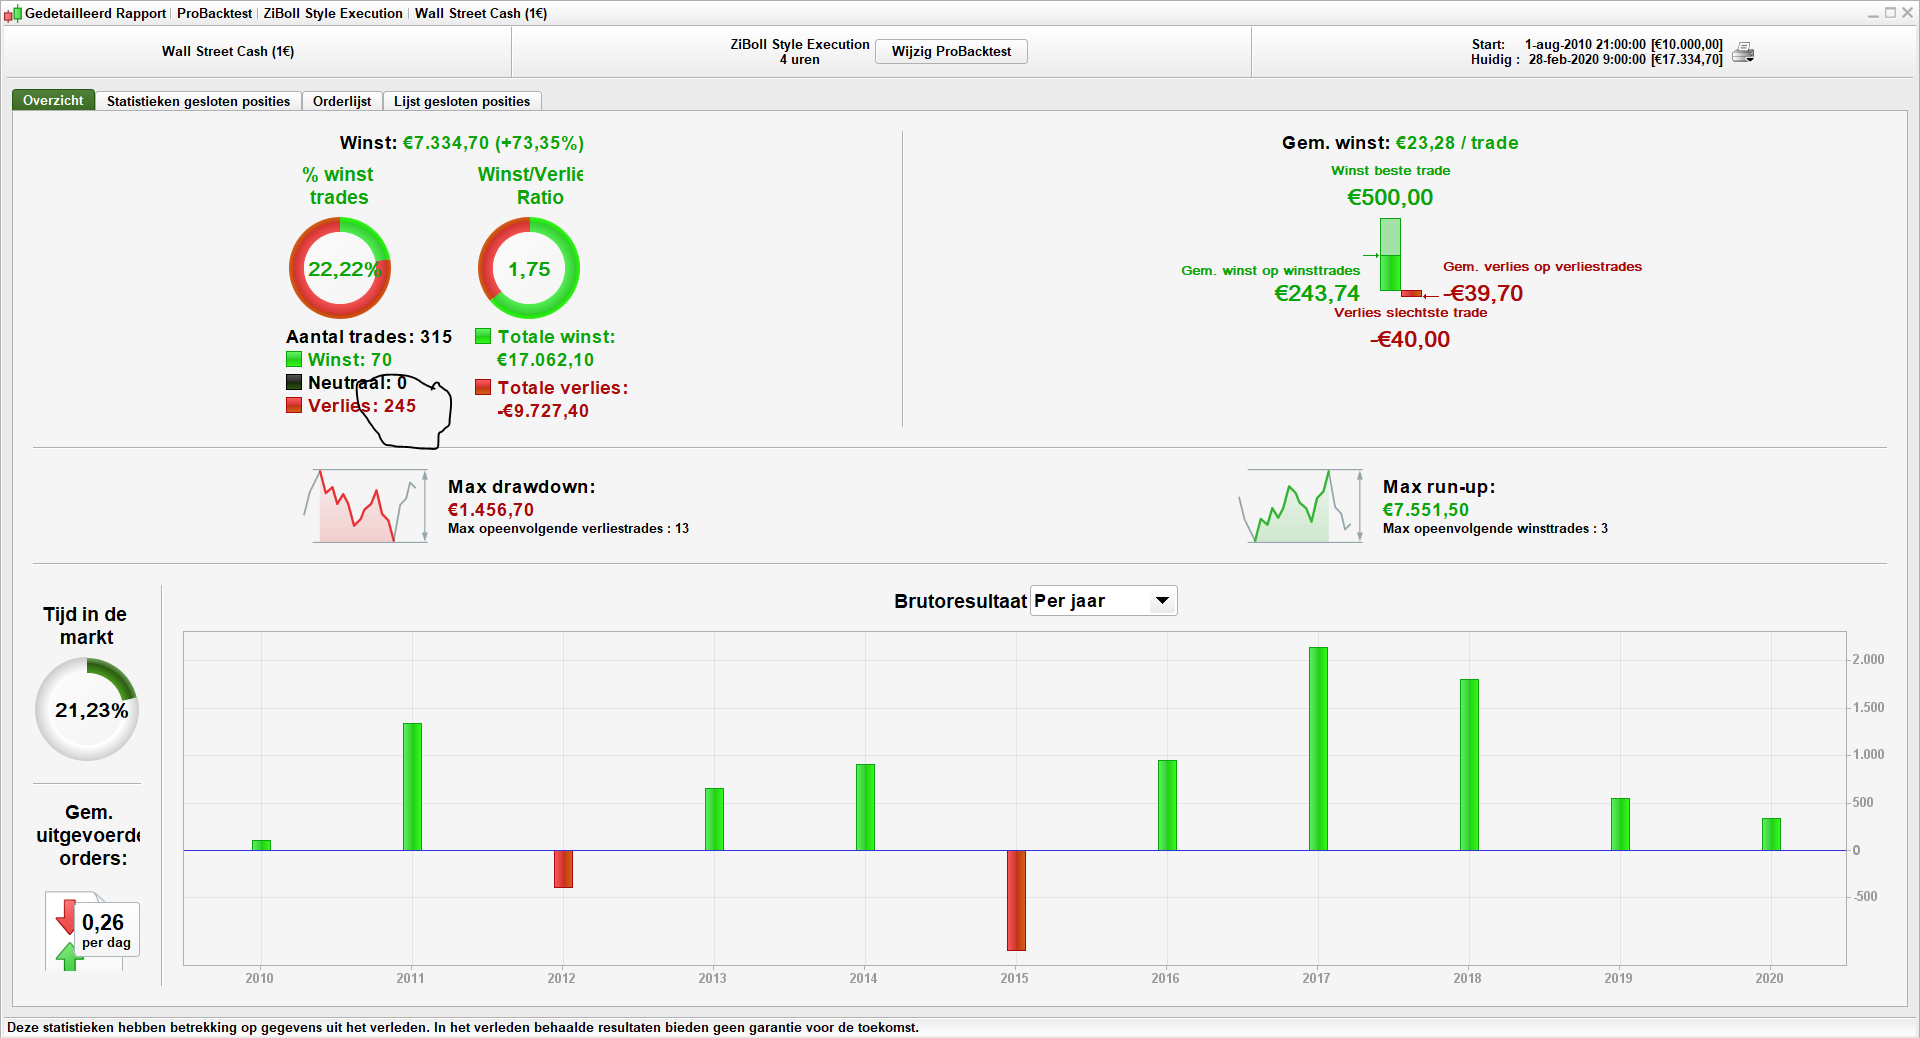
The results are different from yours. I have to much losing trades. Do you have any suggestion?
I have to much losing trades. Do you have any suggestion?
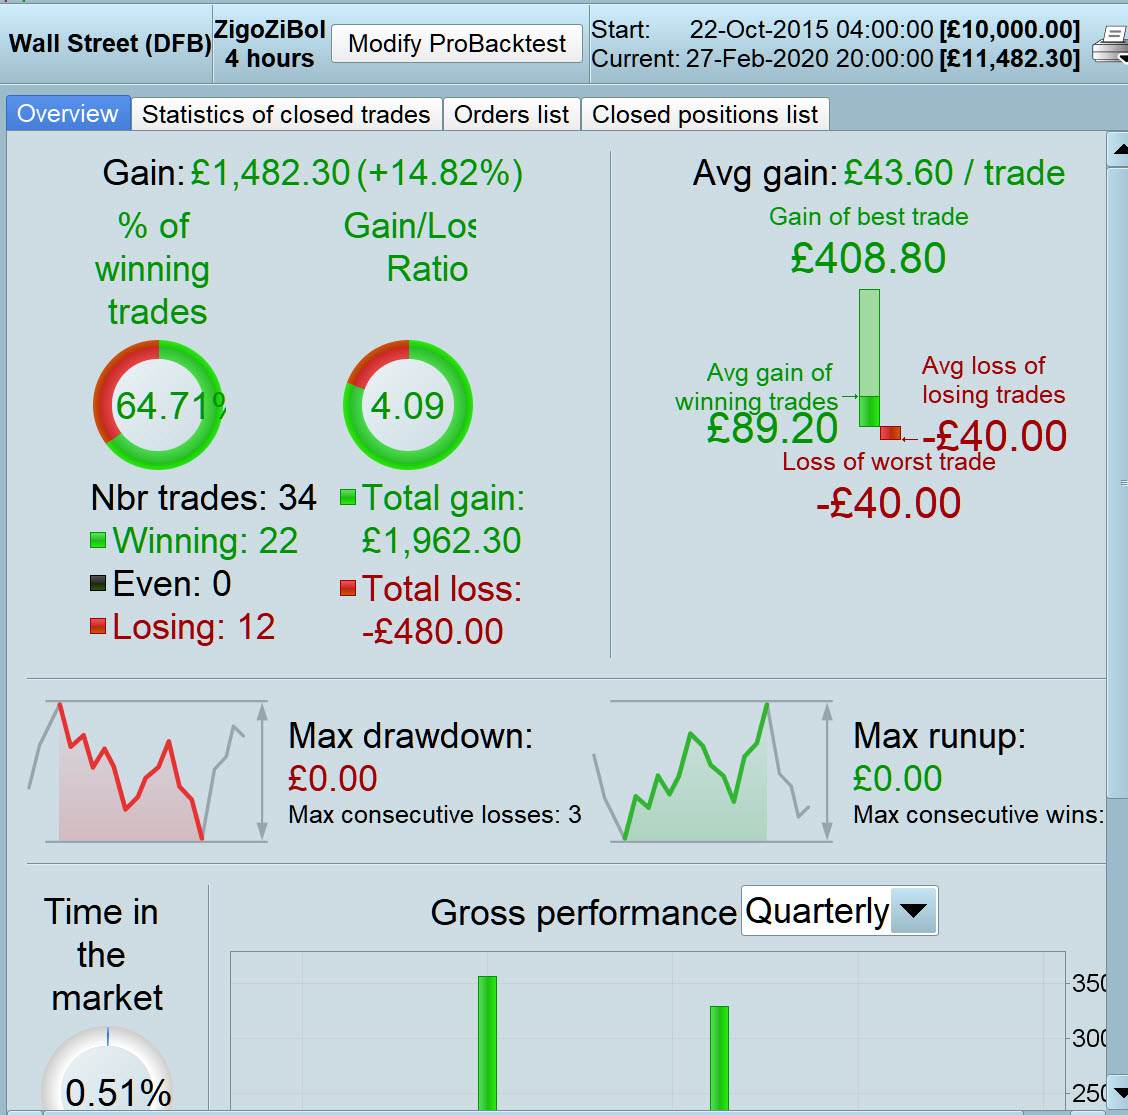
You have tested over 200k bars to 2010. I tested over 100k bars over to 2015.
Even so you seem to have loads more trades … you – 315 against my 34 … weird??
Did you change any variable values from your posted version (as I didn’t make any changes for my 4 hour results).
Hey if you agree to below then Mods will move the Topic and we may get more folk joining us to do a few tweaks?
Mods
Please move this Topic to the Systems Forum and re-title as below …
ZiBoll Indicator System