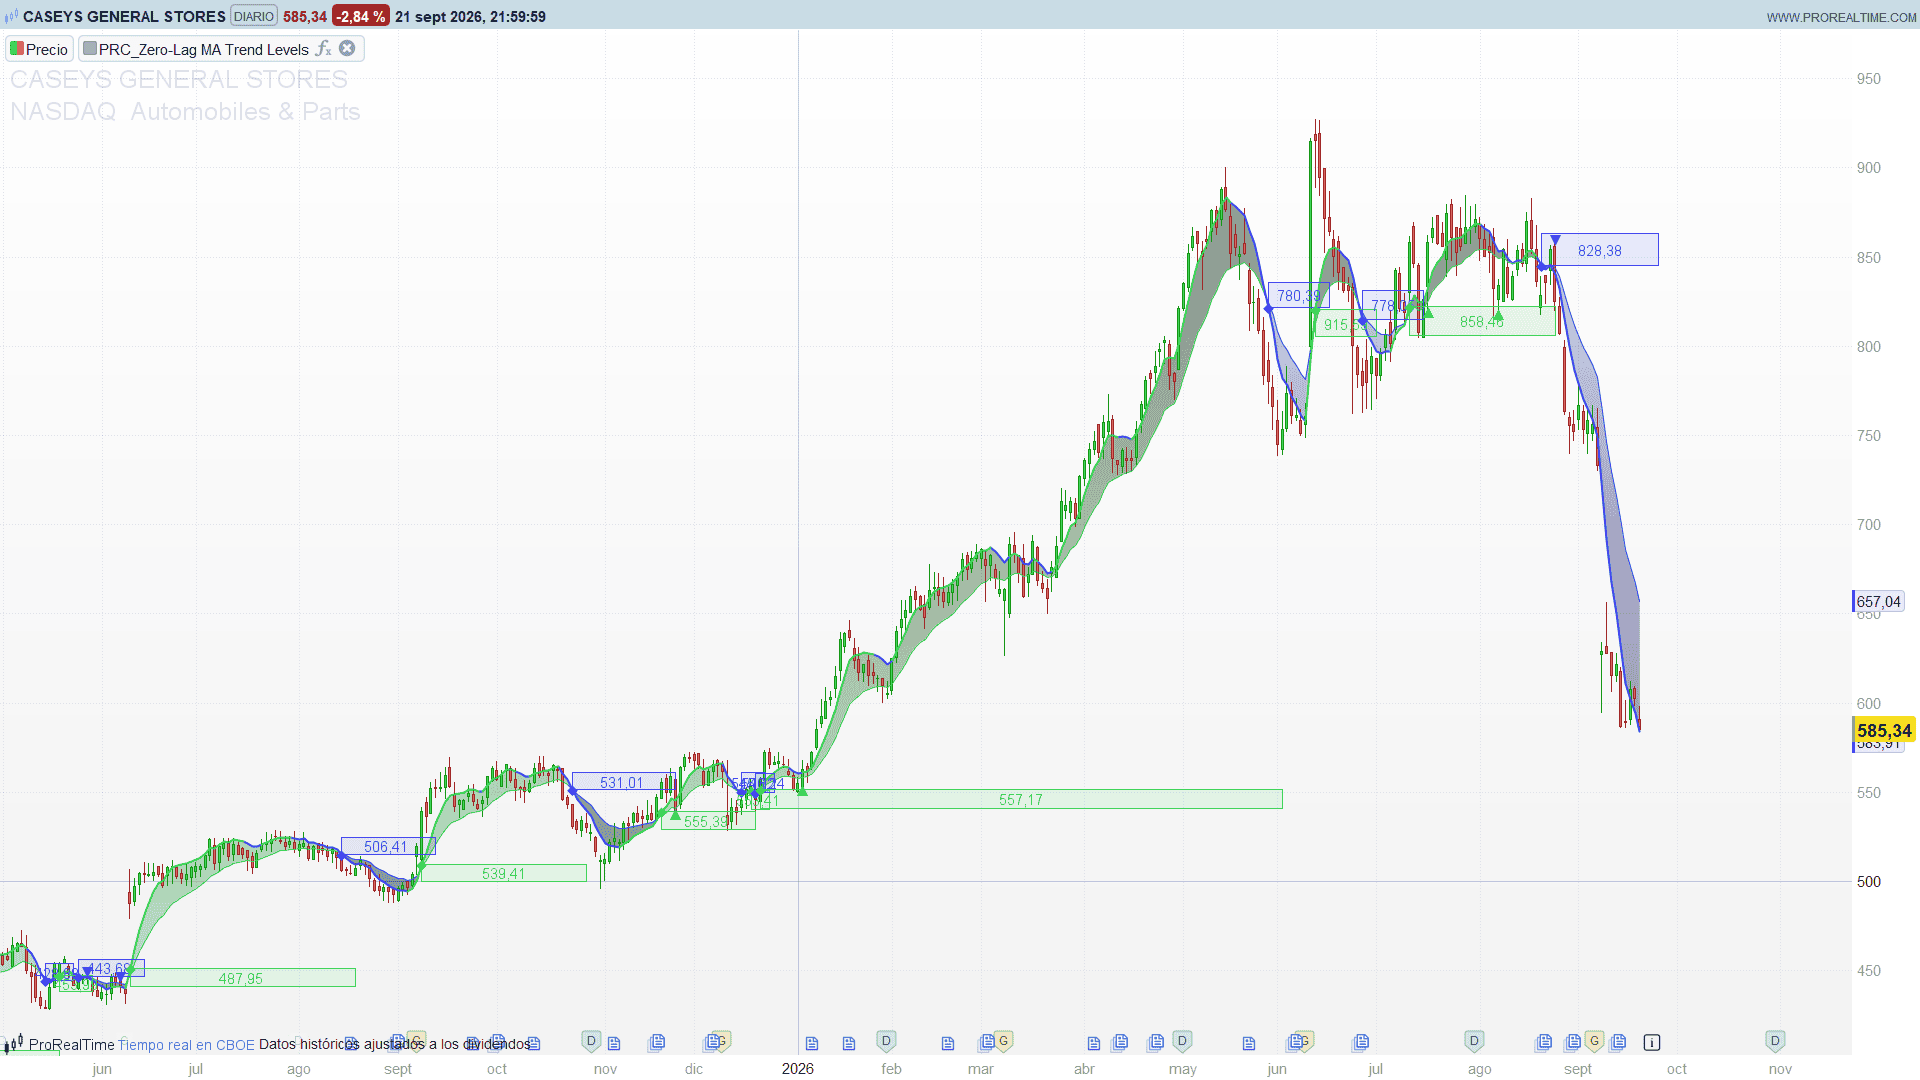
Here you have:
//-------------------------------------//
//PRC_Zero-Lag MA Trend Levels
//version = 0
//22.09.26
//Iván González @ www.prorealcode.com
//Author: ChartPrime
//Sharing ProRealTime knowledge
//-------------------------------------//
DEFPARAM drawonlastbaronly = true
//-------------------------------------//
// Inputs
//-------------------------------------//
length   = 15   // Length of both moving averages
showLevl = 1    // 1 = draw the trend level boxes, 0 = hide them
maxBox   = 40   // How many past levels are kept on the chart
maxMark  = 60   // How many retest marks are kept on the chart

// Bullish / bearish colours
upR = 48
upG = 212
upB = 83
dnR = 64
dnG = 67
dnB = 241

//-------------------------------------//
// Zero-Lag MA
// The correction mirrors price across its own EMA, so the second
// EMA lands on price instead of trailing behind it.
//-------------------------------------//
src        = customclose
emaValue   = average[length,1](src)
correction = src + (src - emaValue)
zlma       = average[length,1](correction)

atrV = averagetruerange[200](close)

signalUp = zlma crosses over emaValue
signalDn = zlma crosses under emaValue

IF signalUp OR signalDn THEN
   chkSig = 1
ELSE
   chkSig = 0
ENDIF

//-------------------------------------//
// Colours
//-------------------------------------//
// ZLMA is coloured by its own slope over the last 3 bars. When it is
// flat the original leaves a gap; here the last colour is kept so the
// line stays continuous.
ONCE zr = upR
ONCE zg = upG
ONCE zb = upB

IF zlma > zlma[3] THEN
   zr = upR
   zg = upG
   zb = upB
ELSIF zlma < zlma[3] THEN
   zr = dnR
   zg = dnG
   zb = dnB
ENDIF

// The EMA and the ribbon are coloured by which side of the ZLMA it sits on
IF emaValue < zlma THEN
   er = upR
   eg = upG
   eb = upB
ELSE
   er = dnR
   eg = dnG
   eb = dnB
ENDIF

COLORBETWEEN(zlma, emaValue, er, eg, eb, 51)

//-------------------------------------//
// Trend levels
// A box is opened on every crossover and keeps extending 4 bars to the
// right until the next signal opens a new one. Boxes are stored instead
// of drawn on the spot, so past levels survive the repaint.
//-------------------------------------//
ONCE nBox = 0
ONCE nMark = 0

IF showLevl = 1 AND chkSig = 1 THEN
   // freeze the box that was still alive: its last extension was one bar ago
   IF nBox > 0 THEN
      $bxX2[nBox] = barindex + 3
   ENDIF

   WHILE nBox >= maxBox DO
      FOR i = 1 TO nBox - 1 DO
         $bxX1[i]  = $bxX1[i+1]
         $bxX2[i]  = $bxX2[i+1]
         $bxTop[i] = $bxTop[i+1]
         $bxBot[i] = $bxBot[i+1]
         $bxDir[i] = $bxDir[i+1]
         $bxPx[i]  = $bxPx[i+1]
      NEXT
      nBox = nBox - 1
   WEND

   nBox = nBox + 1
   $bxX1[nBox] = barindex
   $bxX2[nBox] = barindex + 4
   $bxPx[nBox] = round(close * 100) / 100

   IF signalUp THEN
      // support zone hanging below the ZLMA
      $bxTop[nBox] = zlma
      $bxBot[nBox] = zlma - atrV
      $bxDir[nBox] = 1
   ELSE
      // resistance zone sitting above the ZLMA
      $bxTop[nBox] = zlma + atrV
      $bxBot[nBox] = zlma
      $bxDir[nBox] = -1
   ENDIF
ENDIF

// Edges of the box that is currently alive
IF nBox > 0 THEN
   liveTop = $bxTop[nBox]
   liveBot = $bxBot[nBox]
ENDIF

//-------------------------------------//
// Retest marks
// Price failing back through the live zone, once the signal bar and the
// one right after it are out of the way.
//-------------------------------------//
IF showLevl = 1 AND nBox > 0 AND chkSig = 0 AND chkSig[1] = 0 THEN
   mkHit = 0

   IF high crosses under liveBot AND emaValue > zlma THEN
      mkHit = -1
      mkY = high[1]
   ELSIF low crosses over liveTop AND emaValue < zlma THEN
      mkHit = 1
      mkY = low[1]
   ENDIF

   IF mkHit <> 0 THEN
      WHILE nMark >= maxMark DO
         FOR i = 1 TO nMark - 1 DO
            $mkX[i]   = $mkX[i+1]
            $mkY[i]   = $mkY[i+1]
            $mkDir[i] = $mkDir[i+1]
         NEXT
         nMark = nMark - 1
      WEND
      nMark = nMark + 1
      $mkX[nMark]   = barindex - 1
      $mkY[nMark]   = mkY
      $mkDir[nMark] = mkHit
   ENDIF
ENDIF

//-------------------------------------//
// Drawing
//-------------------------------------//
IF islastbarupdate THEN

   IF nBox > 0 THEN
      FOR i = 1 TO nBox DO
         IF i = nBox THEN
            xr = barindex + 4   // the live box is still extending
         ELSE
            xr = $bxX2[i]
         ENDIF

         IF $bxDir[i] = 1 THEN
            br = upR
            bg = upG
            bb = upB
            dY = $bxTop[i]
         ELSE
            br = dnR
            bg = dnG
            bb = dnB
            dY = $bxBot[i]
         ENDIF

         DRAWRECTANGLE($bxX1[i], $bxTop[i], xr, $bxBot[i]) COLOURED(br,bg,bb,255) FILLCOLOR(br,bg,bb,26)

         // Price tag as plain text: a box measured in bars cannot hold a
         // label measured in pixels once you zoom out.
         pxTag = $bxPx[i]
         xTag  = round(($bxX1[i] + xr) / 2)
         yTag  = ($bxTop[i] + $bxBot[i]) / 2
         DRAWTEXT("#pxTag#", xTag, yTag) COLOURED(br,bg,bb,255)

         // Signal diamond, on the ZLMA side of the zone
         DRAWTEXT("◆", $bxX1[i], dY) COLOURED(br,bg,bb,255)
      NEXT
   ENDIF

   IF nMark > 0 THEN
      FOR i = 1 TO nMark DO
         IF $mkDir[i] = 1 THEN
            DRAWTEXT("▲", $mkX[i], $mkY[i]) COLOURED(upR,upG,upB,255)
         ELSE
            DRAWTEXT("▼", $mkX[i], $mkY[i]) COLOURED(dnR,dnG,dnB,255)
         ENDIF
      NEXT
   ENDIF

ENDIF

//-------------------------------------//
RETURN zlma AS "Zero-Lag MA" STYLE(line,2) COLOURED(zr,zg,zb), emaValue AS "EMA" STYLE(line,1) COLOURED(er,eg,eb)