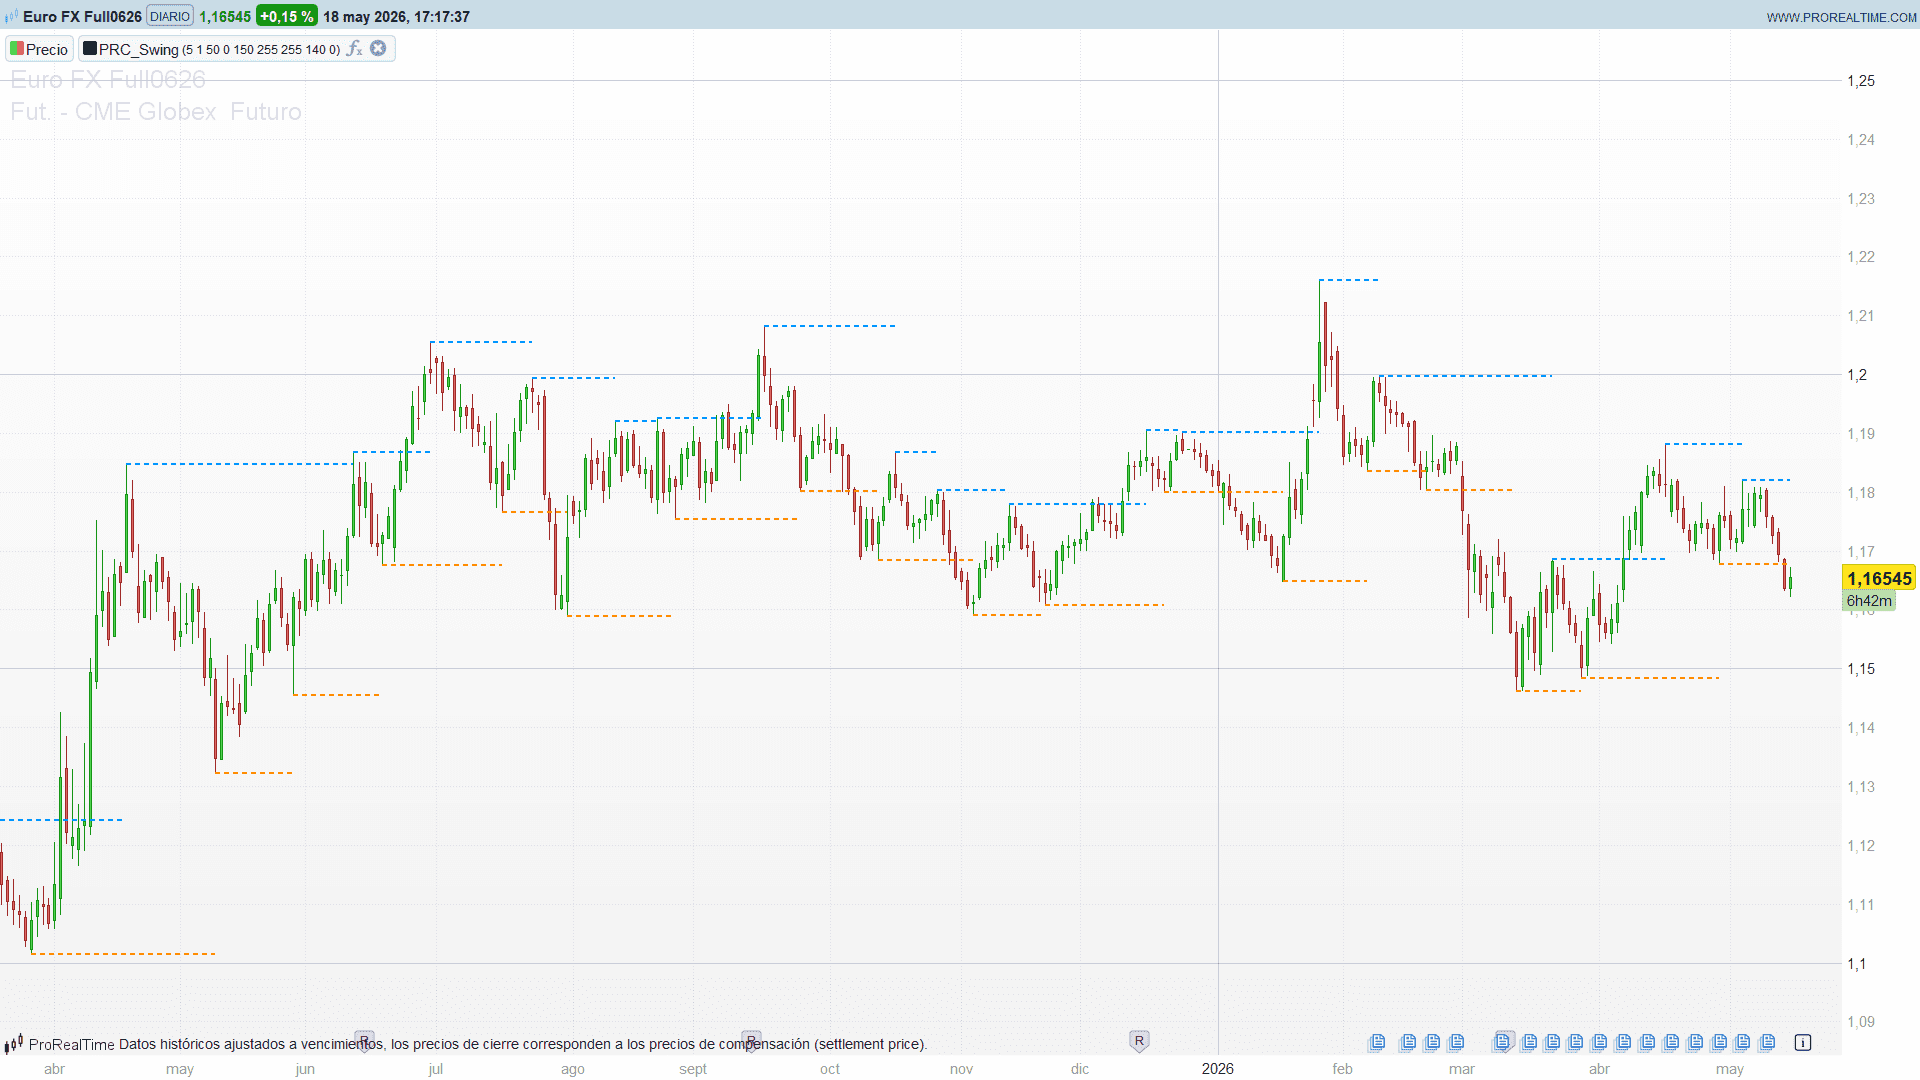
The Swing indicator is a clean, purely visual structure tool: it detects swing highs and swing lows on the chart and draws a horizontal line from each swing that extends forward until the next swing of the same type appears. The result is a “staircase” of resistance levels (swing highs) and support levels (swing lows) that makes the market’s structure immediately readable at a glance.
It is a faithful ProRealTime port of the well-known NinjaTrader Swing indicator, requested by a ProRealTime user through the community. A single strength parameter controls how significant a swing has to be, and the colour and line style are fully configurable.
Key Features at a Glance
| Feature | Behaviour |

|---|---|

| Swing detection | Centred pivot, strength bars left and right |

| Swing-high lines | Horizontal level extended to the next swing high |

| Swing-low lines | Horizontal level extended to the next swing low |

| Strength | Single parameter, fully configurable |

| Colour | Independent RGB for highs and lows |

| Line style | Dotted / solid / dashed, switchable |

| Performance | Drawn once on the last bar, last maxLines of each type |
Indicator Configuration
| Parameter | Default | Description |
|---|---|---|
| strength | 5 | Bars to the left and right of the swing point |
| lineStyle | 1 | 1 = dotted, 2 = solid, 3 = dashed |
| maxLines | 50 | Recent swing lines of each type to draw |
| upR/upG/upB | 0/150/255 | Swing-high colour (RGB) |
| dnR/dnG/dnB | 255/140/0 | Swing-low colour (RGB) |
Code
//--------------------------------------------------------//
//PRC_Swing
//version = 0
//18.05.26
//Iván González @ www.prorealcode.com
//Sharing ProRealTime knowledge
//--------------------------------------------------------//
defparam drawonlastbaronly = true
//-----Inputs---------------------------------------------//
strength  = 5     // bars to the left AND right of the swing point
lineStyle = 1     // 1 = dotted, 2 = solid, 3 = dashed
maxLines  = 50    // recent swing lines of each type to draw
upR = 0
upG = 150
upB = 255         // swing-high colour (RGB)
dnR = 255
dnG = 140
dnB = 0           // swing-low colour (RGB)
//--------------------------------------------------------//
//-----State----------------------------------------------//
ONCE nSH = 0
ONCE nSL = 0
//--------------------------------------------------------//
//-----Swing detection (confirmed "strength" bars ago)----//
IF barindex > 2*strength THEN
   IF high[strength] = highest[2*strength+1](high) THEN
      $shX[nSH] = barindex[strength]
      $shY[nSH] = high[strength]
      nSH = nSH + 1
   ENDIF
   IF low[strength] = lowest[2*strength+1](low) THEN
      $slX[nSL] = barindex[strength]
      $slY[nSL] = low[strength]
      nSL = nSL + 1
   ENDIF
ENDIF
//--------------------------------------------------------//
//-----Drawing (only on the last bar, no stacking)--------//
IF ISLASTBARUPDATE THEN

   startH = max(0, nSH - maxLines)
   FOR i = startH TO nSH - 1 DO
      x1 = $shX[i]
      y1 = $shY[i]
      IF i < nSH - 1 THEN
         x2 = $shX[i+1]
      ELSE
         x2 = barindex
      ENDIF
      IF lineStyle = 2 THEN
         DRAWSEGMENT(x1, y1, x2, y1) STYLE(line, 2) COLOURED(upR, upG, upB)
      ELSIF lineStyle = 3 THEN
         DRAWSEGMENT(x1, y1, x2, y1) STYLE(dottedline2, 2) COLOURED(upR, upG, upB)
      ELSE
         DRAWSEGMENT(x1, y1, x2, y1) STYLE(dottedline, 2) COLOURED(upR, upG, upB)
      ENDIF
   NEXT

   startL = max(0, nSL - maxLines)
   FOR k = startL TO nSL - 1 DO
      a1 = $slX[k]
      b1 = $slY[k]
      IF k < nSL - 1 THEN
         a2 = $slX[k+1]
      ELSE
         a2 = barindex
      ENDIF
      IF lineStyle = 2 THEN
         DRAWSEGMENT(a1, b1, a2, b1) STYLE(line, 2) COLOURED(dnR, dnG, dnB)
      ELSIF lineStyle = 3 THEN
         DRAWSEGMENT(a1, b1, a2, b1) STYLE(dottedline2, 2) COLOURED(dnR, dnG, dnB)
      ELSE
         DRAWSEGMENT(a1, b1, a2, b1) STYLE(dottedline, 2) COLOURED(dnR, dnG, dnB)
      ENDIF
   NEXT

ENDIF
//--------------------------------------------------------//
RETURN