I am posting my version of the code to calculate Z-Score and manage it, in order to embed it into your strategies. It also comes with a simple test strategy.
What is Z-score?
Z-score measures the distance between the mean of some set of the statistical results and the given observation.
A trader might suspect a dependency if he or she experiences a run of several consecutive profitable trades, or a run of several consecutive unprofitable trades. “Obviously, there was some kind of dependency or serial correlation among your trades [in this case], where winners were followed by winners and losers were followed by more losers,” Thomas Stridsman wrote in the April 1998 issue of Futures. “If this happens again, you’ll want to exploit the good times and perhaps avoid trading altogether in bad times.”
In Forex systems, traders are interested in Z-score not of a trade’s return (profit/loss size) but rather in a Z-score of the outcome — was it a profitable one or a losing one?
Z-score, calculated using winning and losing streaks, measures the dependence between the outcome of the previous position and the outcome of the next position.
If we consider profitable positions as positive results and losing positions as negative statistical results, counting the total number of all wins, losses, overall trades, as well as the number of win and loss streaks, we can calculate a Z-score for a given
trading strategy.
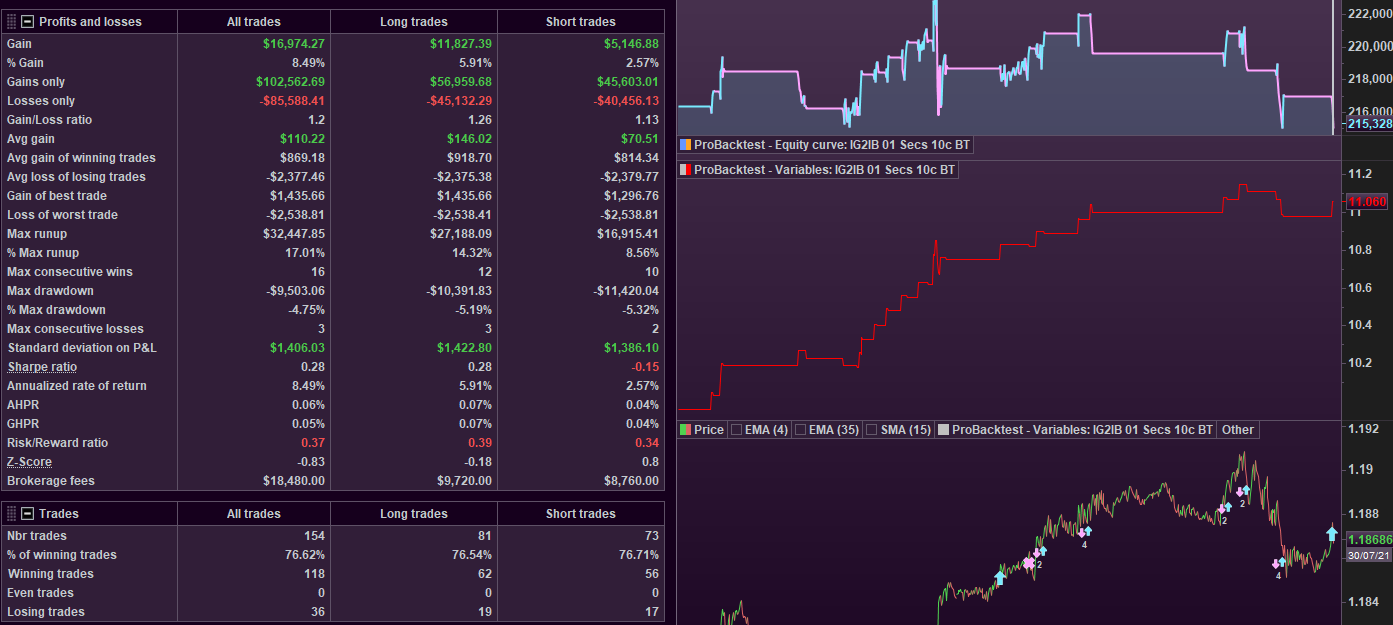
Usually, Z-score fluctuates between -3 to +3, but sometimes, can go above and below these “limits”. A Z-score value of 0 means that we are dealing with completely random results.
Each Z-score value has also a probability of dependence (P) associated with it, which informs us of how probable dependence between the trades is. P values below -2 and above +2 have high (>95%) probability of dependence between trades:
- a positive Z-score means that:
– a profitable position is likely to be followed by a losing one
– a losing position should probably be followed by a winning one.
Basically, it means that the probability of long winning and losing
- a negative Z-score means that:
– profitable positions are likely to be followed by more profitable positions
– losing positions are to be followed by more losing positions.
Basically, it means that winning or losing streaks are probable.
It should also be noted that Z-score calculation makes sense only for sufficiently
large samples. Math literature suggests a sample size of no less than 51 (some talk about 30) to get a reliable Z-score value.
///////////////////////////////////////////////////////////////////////////////////////////////////////////////////////////////////////////////////
//Z-Score (code)
//
//The results can be INCORRECT when, on the SAME bar, the following 3 conditions are met:
//
// 1) a trade is closed
// 2) a new trade is opened (usually due to a Stop & Reverse)
// 3) the new trade hits TP
//
//Furthermore, optimization should be avoided when accumulating positions, unless it's
//possible to consider all of them as one.
//
//(streaks)-https://www.forextraders.com/forex-education/forex-money-management/using-the-z-score-to-determine-trade-size/
//(streaks)-https://www.earnforex.com/guides/z-score-optimization-in-forex-trading/
//
//(runs) -https://www.mypivots.com/dictionary/definition/233/z-score
//(runs) -https://www.referenceforbusiness.com/encyclopedia/Val-Z/Z-Score.html
//
// Counting STREAKS (+ are Winning trades - are Losing trades)
//
//trades: +-++--++-----+---+++- (21 trades)
//tally: 1 2 3 4 5 6 (6 streaks) a STREAK is a TWIN pair followed
// by a different sign
//
//
// Counting RUNS (+ are Winning trades - are Losing trades)
//
//trades: +-++--++-----+---+++- (21 trades)
//tally: 12 3 4 5 67 8 9 (9 runs) a RUN is any sign followed
// by a different sign
//
// --- start of Z-Score code
ONCE Periods = 0
ONCE Streaks = 0
ONCE CurTrade = 0
ONCE TotalWin = 0
ONCE TotalLose = 0
Periods = Periods + 1
MyProfit = StrategyProfit
// tally Total winning + losing streaks (streak = consecutive winning or losing trades)
IF MyProfit <> MyProfit[1] AND (BarIndex > 0) THEN
IF MyProfit > MyProfit[1] THEN
CurTrade = 1
ELSIF MyProfit < MyProfit[1] THEN
CurTrade = -1
ENDIF
//---------------------------------------------------------------------------------
// code using STREAKS (it seems to be returning only negative values)
// (a sign change preceded by a twin, i.e. a couple of the same sign)
//
//Twins = (CurTrade = CurTrade[1]) //TWO identical trades to make a STREAK
//Streaks = Streaks + ((CurTrade <> CurTrade[1]) AND Twins[1])//now Different trade +
// prior candle's TWINS
//
//---------------------------------------------------------------------------------
// code using RUNS (like PRT seem to be doing)
// (a run is each sign change, no matter twins)
Streaks = Streaks + (CurTrade <> CurTrade[1]) //now Different trade
//---------------------------------------------------------------------------------
//
// tally Winning & Losing trades
TotalWin = TotalWin + (CurTrade = 1)
TotalLose = TotalLose + (CurTrade = -1)
N = TotalWin + TotalLose
ENDIF
IF Streaks > 0 THEN
P = 2 * TotalWin * TotalLose
R = Streaks
Zscore = ((N*(R-0.5))-P) / sqrt((P*(P-N)) / (N-1))
Zscore = round(Zscore * 100) / 100
ELSE
Zscore = 0
ENDIF
Zpos = Zscore > 0 //or whatever else > 0
Zneg = Zscore < 0 //or whatever else < 0
// --- end of Z-Score code
//
//*********************************************************************************
// Z-Score management
ONCE SkipOneTrade = 0
ONCE MinTrades = 30 //30 or 51 trades minimum to consider Z-Score Reliable
// as suggested on some websites
IF Zpos THEN
//Positive Z-Score
IF (CurTrade = 1) AND (Curtrade[1] = -1) THEN //Winning trade following a Losing one
IF N >= MinTrades THEN //use Z-Score only when MinTrades+ have been tallied
SkipOneTrade = 1
ENDIF
ENDIF
ELSIF Zneg THEN
//Negative Z-Score
IF (CurTrade = -1) AND (CurTrade[1]= 1) THEN //Losing trade following a Winning one
IF N >= MinTrades THEN //use Z-Score only when MinTrades+ have been tallied
SkipOneTrade = 1
ENDIF
ENDIF
ENDIF
//*********************************************************************************
//
// S T R A T E G Y
//
ONCE MA = 100 //100
ONCE T = 1 //1=ema
IF close CROSSES OVER average[MA,T] AND Not OnMarket THEN
IF SkipOneTrade THEN //Do not open any trade when SkipOneTrade is TRUE
SkipOneTrade = 0 //clear it for the next trade
ELSE
BUY AT Market
ENDIF
ELSIF close CROSSES UNDER average[MA,T] AND Not OnMarket THEN
IF SkipOneTrade THEN //Do not open any trade when SkipOneTrade is TRUE
SkipOneTrade = 0 //clear it for the next trade
ELSE
SELLSHORT AT Market
ENDIF
ENDIF
set stop ploss 250 //250
set target pprofit 2500 //2500
//
//*********************************************************************************
// Nicolas' trailing stop function
trailingstart = 25 //25 trailing will start @trailinstart points profit
trailingstep = 5 //5 trailing step to move the "stoploss"
//reset the stoploss value
IF NOT ONMARKET THEN
newSL=0
ENDIF
//manage long positions
IF LONGONMARKET THEN
//first move (breakeven)
IF newSL=0 AND close-tradeprice(1)>=trailingstart*pipsize THEN
newSL = tradeprice(1)+trailingstep*pipsize
ENDIF
//next moves
IF newSL>0 AND close-newSL>=trailingstep*pipsize THEN
newSL = newSL+trailingstep*pipsize
ENDIF
ENDIF
//manage short positions
IF SHORTONMARKET THEN
//first move (breakeven)
IF newSL=0 AND tradeprice(1)-close>=trailingstart*pipsize THEN
newSL = tradeprice(1)-trailingstep*pipsize
ENDIF
//next moves
IF newSL>0 AND newSL-close>=trailingstep*pipsize THEN
newSL = newSL-trailingstep*pipsize
ENDIF
ENDIF
//stop order to exit the positions
IF newSL>0 THEN
SELL AT newSL STOP
EXITSHORT AT newSL STOP
ENDIF
//*********************************************************************************
//
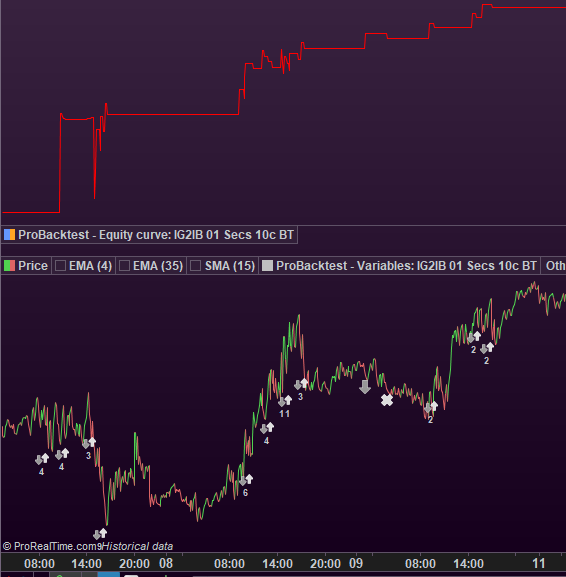
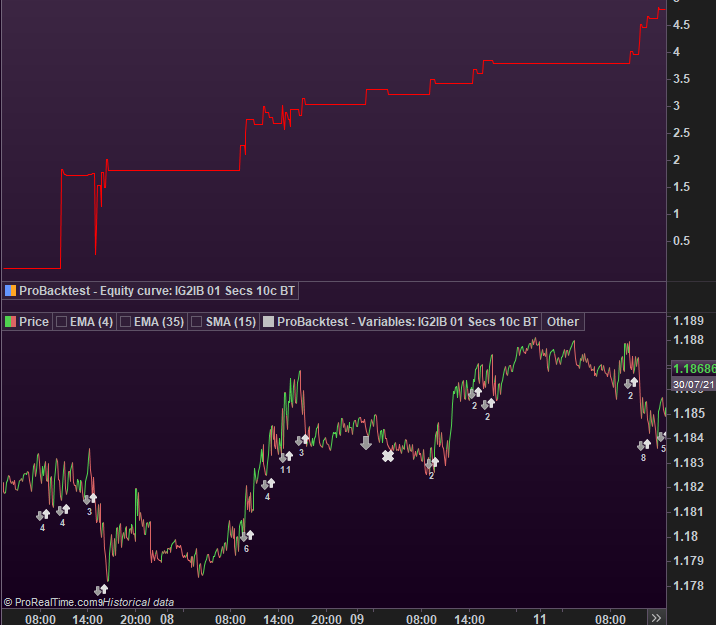
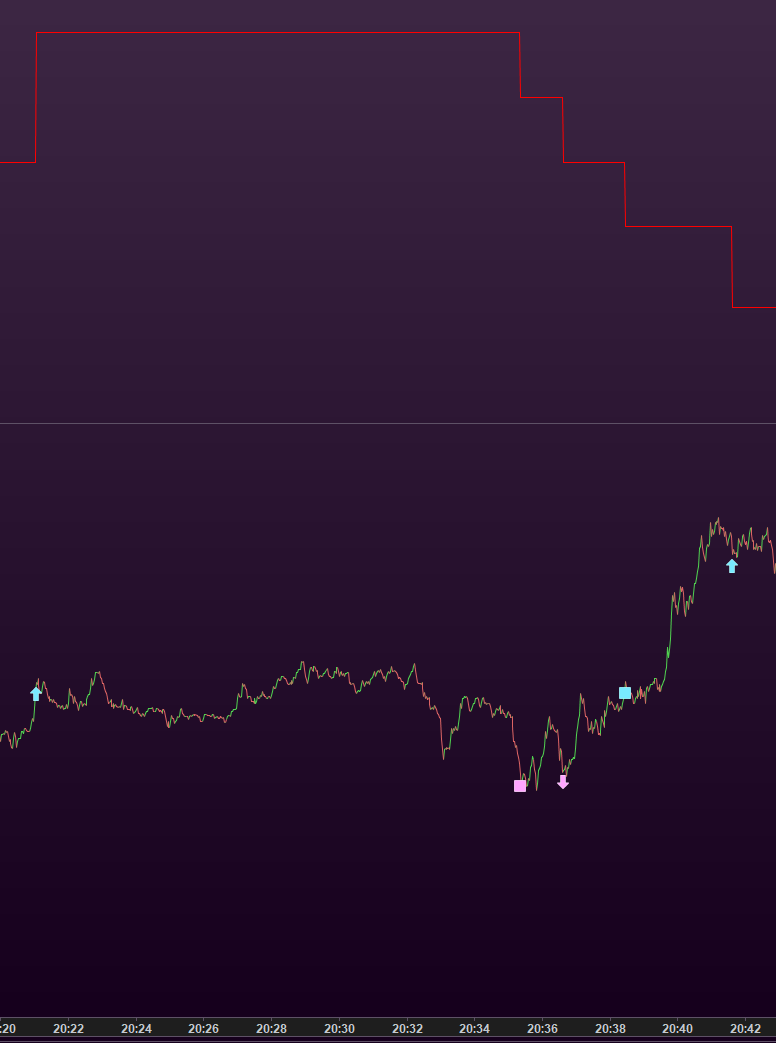
graph Zscore coloured(255,0,0,255)
graph TotalWin
graph TotalLose
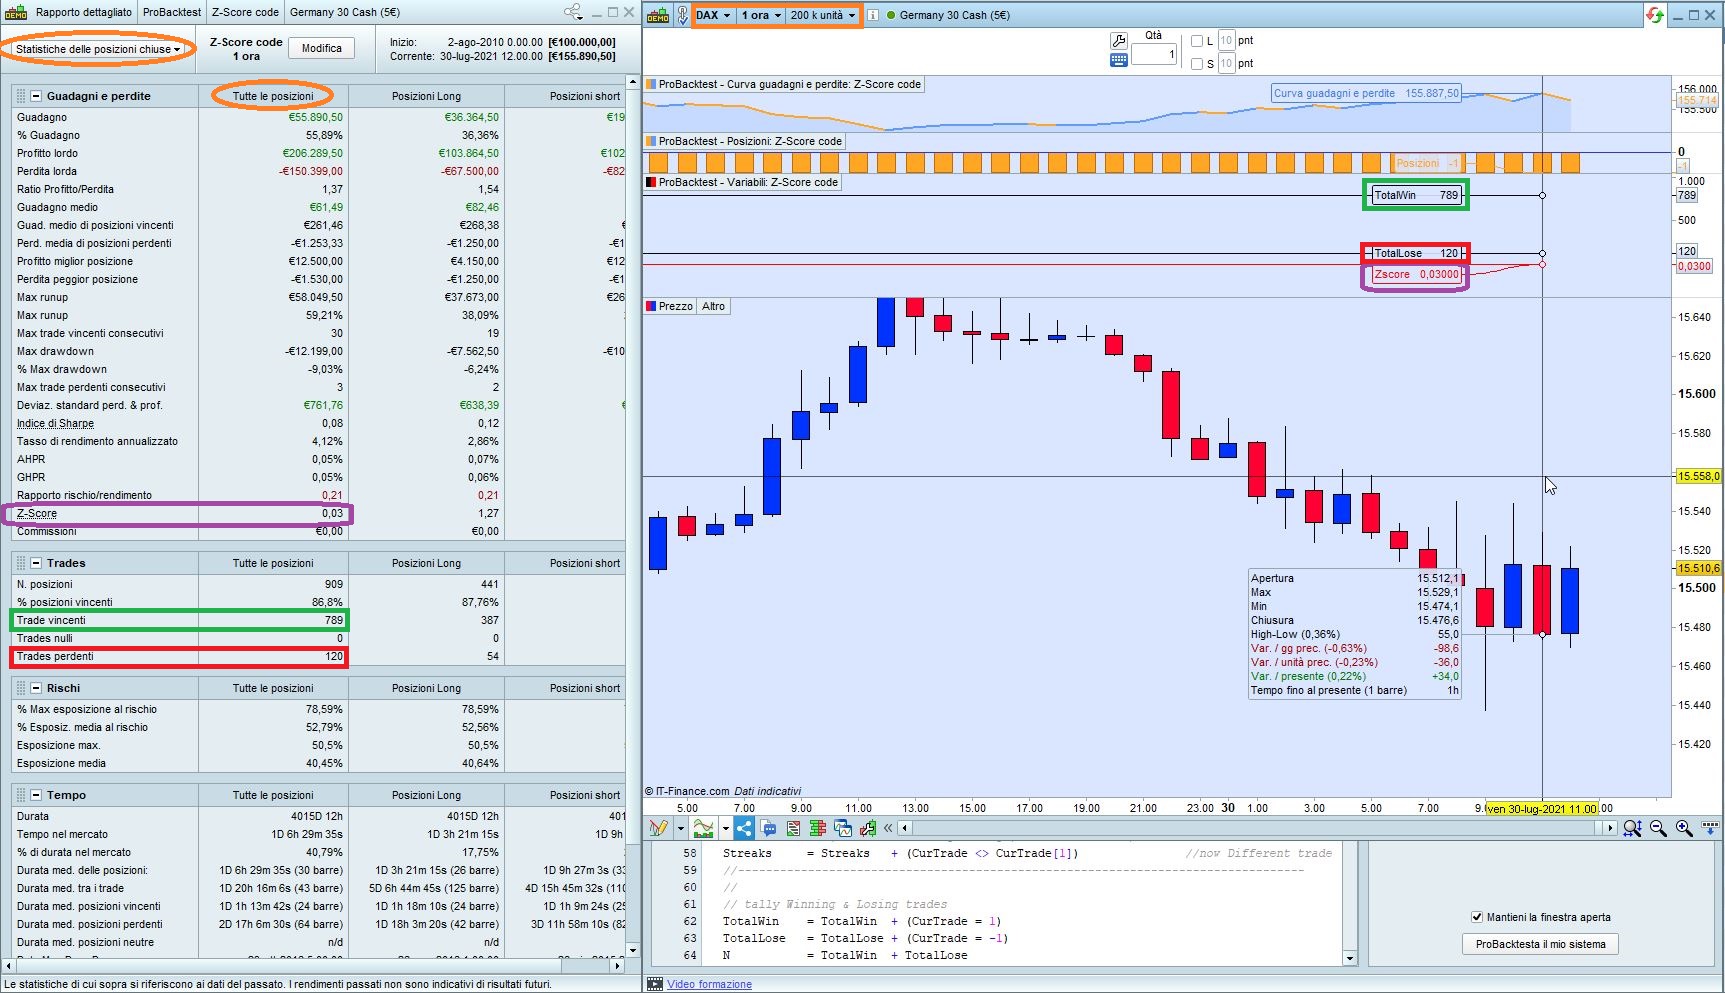
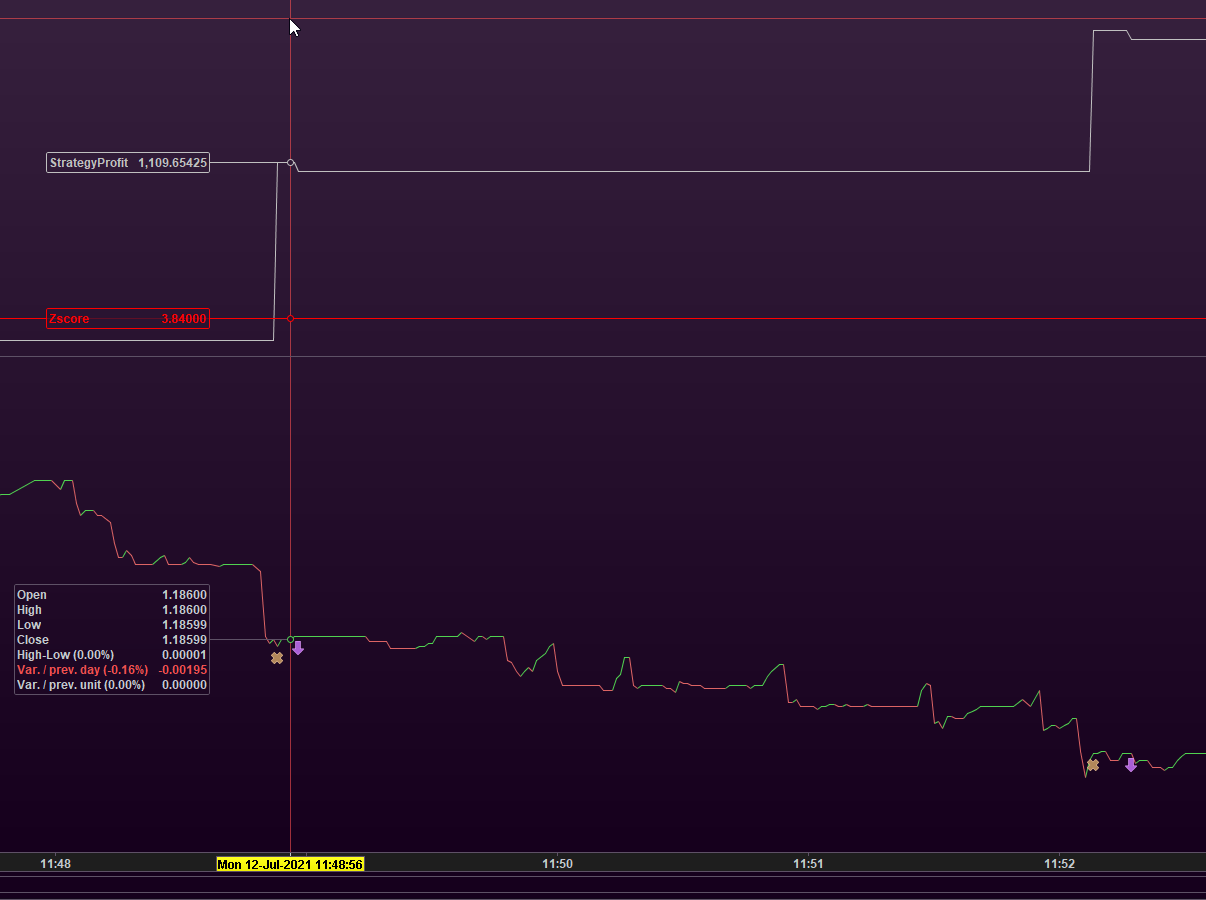
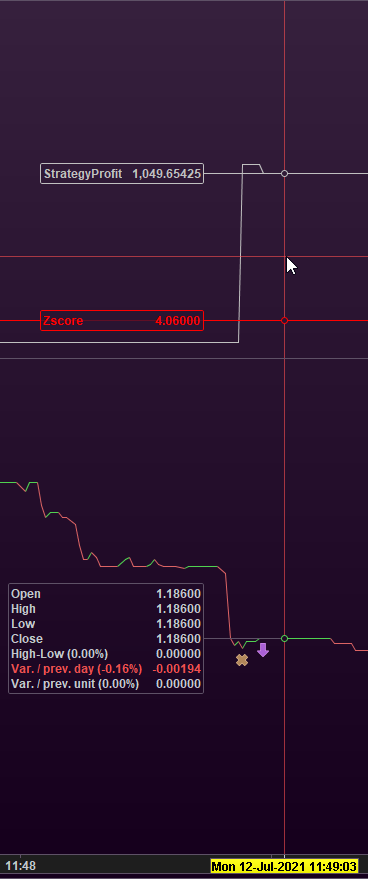
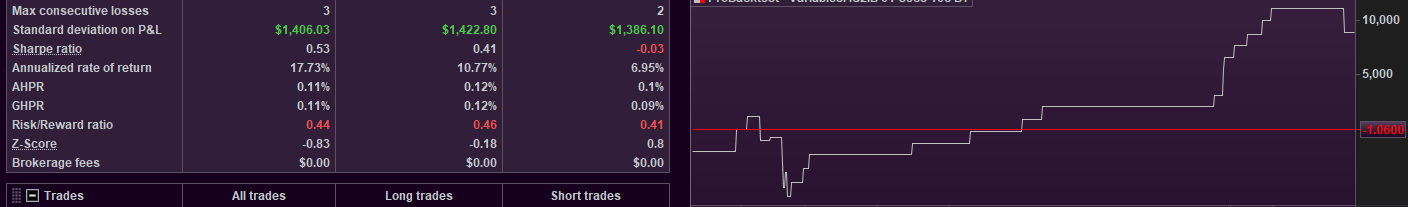
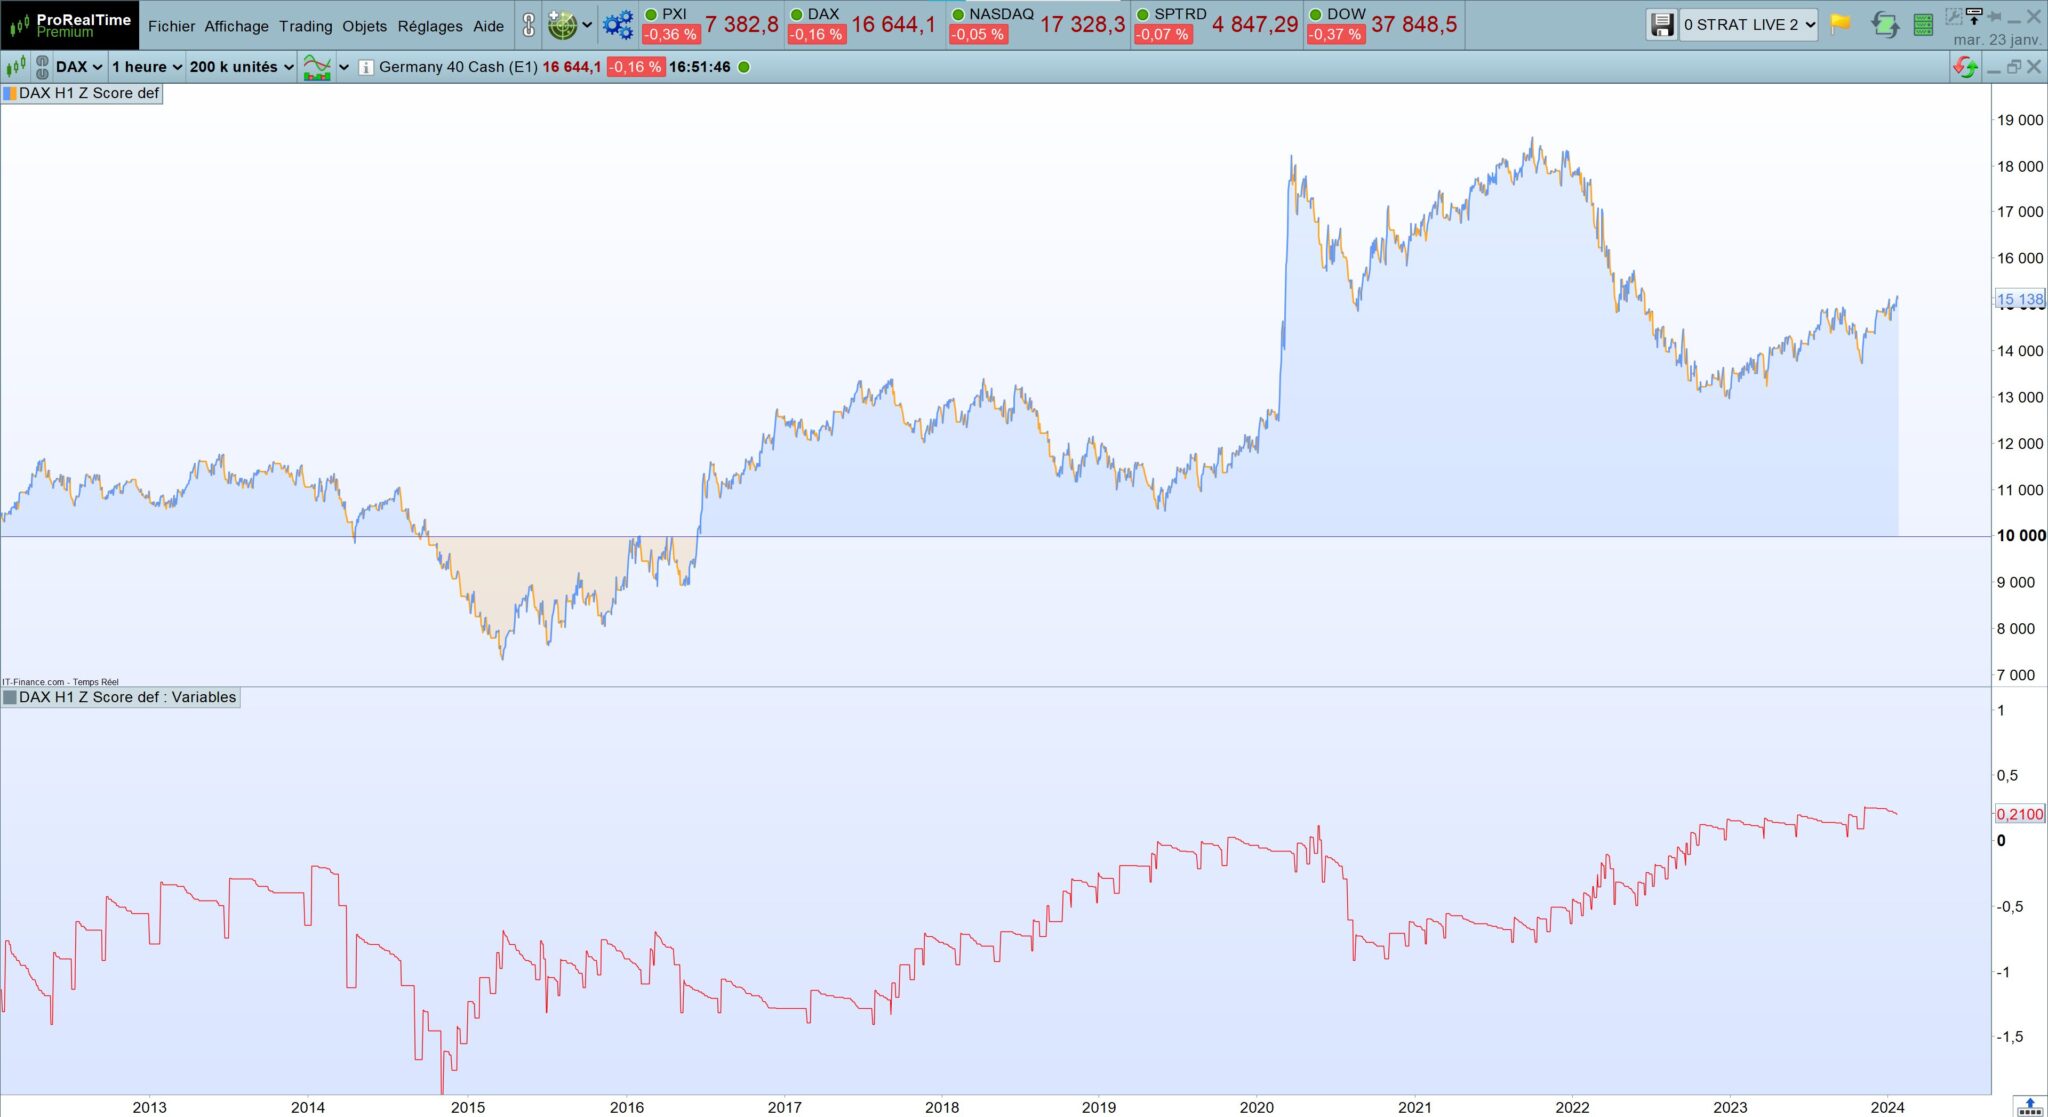
One of the attached pics shows correspondance between these calculations and PRT’s.
I tested it on DAX, h1, 200K units.
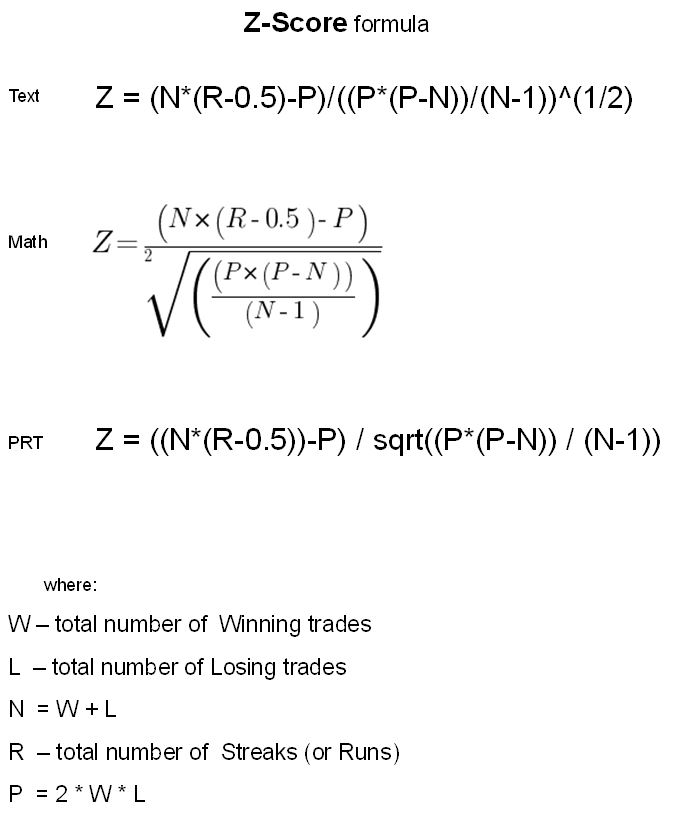
In the attached PIC about the formula, PRT stands for “the above formula in PRT Language”, not “PRT Formula”.