wrong calculation for weekly data

Viewing 3 posts - 1 through 3 (of 3 total)
  • Author
    Posts
  • #39552 quote
    AVTAVT
    Participant
    Senior

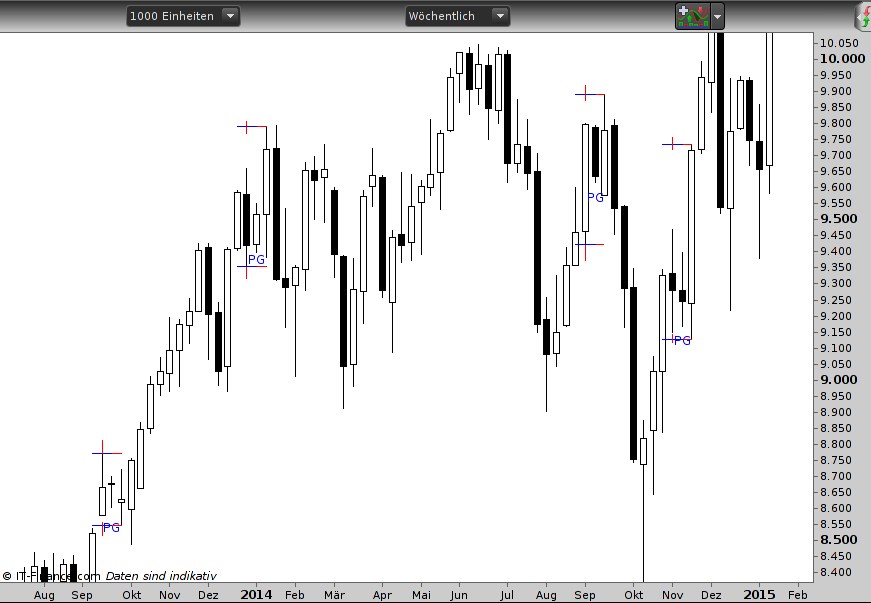
    Indicator is a PopGun marker. Every timeframe (based minute, hour, day, month, quarter) is calculated and therefore drawn correctly in the chart – except all weekly based data (like weekly, 2 weeks, 3 weeks…).

    Code is simple

    // Popgun: middle candle totally enclosed by previous and following candle
    
    RangePointTop=Max(high[0],high[2])
    RangePointBottom=Min(low[0],low[2])
    Popgun=(high[0]>high[1] AND low[0]<low[1] AND high[1]<high[2] AND low[1]>low[2])
    
    IF Popgun THEN
    DRAWTEXT("PG", barindex, low-5, Dialog, Standard, 12) COLOURED(0,0,255)
    DRAWSEGMENT(barindex-2,RangePointTop,barindex,RangePointTop) COLOURED(0,0,255)        // high mark
    DRAWSEGMENT(barindex-2,RangePointBottom,barindex,RangePointBottom) COLOURED(0,0,255)  // low mark
    ENDIF
    
    Return

    Incorrect weekly markers attached (I marked the correct lines with red, hope you can see it).

    Any ideas what happens here? Thanks a lot.

    WrongWeekPg.png WrongWeekPg.png
    #39570 quote
    GraHalGraHal
    Participant
    Master

    It would be much easier if you add a vertical grid on the chart.

    Your x axis is in Months and squinting my eyes and trying to line up there appears to be 4 or 5 bars in each month? Isn’t that correct? some months contain 4 Fridays and some months contain 5 Fridays?

    Or am I misunderstanding your problem?

    AVT thanked this post
    #39587 quote
    AVTAVT
    Participant
    Senior

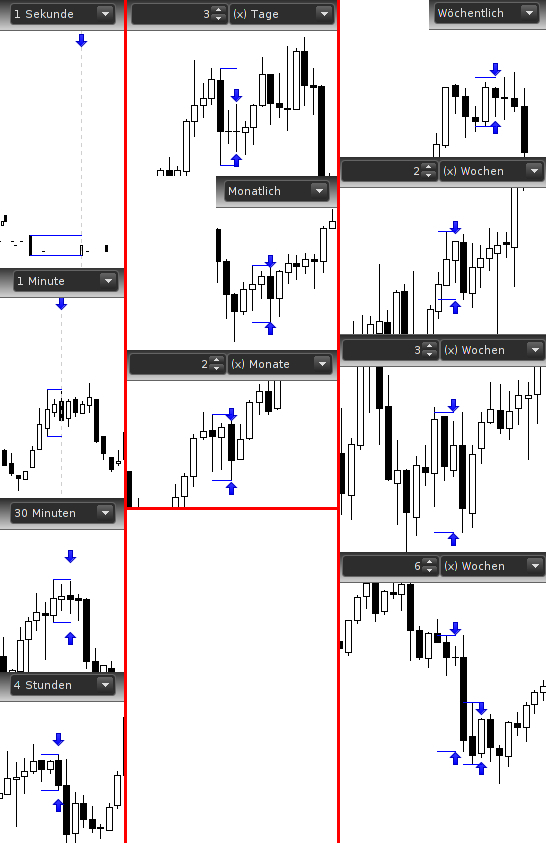
    Thanks GraHal for your answer. I have changed the code for drawing a bit, so it might be easier to see where the problem is. The code should mark the Popgun (which is the outside of an inside) with an arrow and draw range lines for the 3-candle range (1st candle, inside, outside).  This is working fine in all timeframes – except weekly. This is PRT 10.3, , IG live and it happens in index, forex, commodities but then again shares are correctly painted.

    In the picture the first two columns are all correct, from second up to month (just one quarter but that’s also ok). The third column shows the weekly result and weekbased, like 2 weeks, 3 weeks … As you can see the PG is marked one candle too early and consequently the range too. In the code I added a line to tell the value of the PGs top which is correct in week.

    I attach the script, so you can check. I have really no idea what is causing this.

    PGproblem.jpg PGproblem.jpg ProblemPGFinder.itf
Viewing 3 posts - 1 through 3 (of 3 total)

  • You must be logged in to reply to this topic.

ProRealAI ProRealAI New

Stuck on this ProBuilder code?

Describe what this topic is trying to build, in plain English, and ProRealAI writes the ProRealTime™ indicator, screener or system for you.

Available in 7 languages
Try ProRealAI

wrong calculation for weekly data


ProBuilder: Indicators & Custom Tools

New Reply
Author
author-avatar
AVT @avt Participant
Summary

This topic contains 2 replies,
has 2 voices, and was last updated by AVTAVT

9 years, 3 months ago.

Topic Details
Forum: ProBuilder: Indicators & Custom Tools
Language: English
Started: 07/01/2017
Status: Active
Attachments: 3 files
ProRealCode ProRealCode
Loading...