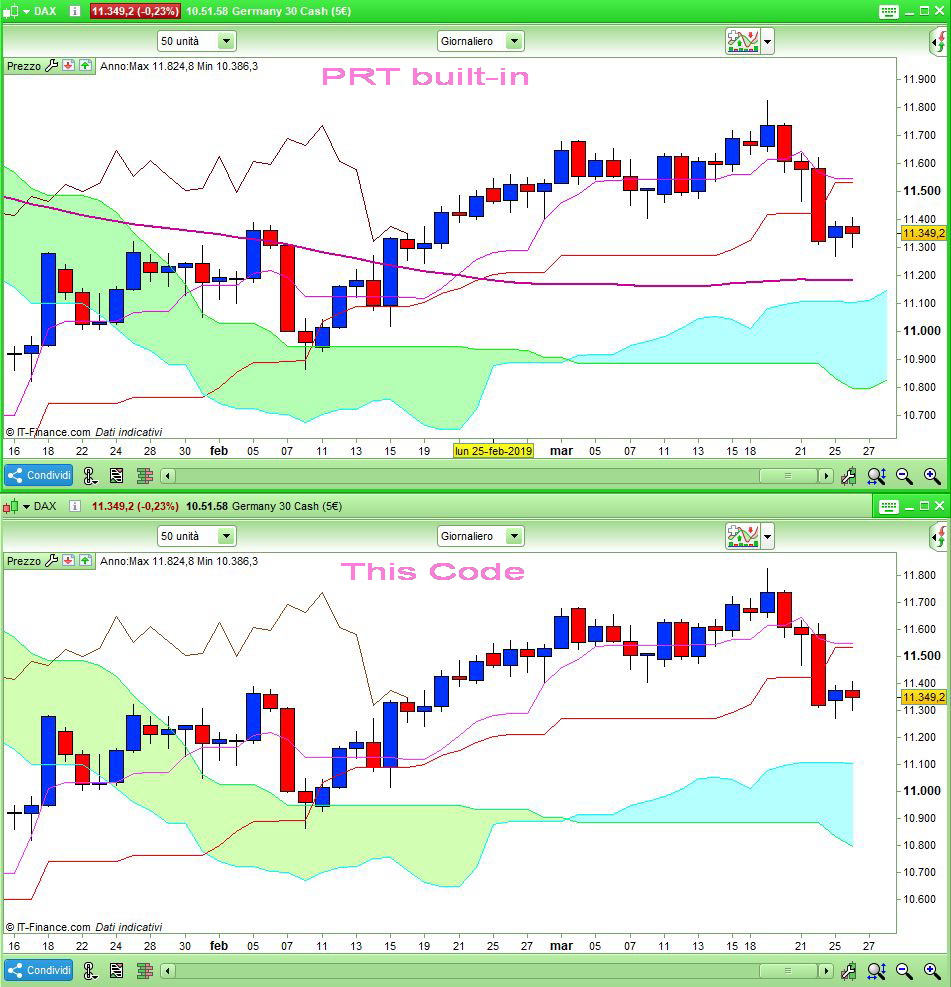
“Houston we have a problem..” 🙂
Nicolas, please help me! I’m going crazy with prt! 😀
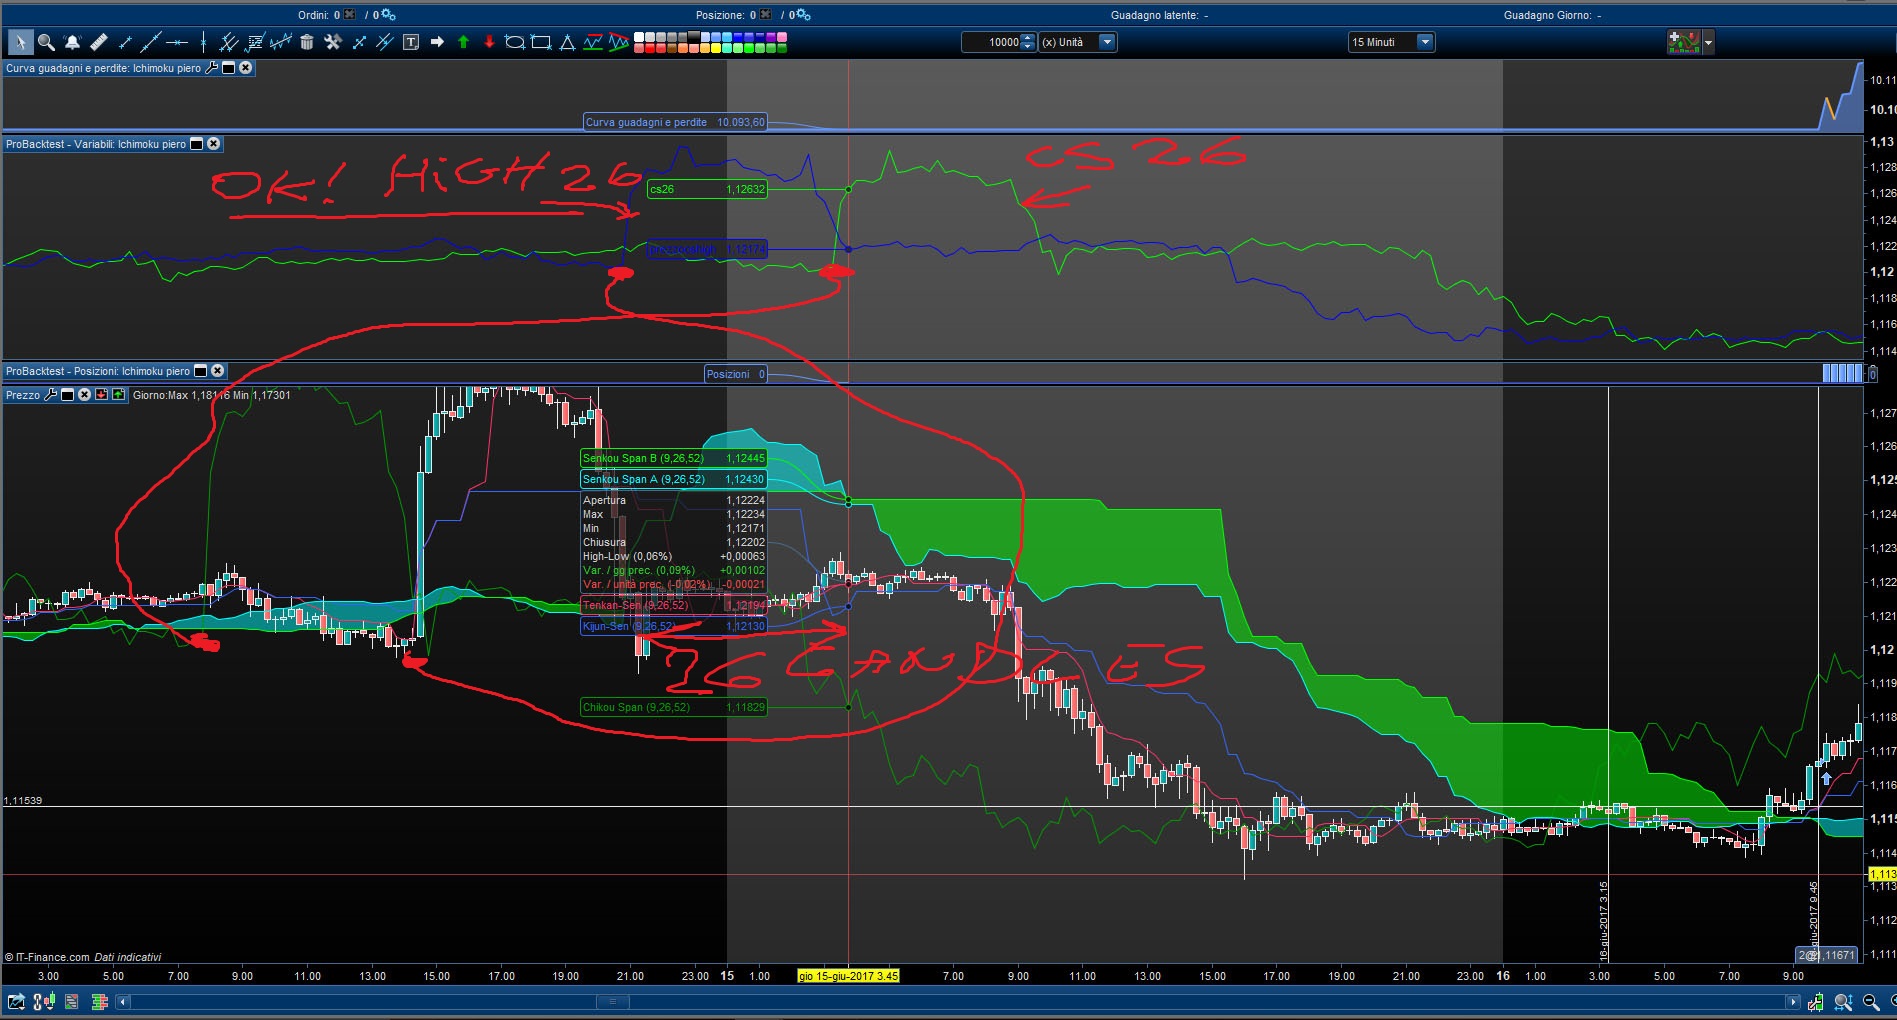
with CS[26]
I = 26 //Chikou-Span Period (26)
CS = close[I] //Chikou-Span
prezzoCSHigh= high[26]

GRAPH CS[26] coloured(0,255,0) AS "CS26"
GRAPH prezzoCSHigh coloured(0,0,255) AS "prezzoCSHigh"
with CS[0]
I = 26 //Chikou-Span Period (26)
CS = close[I] //Chikou-Span
prezzoCSHigh= high[26]

GRAPH CS[0] coloured(0,255,0) AS "CS26"
GRAPH prezzoCSHigh coloured(0,0,255) AS "prezzoCSHigh"
The only solution that works..
prezzoCSHigh= high[26]
CS = close[0]
GRAPH CS[0] coloured(0,255,0) AS "CS26"
GRAPH prezzoCSHigh coloured(0,0,255) AS "prezzoCSHigh"
redefining the function..
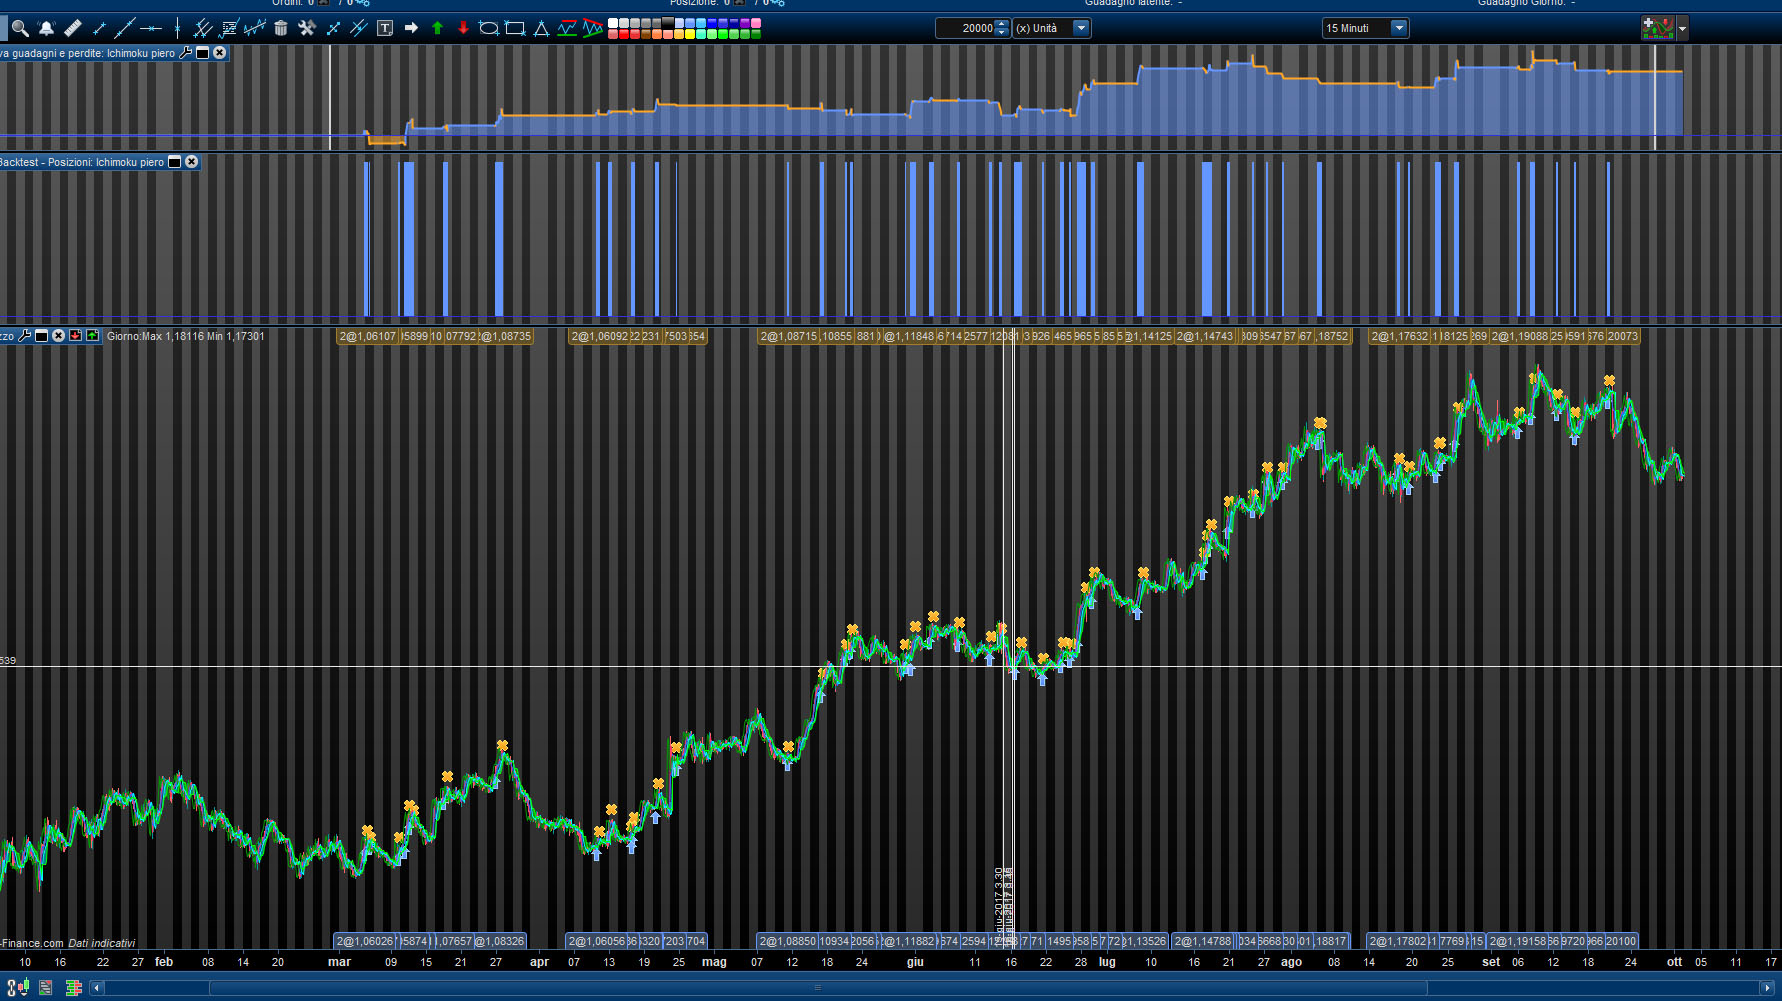
now the first version of the ichimoku EA works..
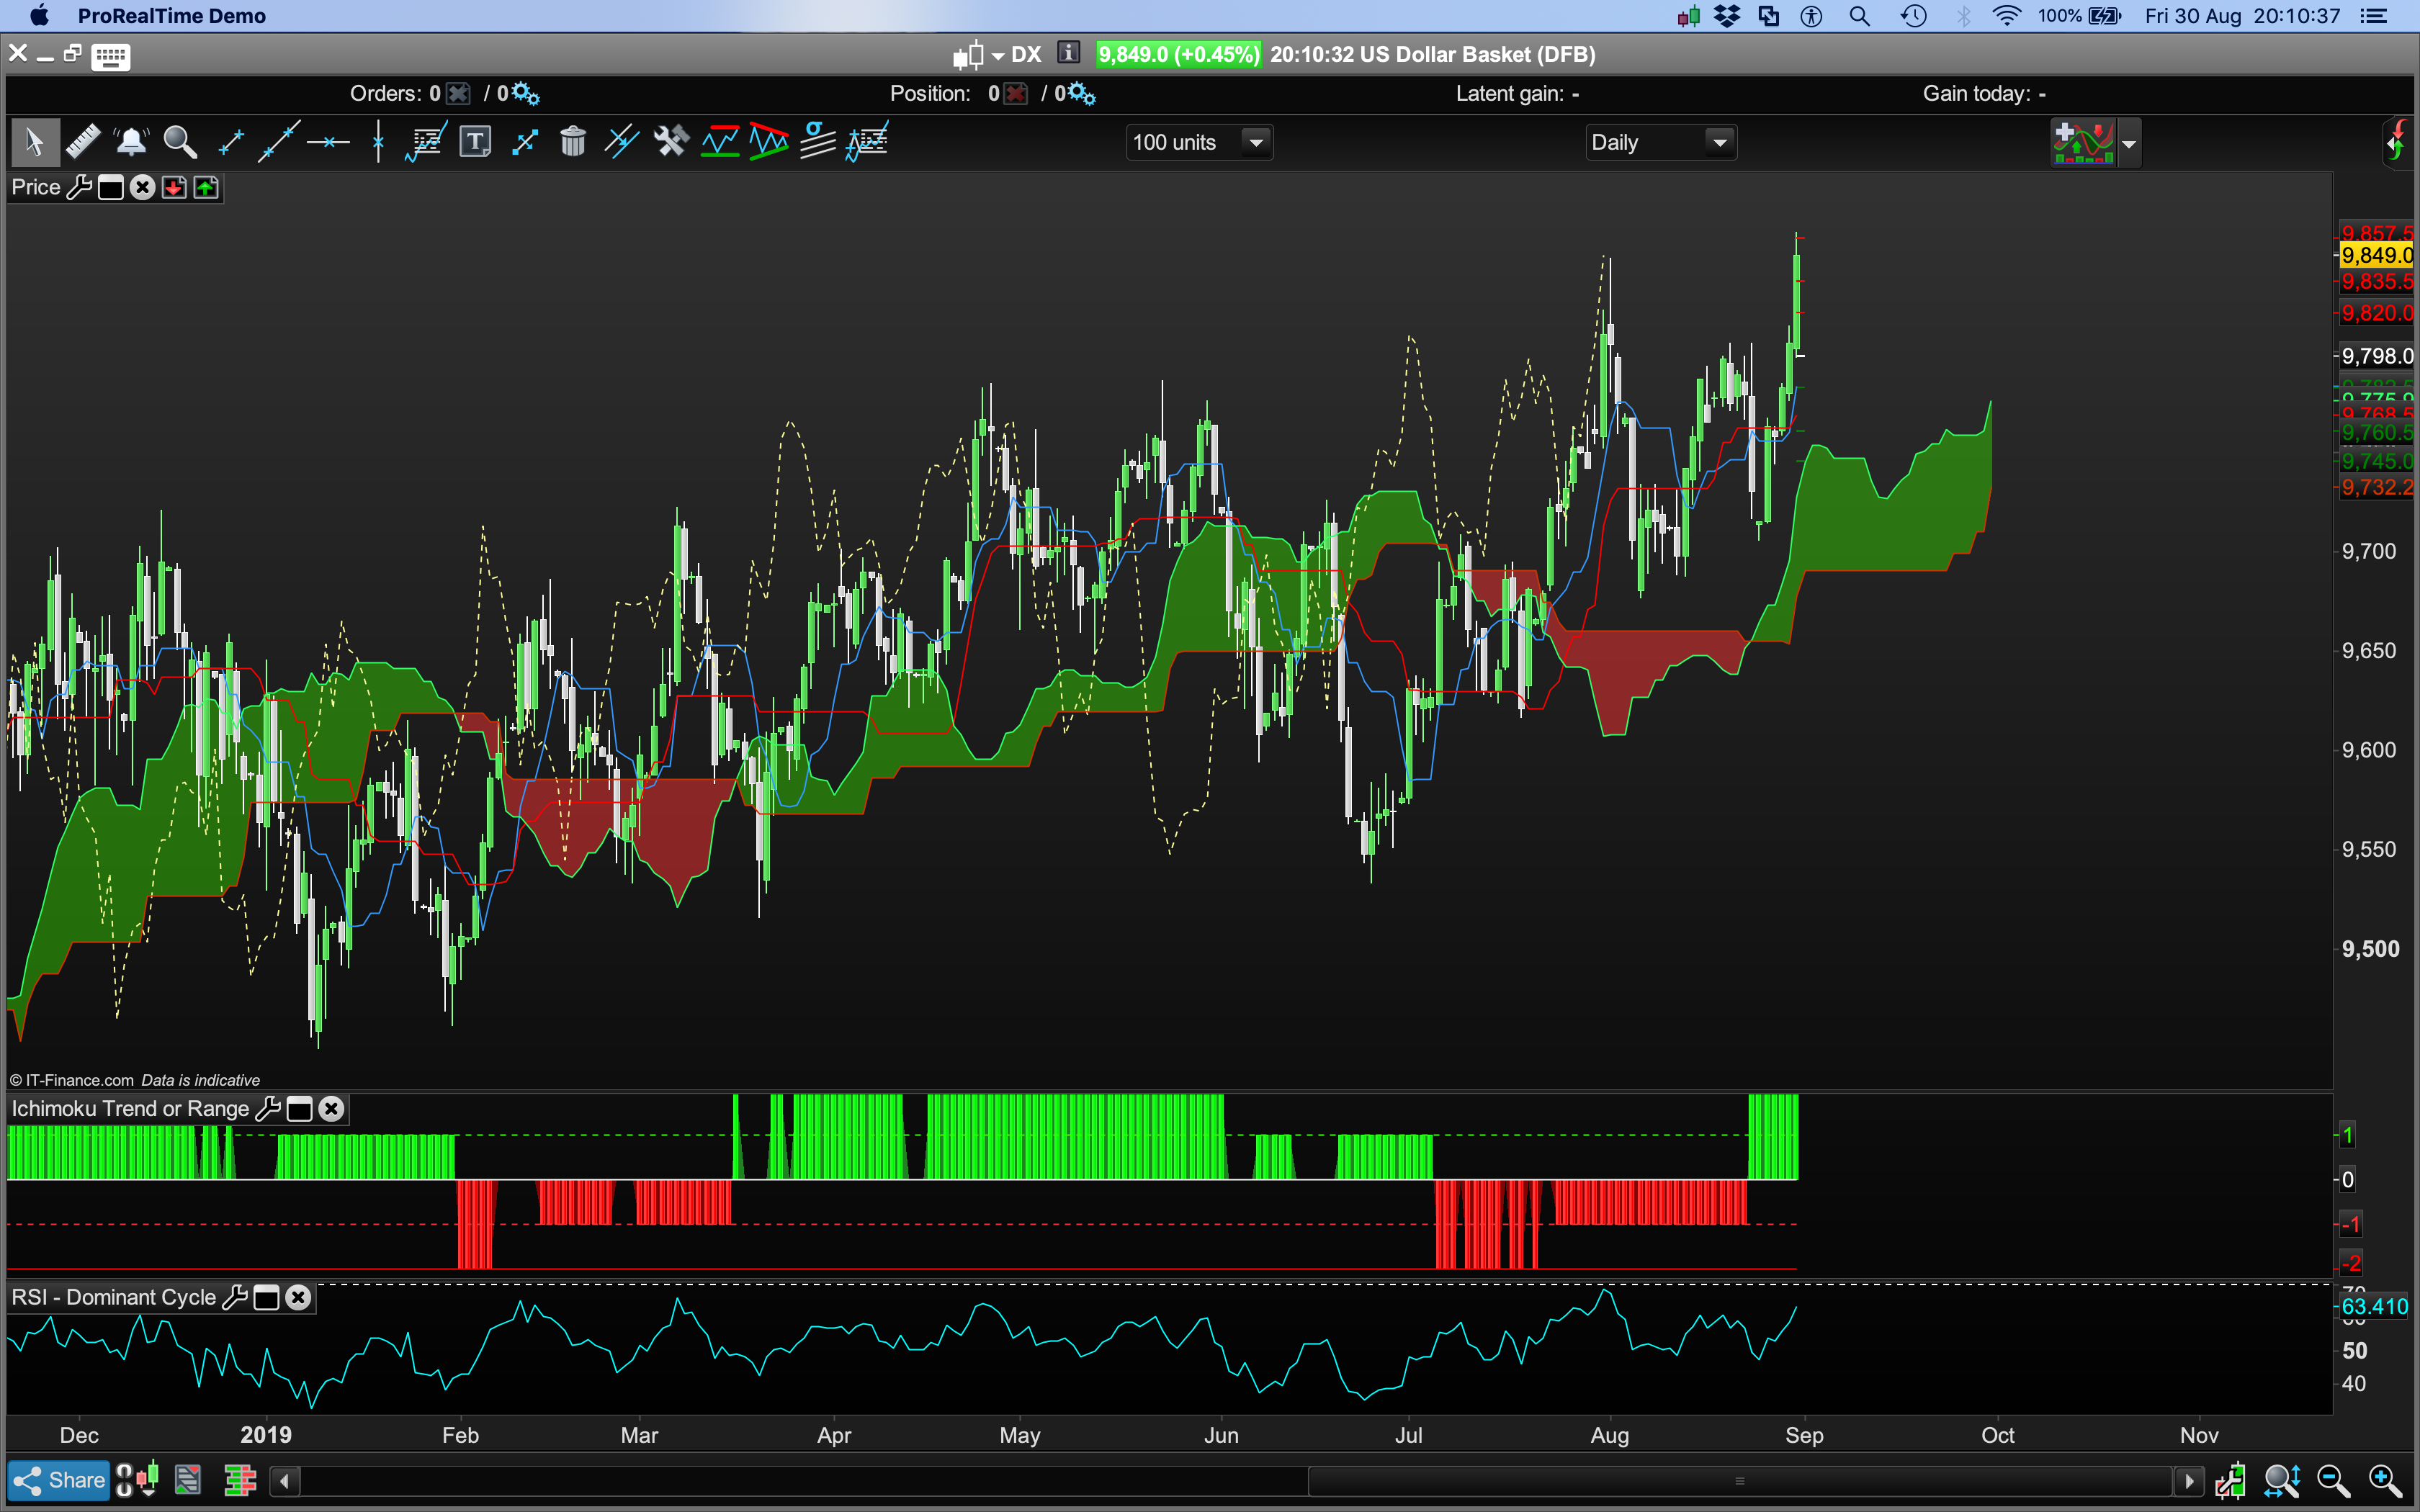
eur/usd 27/02/2017 to 27/09/2017
even though I had to give up all other tools in the MQL4 version .. dynamic trailing, analysis at different TF, searching for trends, resistances and supports with other methods than ichimoku..
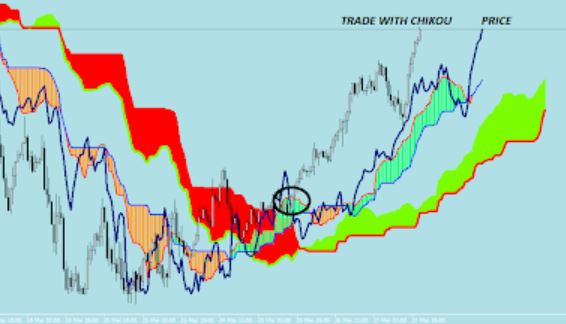
The Chikou is the actual Close (the one from the current period), but it is plotted 26 bars in the past, that’s all. It is not possible to draw a curve in the past, you can try with dots or any ASCII char, but that’s not so important since you only want to get the good values for your strategy.
If this may still be of any help. Actually it is possible to use DRAWSEGMENT to link different points to achieve plotting CHIKOU like PRT do (still you cannot plot in the future), replace the DRAWTEXT line (line 23) with:
drawsegment(barindex[26],close,barindex[27],close[1]) coloured(139,69,19,255)
 mcha
mchaParticipant
Senior
Hello Can we get the filling of the cloud / kumo by something other than color (small dots or small dashes like Metatrader but if Nicolas wants to place small hearts why not, small $ could also be adequate 😉 Thank you in advance for your answer (s)
Please speak English on this forum! (I translated it)
Thank you.
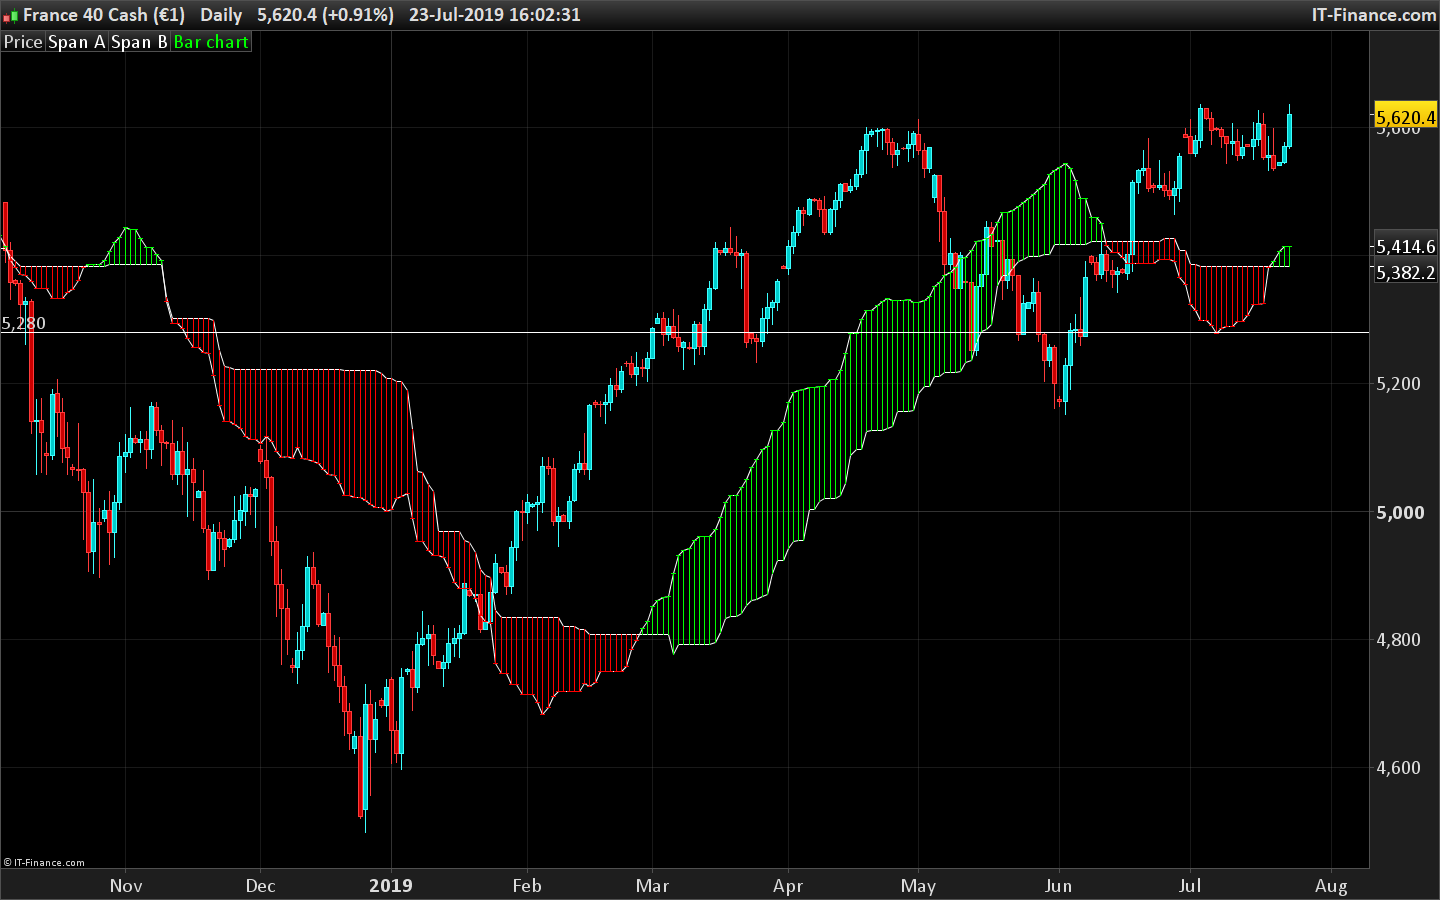
Kumo filled with barcharts and color change according to SpanA and SpanB position:
p1=9
p2=26
p4=26
p3=52

REM Tenkan-Sen = (Highest High + Lowest Low) / 2, for the past 9 days
Upper1 = HIGHEST[p1](HIGH)
Lower1 = LOWEST[p1](LOW)
Tenkan = (Upper1 + Lower1) / 2

REM Kijun-Sen = (Highest High + Lowest Low) / 2, for the past 26 days
Upper2 = HIGHEST[p2](HIGH)
Lower2 = LOWEST[p2](LOW)
Kijun = (Upper2 + Lower2) / 2

REM Senkou Span A = (Tenkan + Kijun) / 2, plotted 26 days ahead of today
SpanA = (Tenkan[p4] + Kijun[p4]) / 2

REM Senkou Span B = (Highest High + Lowest Low) / 2, for the past 52 days, plotted 26 days ahead of today
SpanB = ((HIGHEST[p3](HIGH[p4])) + LOWEST[p3](LOW[p4])) / 2

//fill the cloud
r=255
g=0
if spanA>spanb then
r=0
g=255
endif
drawbarchart(spana,spanb,spanb,spana)coloured(r,g,0)

Return SpanA AS "Span A" , SpanB AS "Span B"
 Bard
BardParticipant
Master
Thanks for the code
@Nicolas and the neat “fill cloud” option.
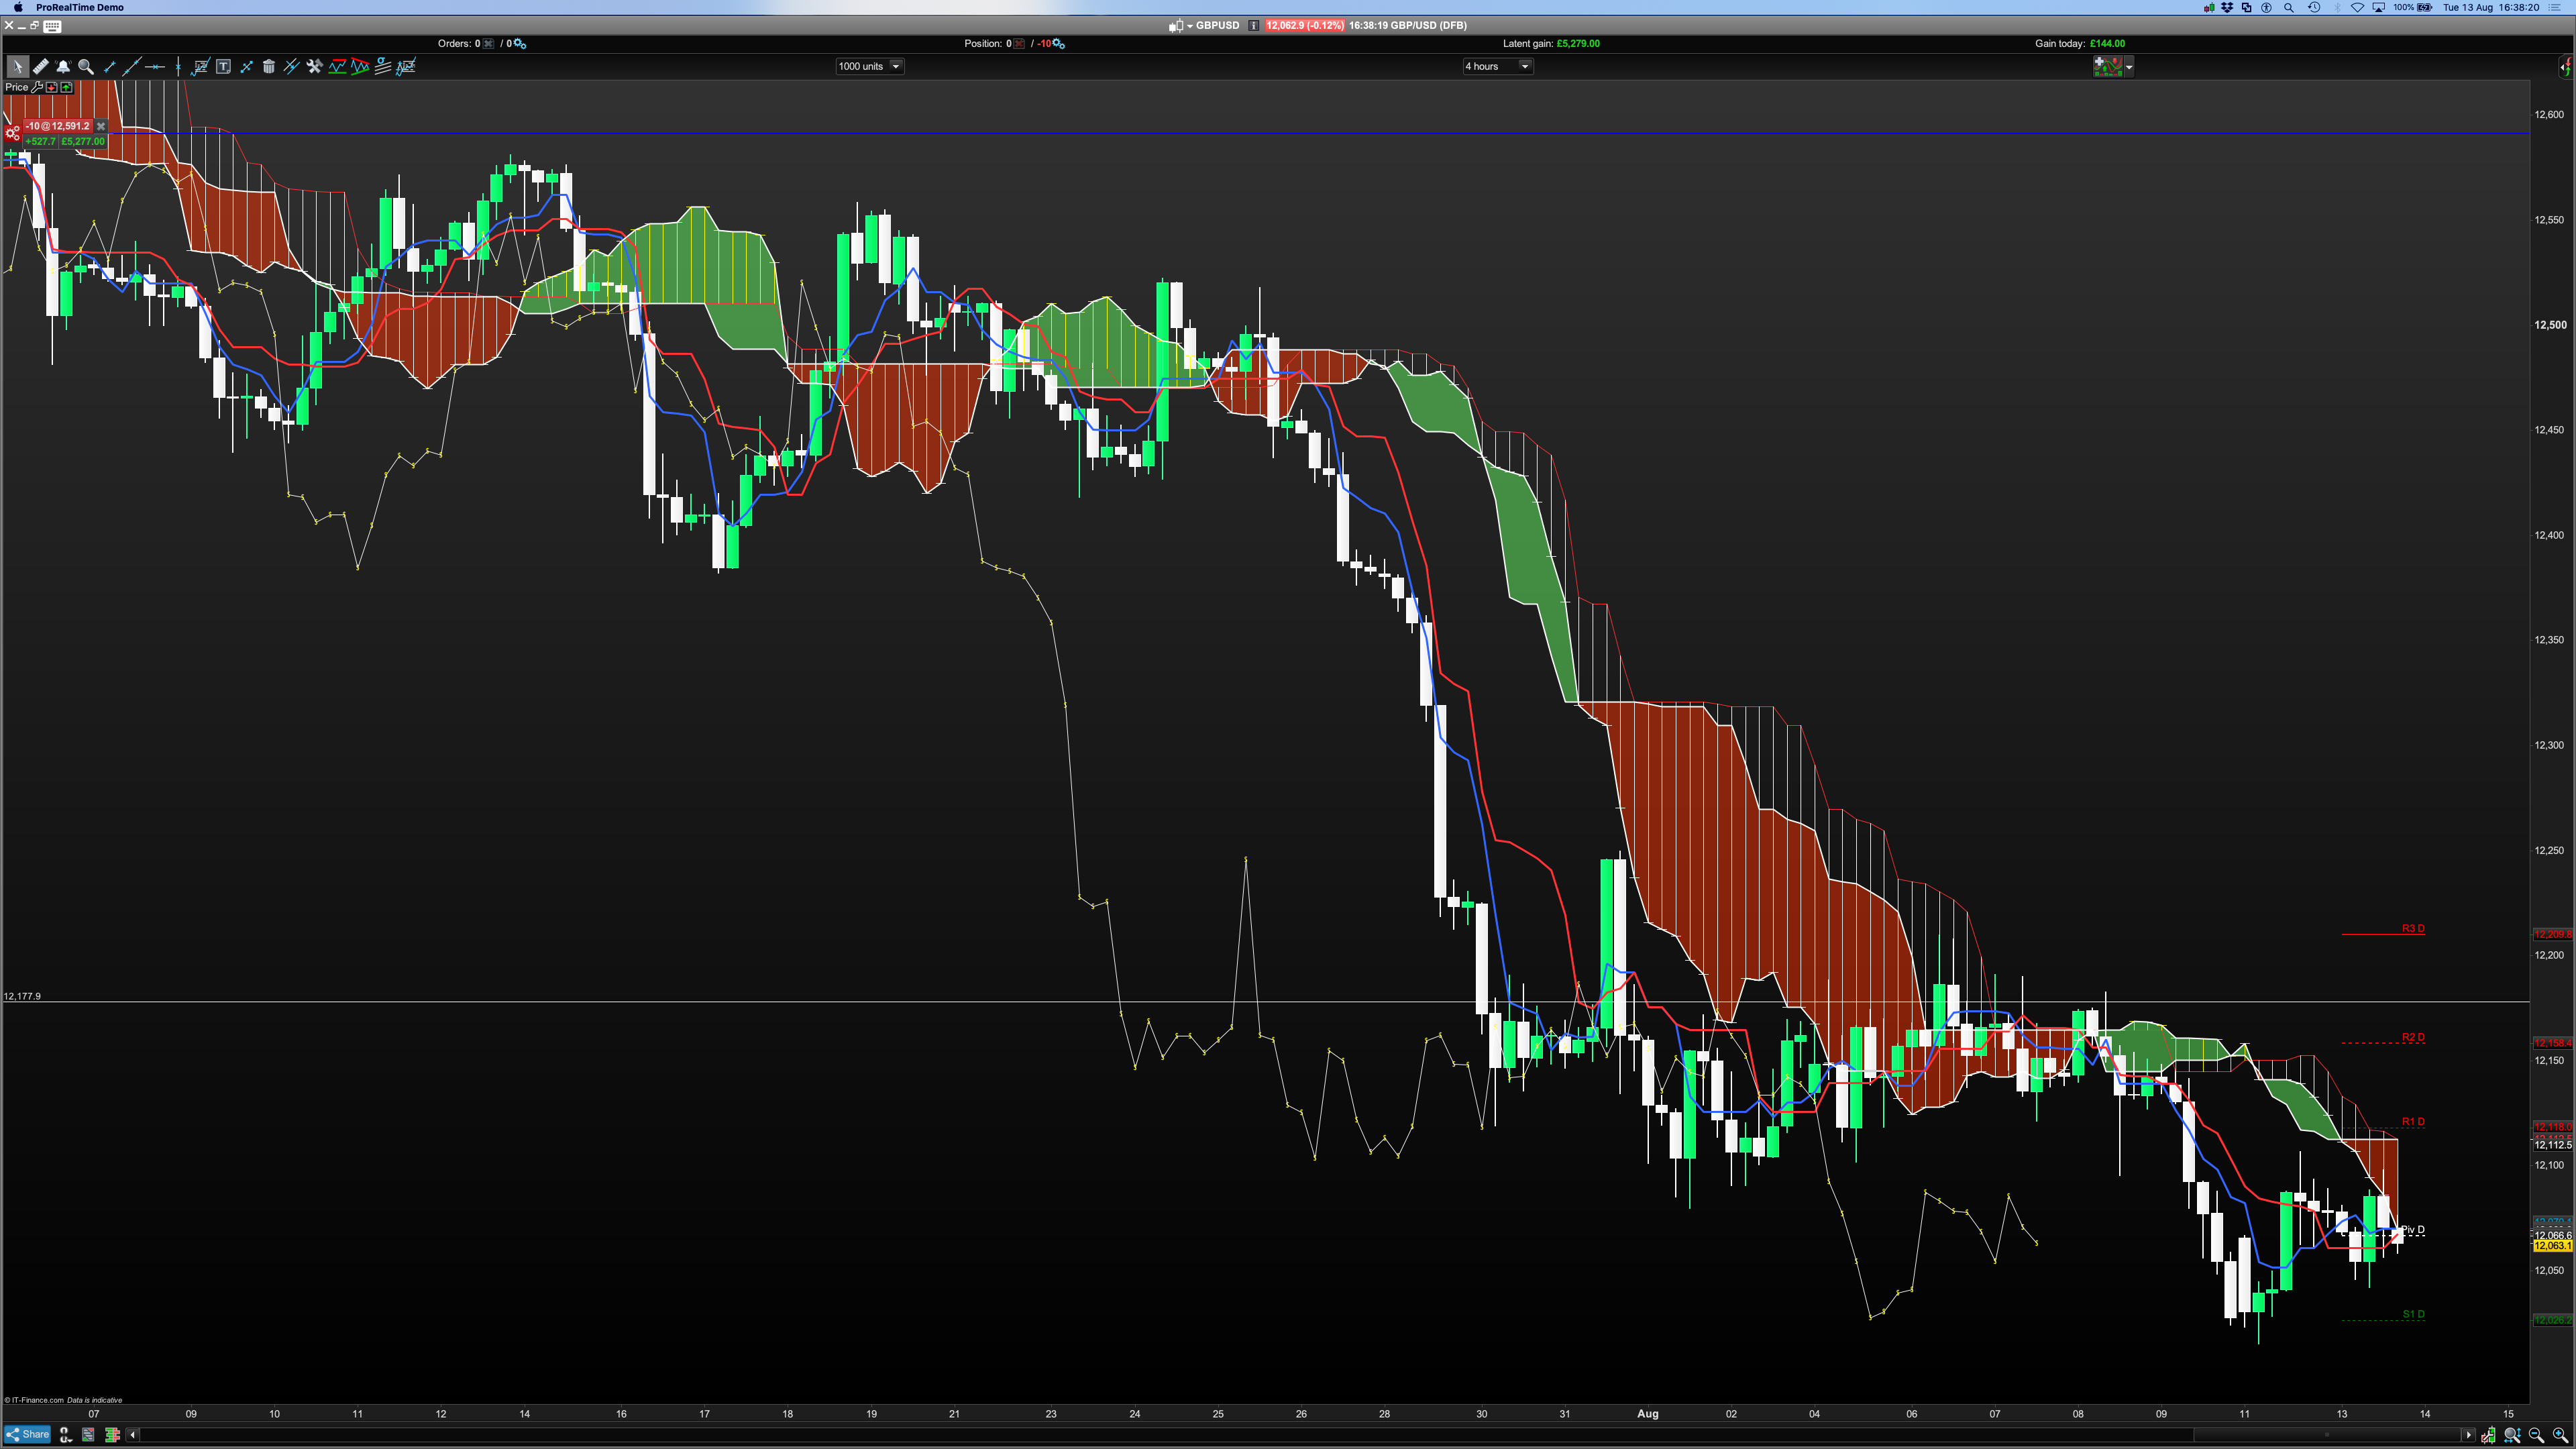
How do I add: Bold or style(dottedline,2) to the Draw text line, tried a few times but can’t figure it out.
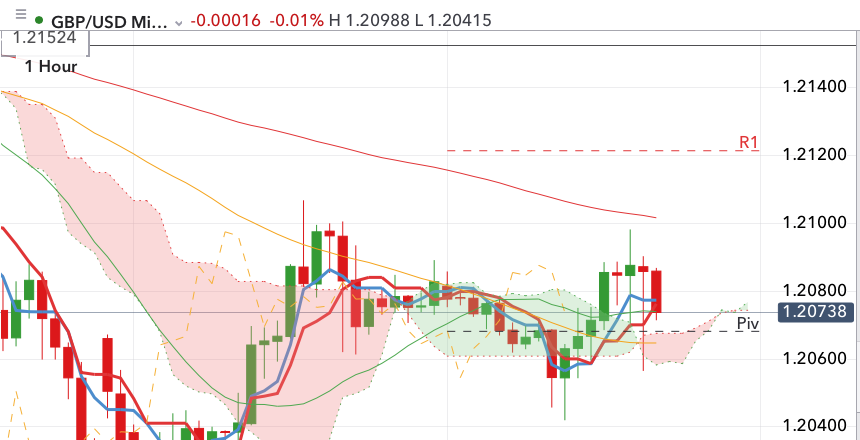
Also how do IG get their charts to plot forward Kumo/Clouds? (Pls see white IG image.)
(Please ignore Ichimoku Orig image in black, I found out that Span B was incorrectly formulated hence the inconsistent Kumo’s between the code here and an earlier code I was using from this forum).
Cheers
Bard
To change the style of a plotted text, please follow the detailed instruction described in the
DRAWTEXT documentation page.
BardParticipant
Master
Hi
@Nicolas, thanks for the Drawtext link. I got the bold, 2 to work but that removes the $ signs. I also can’t add the style, dotted line, tried all kinds of combinations with brackets, commas but no dottedline and dollar signs…
I wanted a dotted Chikou line with “$$” signs, yeah I know, I’ve got good taste, what can I say?
drawtext("$$",barindex[26],close) coloured(255,255,0) //plot Chikou in the past
drawsegment(barindex[26],close,barindex[27],close[1]) coloured(255,255,0)
Also this Ichimoku doesn’t have forward plotting Kumo clouds whereas the Ichimoku standard indicator does, but that code is hidden. What code in the standard indicator is exactly allowing that forward plotting to occur?
Cheers
There are no styles available for DRAWSEGMENT, still.
It is not possible to plot in the future of the chart since coordinates are made from BARINDEX which are still not present in the future! 😐
BardParticipant
Master
Is this not a future Kumo cloud plot though
@Nicolas? The code is hidden because it’s the default PRT Ichimoku indicator.
Right, but this is an internal indicator, not a ProBuilder coded one (a custom indicator).
mchaParticipant
Senior
Hello
is it possible, with PRT last version, to have the candles with 26 days delay postponed 26 days before; like a improved chikou
Thanks by avance
attached file :exists for metatrader; made by Sohocool