Being very new at this i created a couple of mean reversion strategies, 1 that takes profit pretty quick, and another that tries to let the winners run and follow them as far as possible.
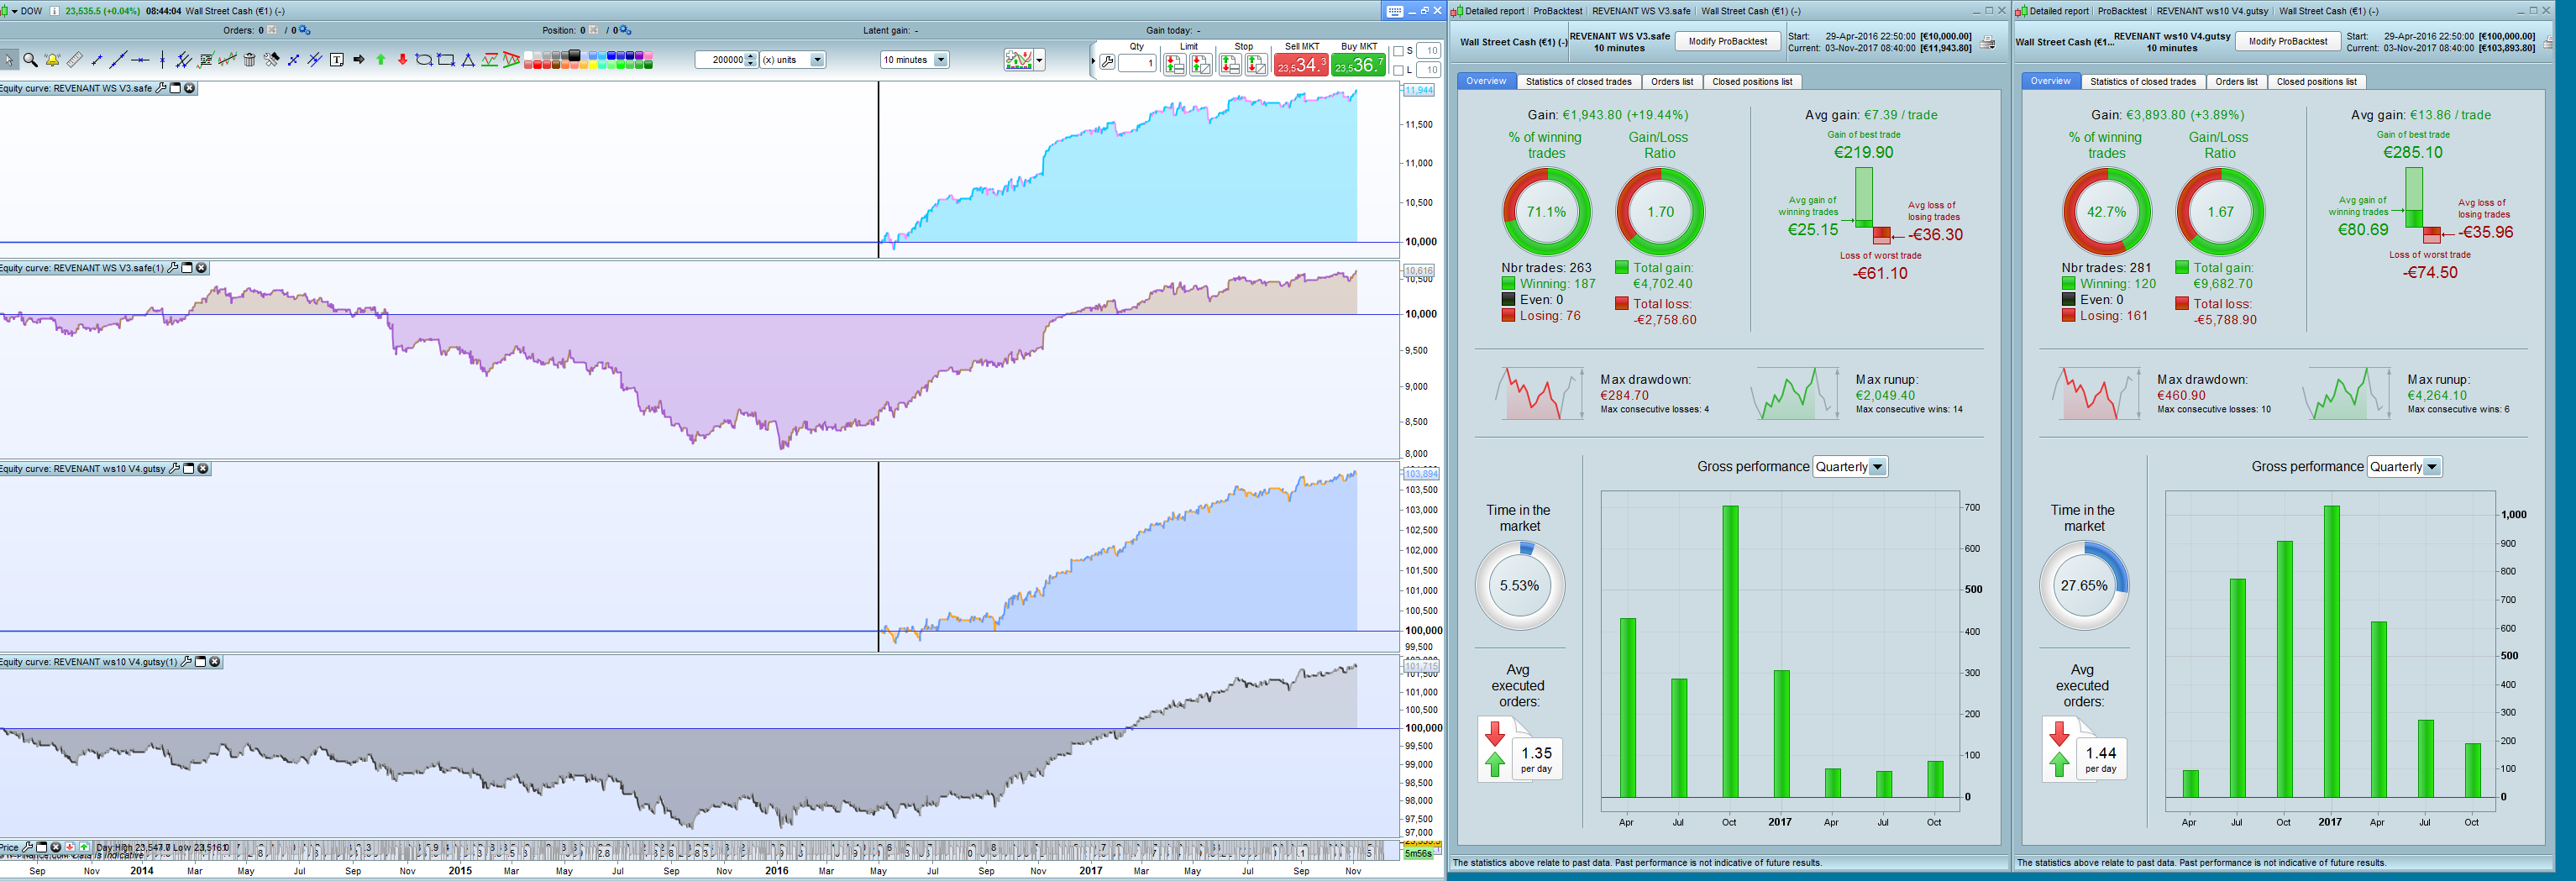
I created the systems with the standard 100K backtest (data from april 2016 -> November 2017) And they seemed amazing, i then put them on demo and they seemed to perform well so i started trading them live. Made a couple of hundred $ and so far the backtest seems to match with the live performance (been live about 3 weeks~)
Then i got the Premium account and i let these bad boys go through the 200K backtest… and the results where not what i was hoping for.
it turns out they both are more or less profitable from january 2016 and still making decent profits. I’ve stopped the systems for the moment, im not sure what if the 200K backtest results are so bad that the systems definitly should not be traded, or if its OK to trade them as long as they make profit? How do i define when they stop working tho…
I’ve added a photo of the 2 systems with 100K backtest and 200K so you can see for yourself.
The detailed reports are from 100K test. You can all see that the 200K detailed report would not look as pretty! 😀
Any reply is a good reply 🙂
I have done this before running them live:
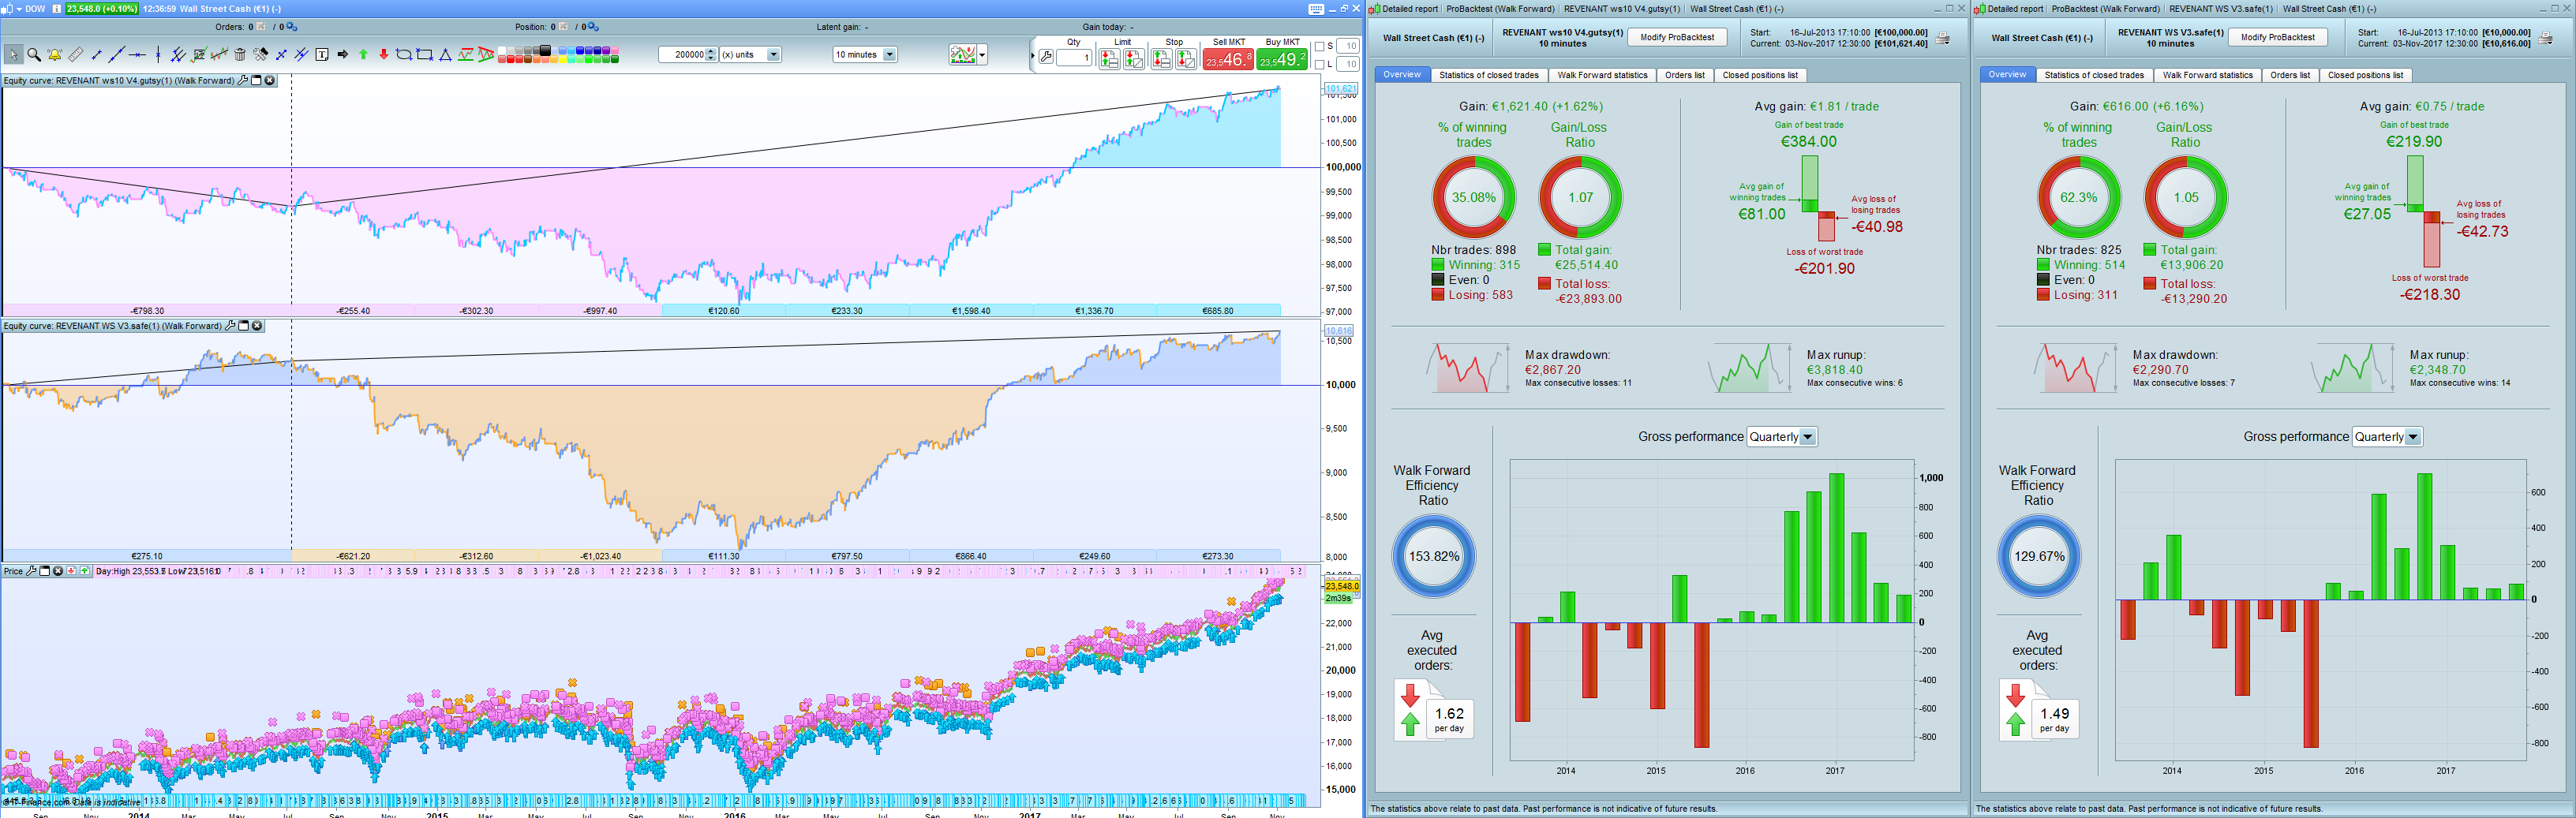
Walk forward
Monte Carlo (5000 tests, every EQ line very profitable and looking sexy, obviously not that much data to run test with only 100K backtest but..)
Monkey test (remove exit-strategy and say “exit after random amount of bars to check if entry is good or not)
Every test looked very good until i got the 200K bars data 😀
Did you run a WFA with 200K bars? If so can you post the results?
Great you use monte carlo simulation. The problem is only that if you use only curve fitted results as input the results are misleading. You should make a WFA and then run the monte carlo simulation only with the out of sample trades.
Thanks for the reply despair.
I have not done the monte carlo test with OOS numbers only. And yes Monte carlo test with “curve fitted” results dosnt tell me much, i was really happy with it during the 100K backtest, but now that i KNOW it is curve-fitted (ref the picture) im terrified..
Obviously with the 200K bars, as you can see, the numbers and tests would be completly different. The glorious strategy seems to be curve-fitted pretty rough.. Im not sure if i just need to abandon the idea completely, or if I should keep working on it..
When you guys start trading strategies on live account, do you need the 200K backtest to be profitable all the way from the start of the backtest? If not: how much/how many years should be positive and green?
This is my first strategy traded live so ANY experience would be VERY appreciated.
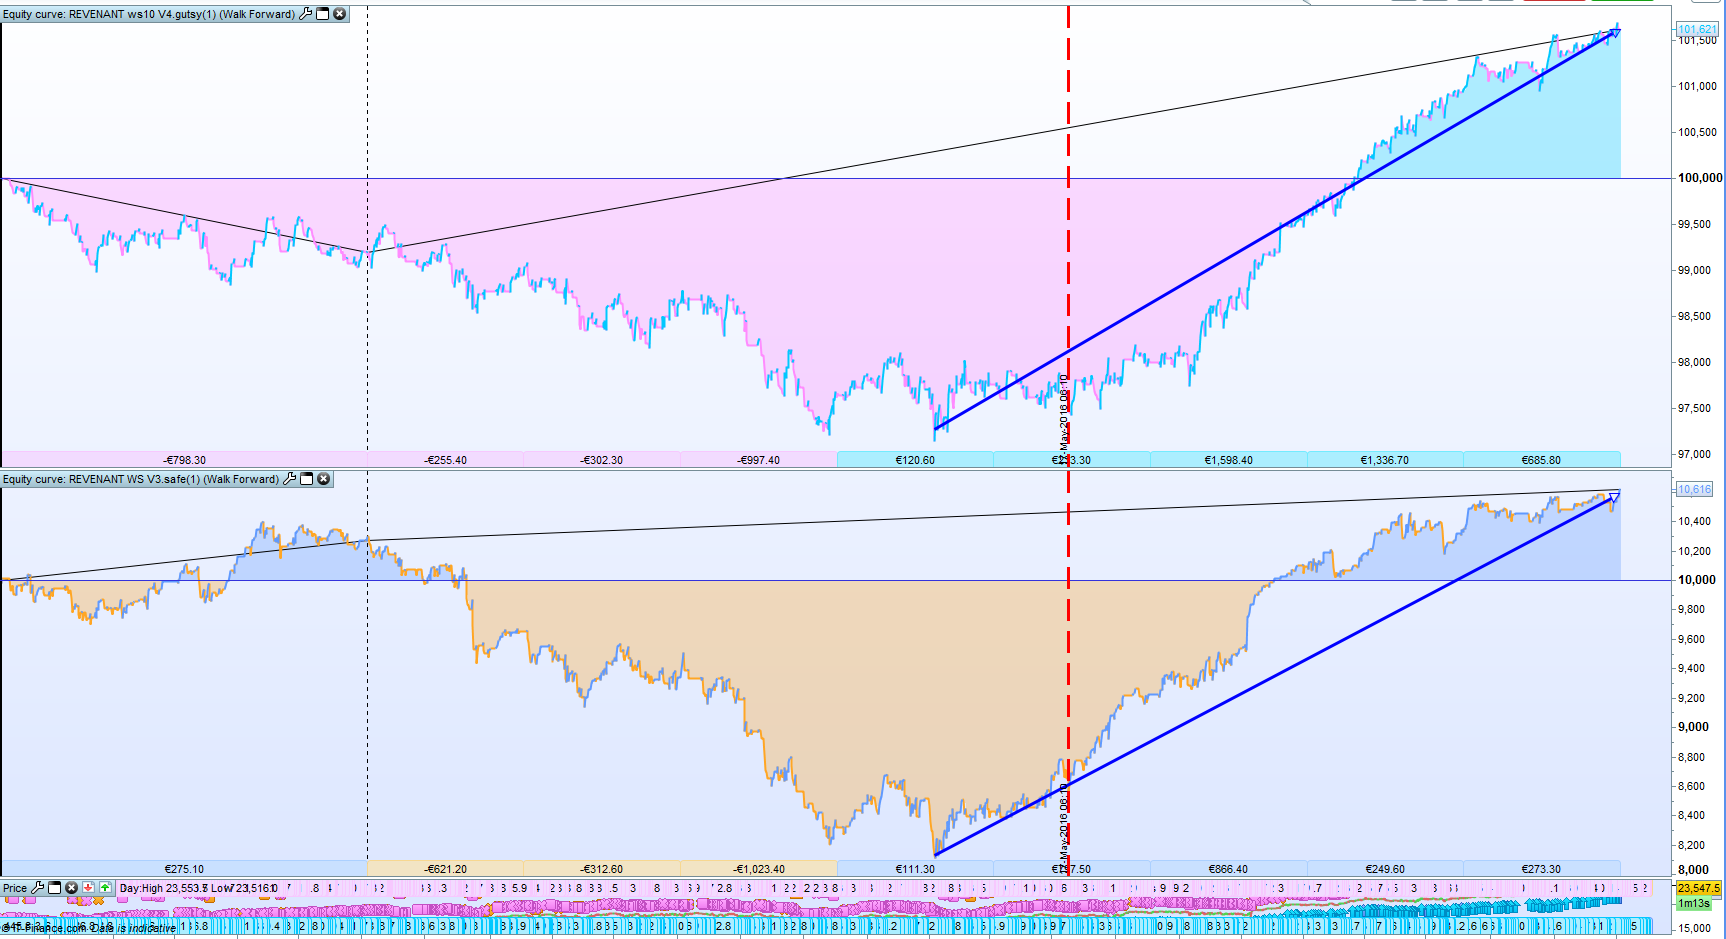
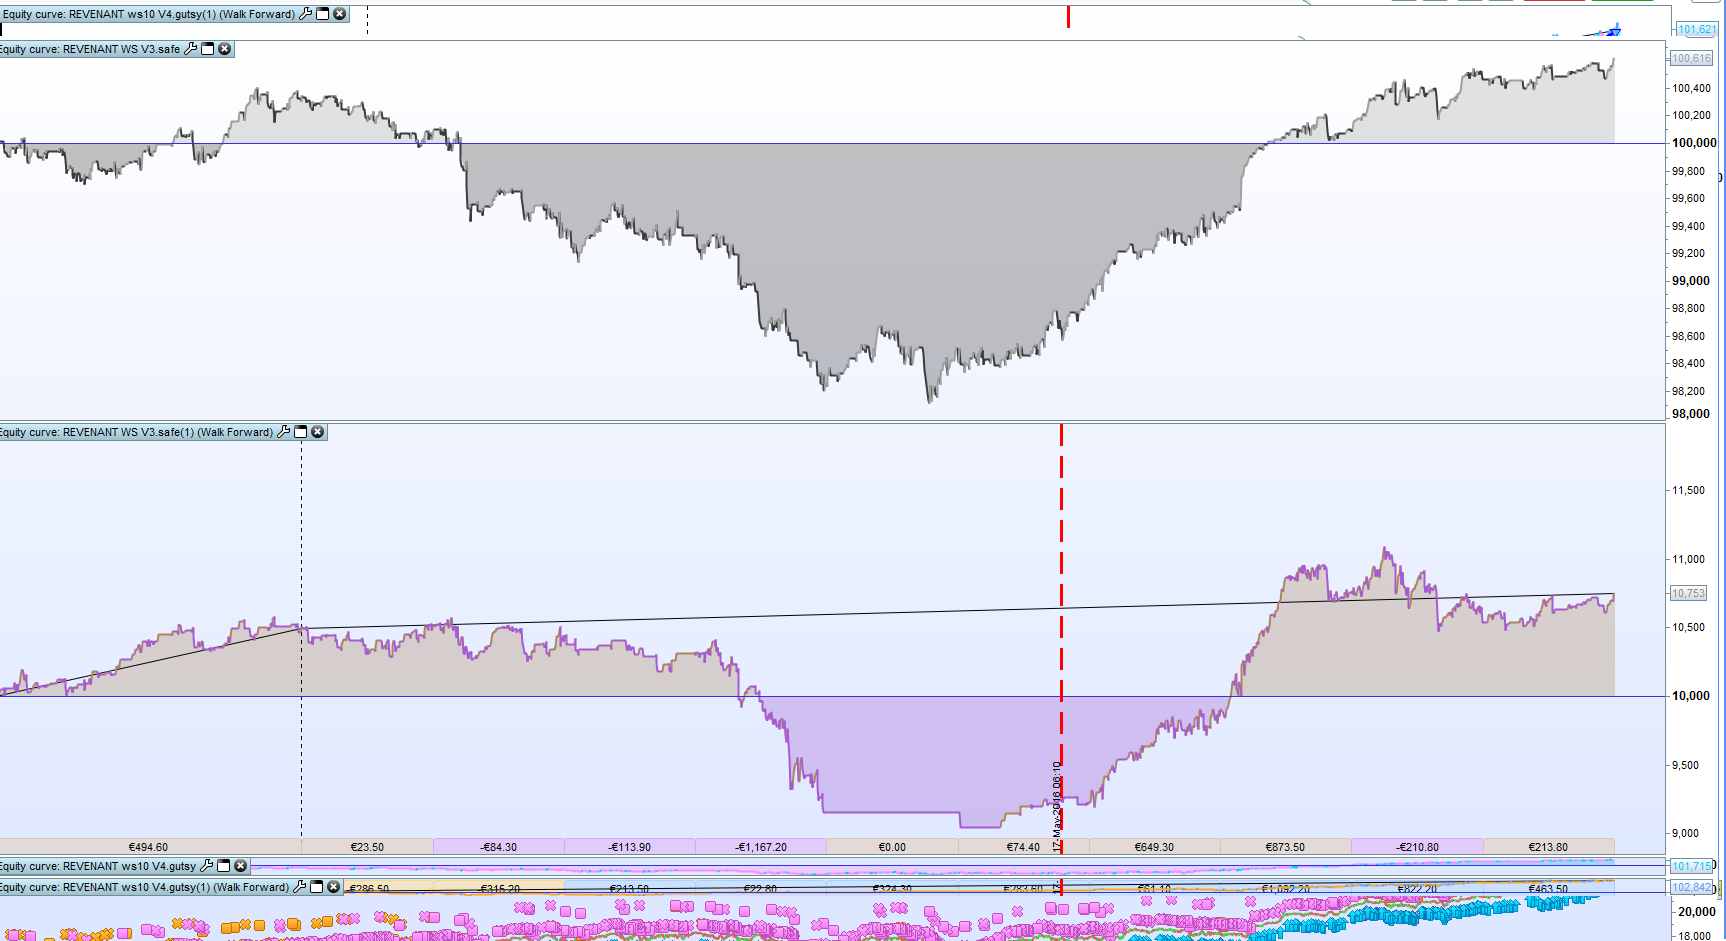
Sorry for the double post but i cant edit my comment, wanted to add this photo that might be a bit more clear. Blue line is just to show when it started to become profitable, and RED verticle line = where the data sample (100K bars PRT complete version) starts, and from there the system was created and optimized.
edit: Both systems have basicly the same entry, but different exits. both on 10m wall st. cfd
edit2: Despair, if i run the numbers for entire 200K backtest it would not be profitable, until 2016 it was definitly a loosing strategy. Question is: does it matter?
How much of the 200K backtest should be profitable and good`? 100%? 90%? 20%? Does it matter that much?
Another thought: This has been working out pretty good so far both live and demo, but is that just luck so far? Looking at the 200K backtesting it just looks soooo bad up until 2016…
Like I wrote above. Make a WFA with 200k bars and show the result. Also monte carlo with the OOS-trades is great and then you see much more.
Ive made the walk forward tests with dummy variable
Don’t you have any variables in your code? Obviously the code is not adapted for the whole period. Periodic re optimization might fix this.
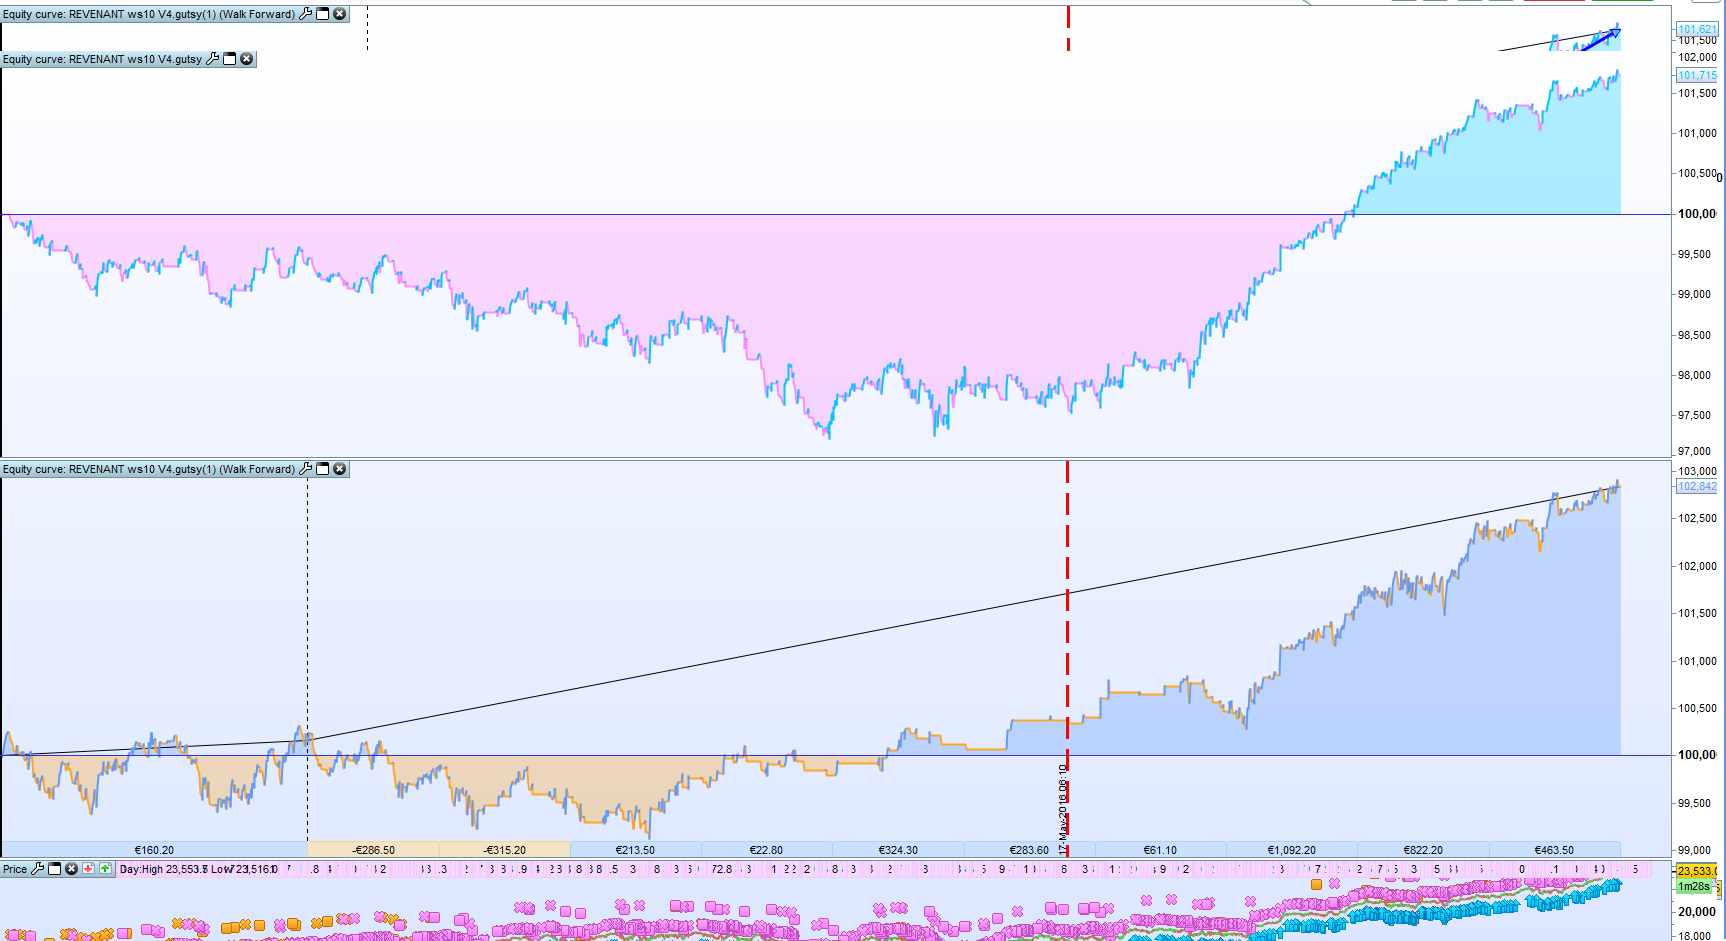
Oh of course Despair, i didnt connect the dots.. I’ve added 2 pictures of the system as it is + optimized version where i have 3 variables (entry) optimized very roughly.
As i’ve explained earlier this is 1 system for quick profits and 1 system for longer trends up. Both are Long only, and almost same entry, just different exits. (The one called “SAFE” is the one that takes quick profits and “GUTSY” is the one going for the trends..
Please let me know what you think about the results. Im fairly new to this still, so im not sure what to make of this.
Both looks better with optimized results, but… its not glorious or very pretty EQ curve..
The first one I think it is gutsy doesn’t look that bad. 🙂 It is usually smart to put a strategy for a few months on demo before you start live trading. So give it a try. You will see what happens.
Ill keep running it on demo, give it a month or two.