Wing
WingParticipant
Veteran
Hello.
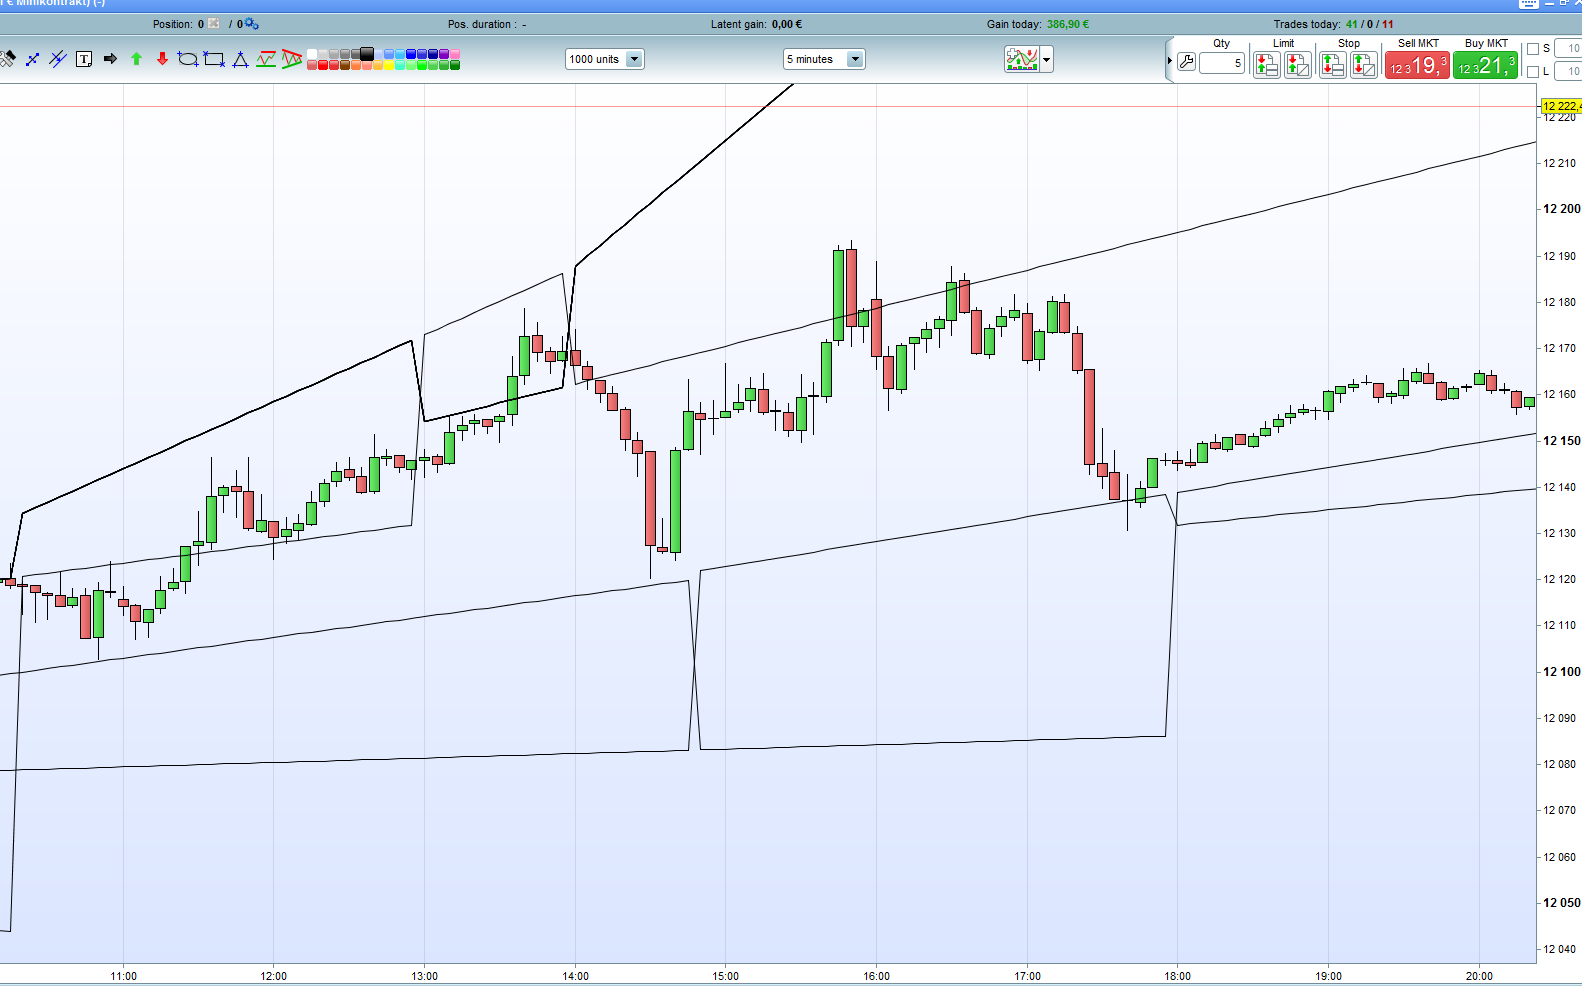
I thought I would make a thread for this indicator I submitted to the library. Details about it you can find here: https://www.prorealcode.com/prorealtime-indicators/wings-trend-lines/
A lot of people have asked about the trend lines included in ProRealTime, but you can’t access them in your strategies. Well, now you sort of can, or something even better.
If you want to discuss improvements or how to use for your trading (manual or automated) you can do that here.
If anyone wants to help, we could try to update the indicator to the 10.3 version. We should be able to draw the lines into the future, so they don’t just stop at the recent bar. Alternatively, we could also work on removing the ugly vertical changes of the lines when there is a trend shift. Improvements can also be made to the way that it draws lines, by basing them on something else than RSI. Combining this indicator with one that displays high/low/open/close of previous day, and one that is able to draw other important horizontal leves could have great potential. It would be a lot of levels though.
This is the main ‘indicator’ I use when I trade the DAX manually (100 tick TF). It has worked great for me. Sometimes you will be able draw trend lines too that the indicator can’t, and sometimes it draws indicators you would not have see yourself.
WingParticipant
Veteran
This is the code:
////////////////////////////////////////////////////
//
// Wing's Trend Lines - (Support and Resistance)
//
// Made by user "Wing" of ProRealCode.com
// https://www.prorealcode.com/user/wing/
//
//////////////////////////////////////////////////
//
// Parameter:

// p = 7 // 'lookback' / scale
// LinesDisplayed=12

//////////////////////////////////////////////////


rs=RSI[p]

once t1=0
once t2=0
once t3=0
once t4=0

once b1=0
once b2=0
once b3=0
once b4=0


once top=0

// Note that the numbers 1-2-3-4 may be corresponding to the default RSI parameter of 7. So that should perhaps be changed if you want different parameters

if rs[4]>70  and high[4]>high[3] and high[4]>high[2] and high[4]>high[1] and high[4]>high and top=0 then
t4=t3
t3=t2
t2=t1
t1=barindex-4
top=6
endif

if rs[4]<30  and low[4]<low[3] and low[4]<low[2] and low[4]<low[1] and low[4]<low and top=0 then
b4=b3
b3=b2
b2=b1
b1=barindex-4
top=6
endif

if top>0 then
top=top-1
endif

// tops

if high[barindex-t2]>high[barindex-t1] then
linet1=high[barindex-t2]-(((barindex-t2)*sqrt(square(high[barindex-t1]-high[barindex-t2])))/(t1-t2))
else
linet1=high[barindex-t2]+(((barindex-t2)*sqrt(square(high[barindex-t1]-high[barindex-t2])))/(t1-t2))
endif

if high[barindex-t3]>high[barindex-t2] then
linet2=high[barindex-t3]-(((barindex-t3)*sqrt(square(high[barindex-t2]-high[barindex-t3])))/(t2-t3))
else
linet2=high[barindex-t3]+(((barindex-t3)*sqrt(square(high[barindex-t2]-high[barindex-t3])))/(t2-t3))
endif

if high[barindex-t3]>high[barindex-t1] then
linet21=high[barindex-t3]-(((barindex-t3)*sqrt(square(high[barindex-t1]-high[barindex-t3])))/(t1-t3))
else
linet21=high[barindex-t3]+(((barindex-t3)*sqrt(square(high[barindex-t1]-high[barindex-t3])))/(t1-t3))
endif

if high[barindex-t4]>high[barindex-t1] then
linet3=high[barindex-t4]-(((barindex-t4)*sqrt(square(high[barindex-t1]-high[barindex-t4])))/(t1-t4))
else
linet3=high[barindex-t4]+(((barindex-t4)*sqrt(square(high[barindex-t1]-high[barindex-t4])))/(t1-t4))
endif

if high[barindex-t4]>high[barindex-t2] then
linet31=high[barindex-t4]-(((barindex-t4)*sqrt(square(high[barindex-t2]-high[barindex-t4])))/(t2-t4))
else
linet31=high[barindex-t4]+(((barindex-t4)*sqrt(square(high[barindex-t2]-high[barindex-t4])))/(t2-t4))
endif

if high[barindex-t4]>high[barindex-t3] then
linet32=high[barindex-t4]-(((barindex-t4)*sqrt(square(high[barindex-t3]-high[barindex-t4])))/(t3-t4))
else
linet32=high[barindex-t4]+(((barindex-t4)*sqrt(square(high[barindex-t3]-high[barindex-t4])))/(t3-t4))
endif

// bots

if low[barindex-b2]>low[barindex-b1] then
lineb1=low[barindex-b2]-(((barindex-t2)*sqrt(square(low[barindex-b1]-low[barindex-b2])))/(b1-b2))
else
lineb1=low[barindex-b2]+(((barindex-b2)*sqrt(square(low[barindex-b1]-low[barindex-b2])))/(b1-b2))
endif

if low[barindex-b3]>low[barindex-b2] then
lineb2=low[barindex-b3]-(((barindex-b3)*sqrt(square(low[barindex-b2]-low[barindex-b3])))/(b2-b3))
else
lineb2=low[barindex-b3]+(((barindex-b3)*sqrt(square(low[barindex-b2]-low[barindex-b3])))/(b2-b3))
endif

if low[barindex-b3]>low[barindex-b1] then
lineb21=low[barindex-b3]-(((barindex-b3)*sqrt(square(low[barindex-b1]-low[barindex-b3])))/(b1-b3))
else
lineb21=low[barindex-b3]+(((barindex-b3)*sqrt(square(low[barindex-b1]-low[barindex-b3])))/(b1-b3))
endif

if low[barindex-b4]>low[barindex-b1] then
lineb3=low[barindex-b4]-(((barindex-b4)*sqrt(square(low[barindex-b1]-low[barindex-b4])))/(b1-b4))
else
lineb3=low[barindex-b4]+(((barindex-b4)*sqrt(square(low[barindex-b1]-low[barindex-b4])))/(b1-b4))
endif

if low[barindex-b4]>low[barindex-b2] then
lineb31=low[barindex-b4]-(((barindex-b4)*sqrt(square(low[barindex-b2]-low[barindex-b4])))/(b2-b4))
else
lineb31=low[barindex-b4]+(((barindex-b4)*sqrt(square(low[barindex-b2]-low[barindex-b4])))/(b2-b4))
endif

if low[barindex-b4]>low[barindex-b3] then
lineb32=low[barindex-b4]-(((barindex-b4)*sqrt(square(low[barindex-b3]-low[barindex-b4])))/(b3-b4))
else
lineb32=low[barindex-b4]+(((barindex-b4)*sqrt(square(low[barindex-b3]-low[barindex-b4])))/(b3-b4))
endif


// return values

//resistance=(linet1+ linet2+ linet21+ linet3+ linet31+ linet32)/6
//support=(lineb1+ lineb2+ lineb21+ lineb3+ lineb31+ lineb32)/6

//midpoint=(resistance+support)/2

if linesdisplayed<12 then
lineb32=linet1
endif
if linesdisplayed<11 then
linet32=linet1
endif
if linesdisplayed<10 then
lineb31=linet1
endif
if linesdisplayed<9 then
linet31=linet1
endif
if linesdisplayed<8 then
lineb3=linet1
endif
if linesdisplayed<7 then
linet3=linet1
endif
if linesdisplayed<6 then
lineb21=linet1
endif
if linesdisplayed<5 then
linet21=linet1
endif
if linesdisplayed<4 then
lineb2=linet1
endif
if linesdisplayed<3 then
linet2=linet1
endif
if linesdisplayed<2 then
lineb1=linet1
endif


return linet1, linet2, linet21, linet3, linet31, linet32, lineb1, lineb2, lineb21, lineb3, lineb31, lineb32
@Wing the strategy I recently posted calculates trend lines based on the tangent trigonometry function. It works on the basis of using the bar count between two points as the opposite value and the point value as the adjacent value. I then calculate the angle using TAN(bar count/points). If needed you can also calculate the length of the diagonal line using Pythagorean theory (x2 + y2 = z2).