Hello,
i want to rebuild the RSI Indikator of ProRealtime in Java. The ProRealtime Example is very helpful:
REM Computes the daily variations

UP = MAX(0, close - close[1])
DOWN = MAX(0, close[1] - close)

REM Computes the moving average of gains on positive days
REM and losses on negative days

upMA = wilderAverage[p](UP)
downMA = wilderAverage[p](DOWN)

REM Now we can compute the RS

RS = upMA / downMA

REM And finally the RSI

myRSI = 100 - 100 / (1 + RS)

RETURN myRSI AS "Relative Strength Index"
But i dont know how to calculate the wilderAverage. What code/formula belongs to the wilderAverage?
Thank you for help!
Found this formula on Internet :
EMA formula = price today * K + EMA yesterday * (1-K) where K = 2 / (N+1)
Wilder EMA formula = price today * K + EMA yesterday (1-K) where K =1/N
Where N = the number of periods.
Hope it helps you.
Not really 🙁
Easy Example with 3 Candles:
Candle1: Close 4897
Candle2: Close 4934
Candle3: Close 4951
Value for Candle3
UP = MAX(0, close – close[1]) –> 4951 – 4934 –> 17
DOWN = MAX(0, close[1] – close) –> 4934 – 4951 –> -17
upMA = wilderAverage[p](UP) –> wilderAverage[1](17) –> 17
downMA = wilderAverage[p](DOWN) –> wilderAverage[1](-17) –> 0
upMA = wilderAverage[p](UP) –> wilderAverage[2](17) –> 20,87160 ???
downMA = wilderAverage[p](DOWN) –> wilderAverage[2](-17) –> 0,20206 ???
upMA = wilderAverage[p](UP) –> wilderAverage[3](17) –> 19,65567 ???
downMA = wilderAverage[p](DOWN) –> wilderAverage[3](-17) –> 0,71841 ???
I don’t get it…
The difference of the last two candle’s I have to put in the wilderAverage?
Maybe I can get the Code from ProRealtime as the RSI Example?
I’m curious, why do you want to rebuild it in Java?
I’m a customer of IG Markets. I trade with the java api from IG Markets. But i get the signals manually from ProRealtime (with IG Data). The IG api has the possibility to get candle Stick data. Therefore i want to automate the generation of signals.
Thats the reason why i need the correct calculation of RSI from ProRealtime in my java application. Specially the calculation of the wilderaverage…the rest calculation of RSI is easy and clear.
I hope you understand…if not i have to post it in German.
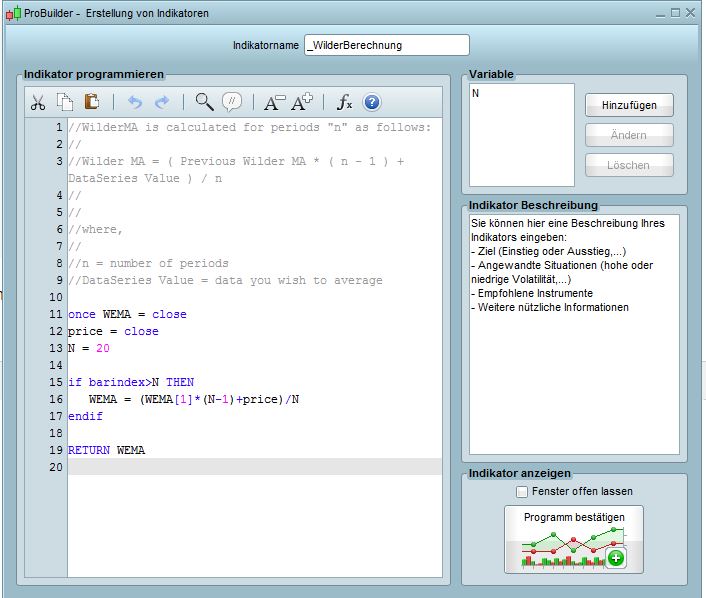
That’s ok, I finally found the good formula and successfully recoded the same formula as the PRT one, here is the code:
//WilderMA is calculated for periods "n" as follows:
//
//Wilder MA = ( Previous Wilder MA * ( n - 1 ) + DataSeries Value ) / n
//
//
//where,
//
//n = number of periods
//DataSeries Value = data you wish to average

once WEMA = close
price = close
N = 20

if barindex>N THEN
 WEMA = (WEMA[1]*(N-1)+price)/N
endif

RETURN WEMA
I dont get it 🙁
here is my code to check the wilderAverage (its form the RSI example)
REM Computes the daily variations

UP = MAX(0, close - close[1])
DOWN = MAX(0, close[1] - close)

REM Computes the moving average of gains on positive days
REM and losses on negative days

upMA = wilderAverage[p](UP)
downMA = wilderAverage[p](DOWN)

RETURN upMA,downMA
Your code returns different values. I think the wilderAverage of ProRealtime returns the differents between the close prices, but i dont know how they are calculate…
Thanks for help!
The code I gave you return exactly the same values as the one of the platform, did you try it at least?
I know it’s a really old post.
Anyway I’ll add the RSI with wilderAverage recoded here for people who will need that:
up = max(0, close - close[1])
dn = max(0, close[1] - close)

once mmUp = 0
once mmDn = 0

if barindex>1 then
   // wilderAverage formulas
   mmUp = mmUp[1] + (up - mmUp[1])/p
   mmDn = mmDn[1] + (dn - mmDn[1])/p
endif

rs = mmUp / mmDn
rsindex = 100 - 100 / (1 + rs)

return rsindex as "Relative Strength Index"
It needs some bars to converge to the PRT RSI indicator.