Bard
BardParticipant
Master
Hi,
Wasn’t there a way to add indicators on View Performance Chart (live Demo) so you could see if your system is taking trades correctly? You could on v.10.2.
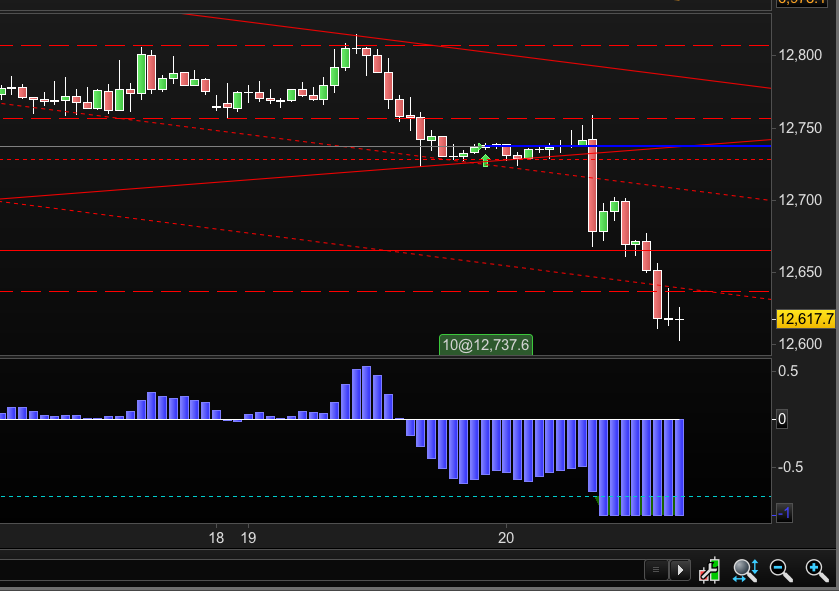
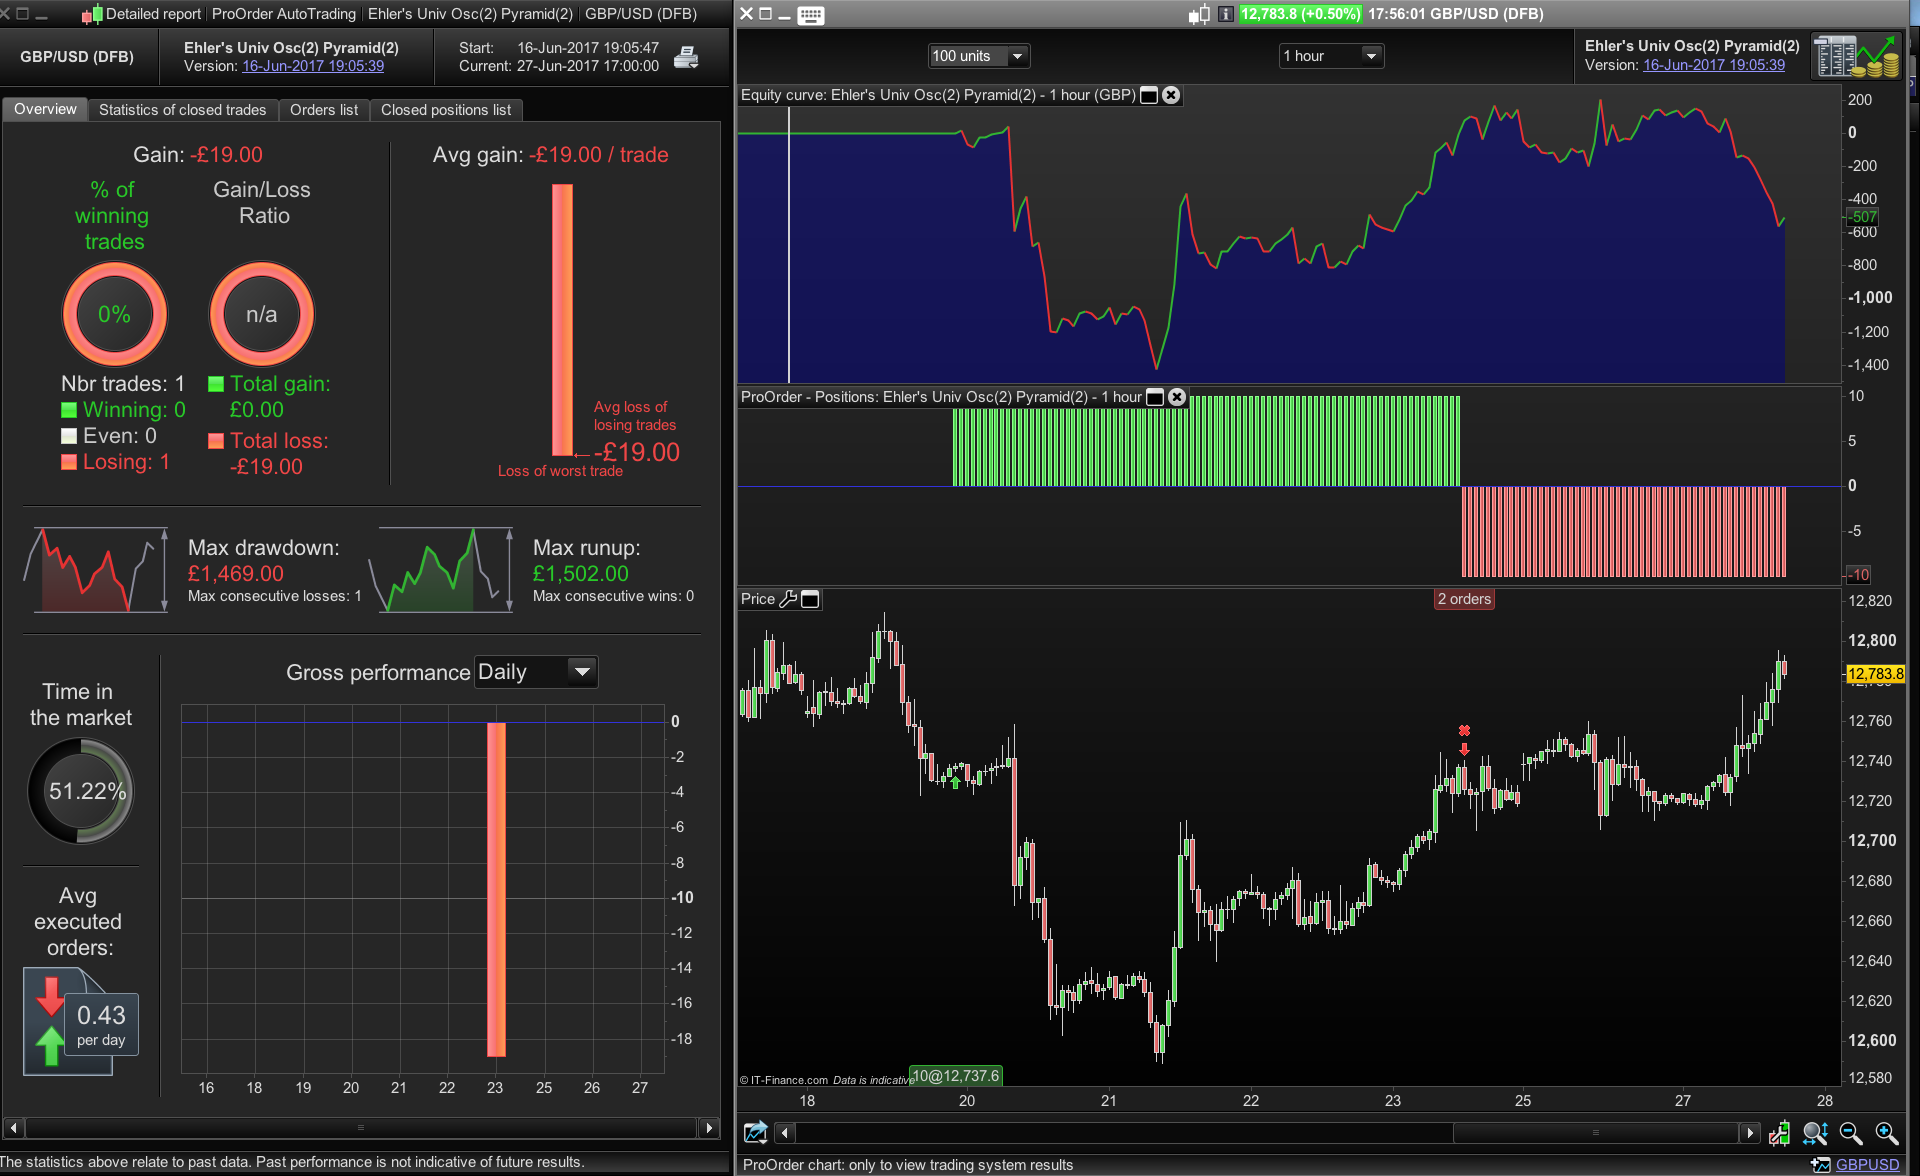
Can anyone see why this trade in the screen shot below (for the £/$ 1 Hour Chart) was taken, the Univ Osc condition of >-0.8 has to be on the condition that you’re already in a first position?
Cheers
Bard
Hey,
About the trade: double check your time settings if they are the same as “standard servertime”. That happens way too often.
Also, you can confirm that the conditions for entering into trade 1 where not met at this point in time or that there was no position already on?
Hi Bard
I’ve never thought to add indicators onto the ‘View Performance’ chart but have just checked now and yeh the option is greyed out to add indicators
Recently I have been trying out running the strategy in parallel ‘backtesting’ it alongside the live trade on a new chart by setting the start date of the back test to the same time I just kicked off the live strategy which has the bonus of not only the indicators on the chart but also being able to see whichever variables I want using GRAPH – only problem is sometimes I can’t match up the start time of the ‘backtest’ accurately to the actual live running strategy but on the whole it has been very helpful to see how things are running
Would be great if could have indicators and GRAPH function on live running strategies/View Performance charts! (another one for the overflowing suggestions thread…)
BardParticipant
Master
Hi Derek,
Thanks, do you know what time “standard servertime” is? My settings are London UTC +1 British Summertime (and what a summertime it’s recently been!)
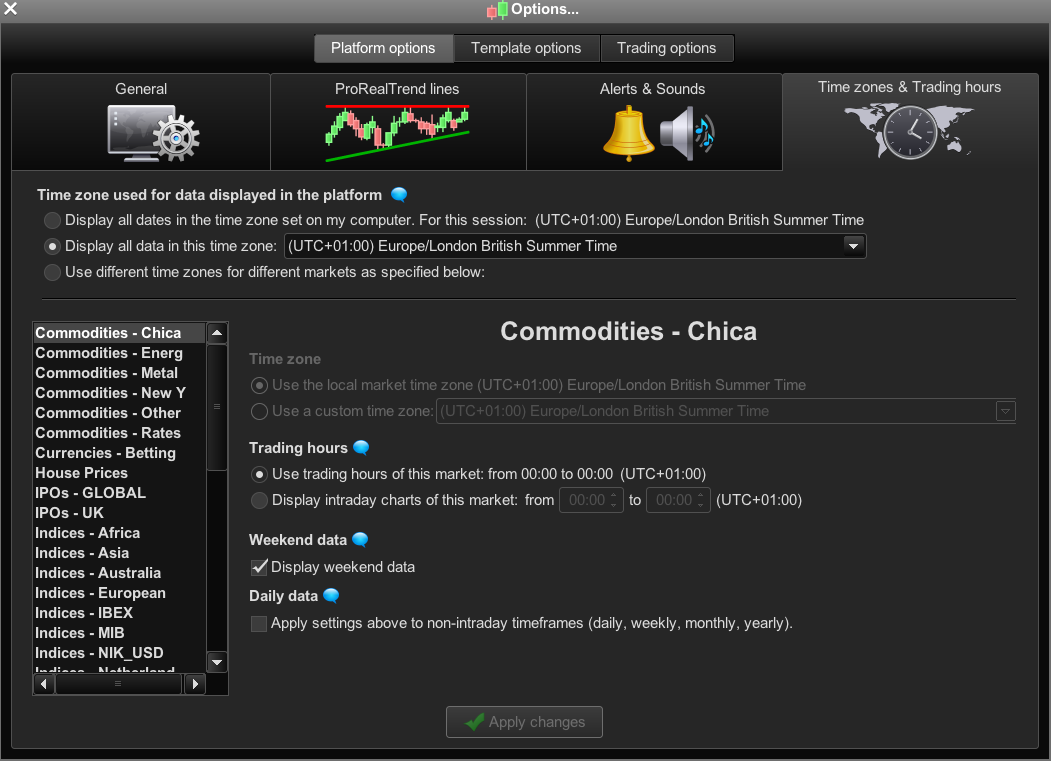
Should I be using different timezones for different markets, eg if I’m trading US Stock Indexes, should I set it too “use different timezones” (pls see screenshot).
I was wondering what would be the point of setting it to US Indices if I’m based near London and using IG Index UK as the Dow index for example trades pretty much 24 hrs a day?
Cheers Bard
Thanks for the screenshot. I need to correct myself.
It basically means that you leave the trading hours and the weekend data untouched to test and trade a strategy. The server does not use your individual settings concerning these two.
From your screenshot I can see that this not the case since there are no markets names written in italic.
Can you show a bit more of your strategy to look into this?
BardParticipant
Master
Hi MaxT,
Re: The original post screenshot of the Ehlers Oscillator 0.8 threshold for trade entries must have had a higher Bandedge setting (like 50), than the Strategy that was launched with a Bandedge of 25.
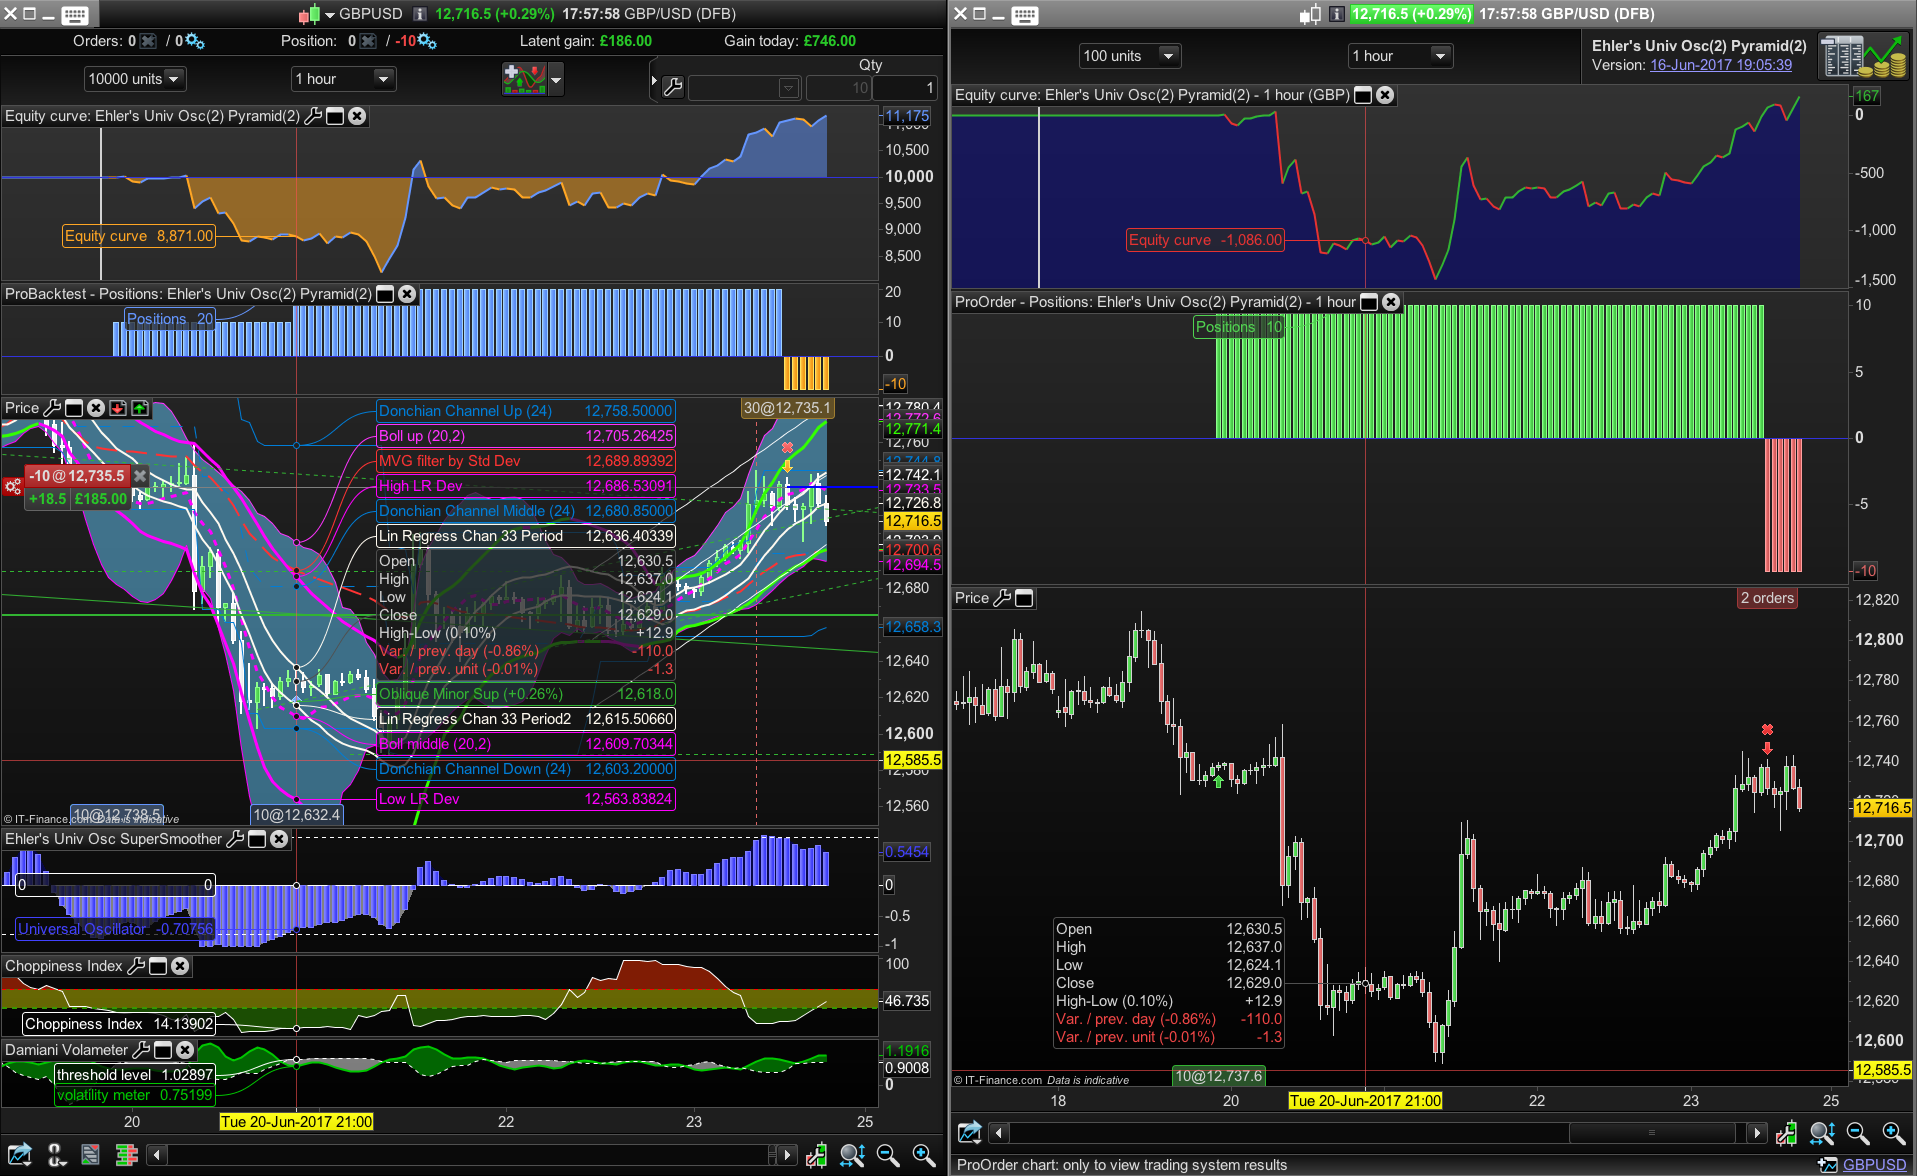
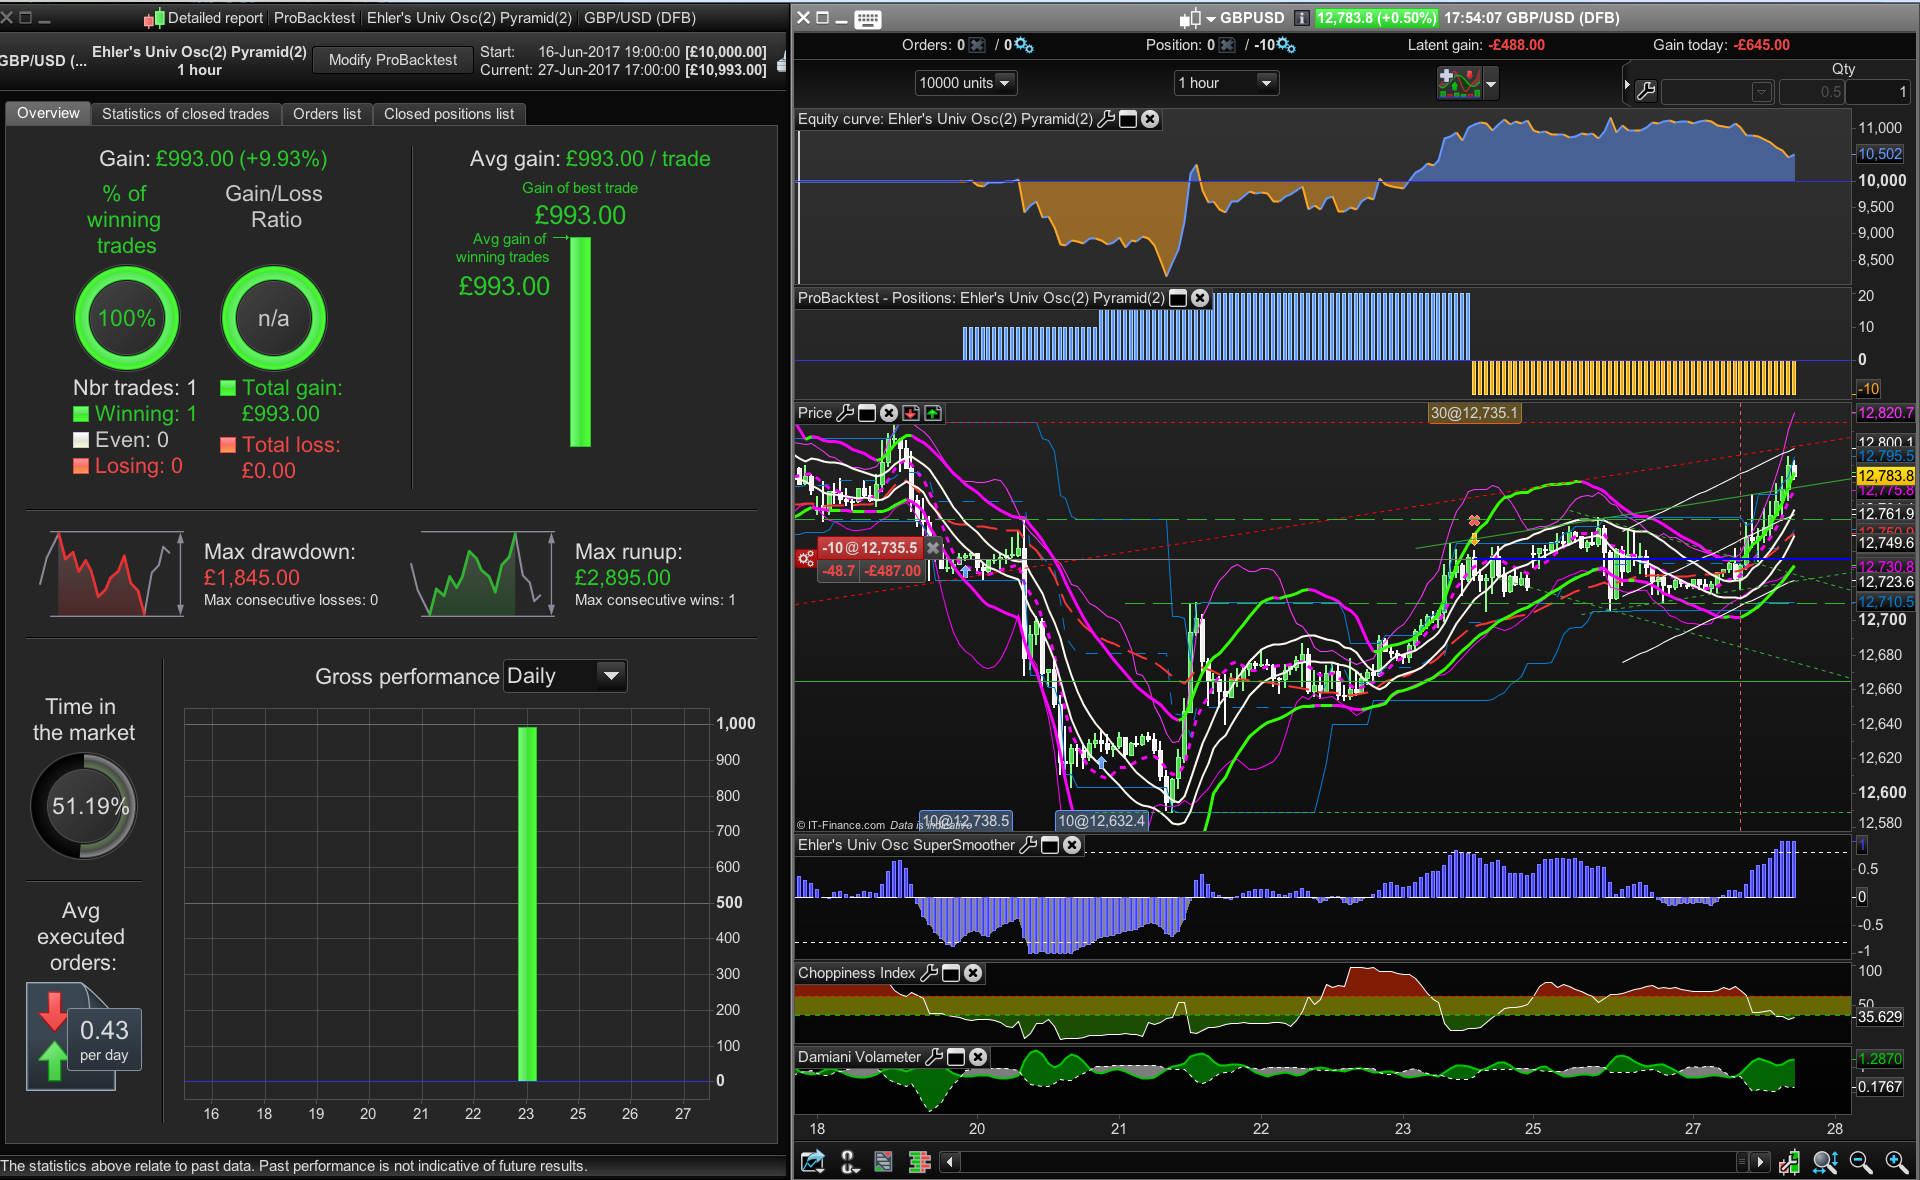
Thanks for the backtest v’s live performance chart tip, appreciated. The thing is when I do that and run the backtest from 19/06/17 22.00hrs (launch date) I get a £1027 profit and if I look at the View Performance it ‘s down £19. The reason being is that the £1k profit was made from 2 positions (£10/tic for both the first trade and then the 2nd position).
When I look at the View Performance it hasn’t taken the 2nd position which is where the profit was generated on the backtest. I’m still trying to figure out if there were any differences between my PRT live running strategy so it wouldn’t take that second position but can’t see anything of significance.
The currently live system (which only took one trade) had a Choppiness Index indicator attached which was striked out with “//” for all but one line of code that still had a c2 second condition for the Chop Index on the short side but when I fully striked out all traces of that Chop Index short trade code it produced exactly the same result over all available data as the currently live strategy (with the mistakenly left in short side Chop Index code)).
// Conditions to enter short positions
indicator1, ignored = CALL "Ehler's Univ Osc SuperSmoother"
c1 = (indicator1 CROSSES UNDER 0.8)

indicator2 = CALL "Choppiness Index"
c2 = (indicator2 <= 61.8)

IF c1 AND c2 THEN
SELLSHORT 10 PERPOINT AT MARKET
ENDIF
The strategy is here below – I wouldn’t trade it live without oversight, the Oscillator can produce some stunning results (even up to 12 years on some daily instruments) but like other Oscillators this signal is not immune to being swamped by the trend. I’ve been testing it with some other trend filters eg Ehler’s Frama, and will also be looking at, 150 day highs/lows, Donchian Channels, MACD, ADX etc) so it takes long positions only when a long filter signal is given. If anyone has any suggestions feel free to add them here. The more parameters – the more likely it will not produce better results than backtests. This Ehler’s Universal Supersmoother Oscillator (the code is on this forum) has a Bandedge of 25.
Cheers
Bard
// Definition of code parameters
DEFPARAM CumulateOrders = TRUE // Cumulating positions deactivated

// Conditions to enter long positions
indicator1, ignored = CALL "Ehler's Univ Osc SuperSmoother"
c1 = (indicator1 CROSSES OVER -0.8)

IF c1 THEN
BUY 10 PERPOINT AT MARKET
ENDIF

// Conditions to enter extra long positions

//second order

c3 = (indicator1 > -0.8)

IF Close-TRADEPRICE(1)>30 AND LongOnMarket AND COUNTOFPOSITION = 1 AND c3 THEN
BUY 10 CONTRACTS AT MARKET
ENDIF

//third order
IF Close-TRADEPRICE(1)>60 AND LongOnMarket AND COUNTOFPOSITION = 2 AND c3 THEN
BUY 10 CONTRACTS AT MARKET
ENDIF

//——————————————————----------------------------------------------//

// Conditions to enter short positions
indicator1, ignored = CALL "Ehler's Univ Osc SuperSmoother"
c1 = (indicator1 CROSSES UNDER 0.8)

IF c1 AND c2 THEN
SELLSHORT 10 PERPOINT AT MARKET
ENDIF

// Conditions to enter extra short positions

//second order

c3 = (indicator1 < 0.8)

IF Close-TRADEPRICE(1)<30 AND ShortOnMarket AND COUNTOFPOSITION = 1 AND c3 THEN
SELLSHORT 10 CONTRACTS AT MARKET
ENDIF

//third order
IF Close-TRADEPRICE(1)<60 AND ShortOnMarket AND COUNTOFPOSITION = 2 AND c3 THEN
SELLSHORT 10 CONTRACTS AT MARKET
ENDIF
BardParticipant
Master
Cheers Derek, could you elaborate a little I wasn’t quite clear on “you leave the trading hours and the weekend data untouched”? Are my timezone settings correct?
If you look at my reply to MaxT, the strategy is included and my reasoning as to why the Ehler’s -0.8 screenshot doesn’t show the conditions of a cross over at -0.8 being met. (wrong oscillator bandedge setting).
Thanks
Bard
Hey thanks Bard for sharing, I’m just testing. Below is missing, starting at Line 32 of your above code …
indicator2 = CALL "Choppiness Index"
c2 = (indicator2 <= 61.8)
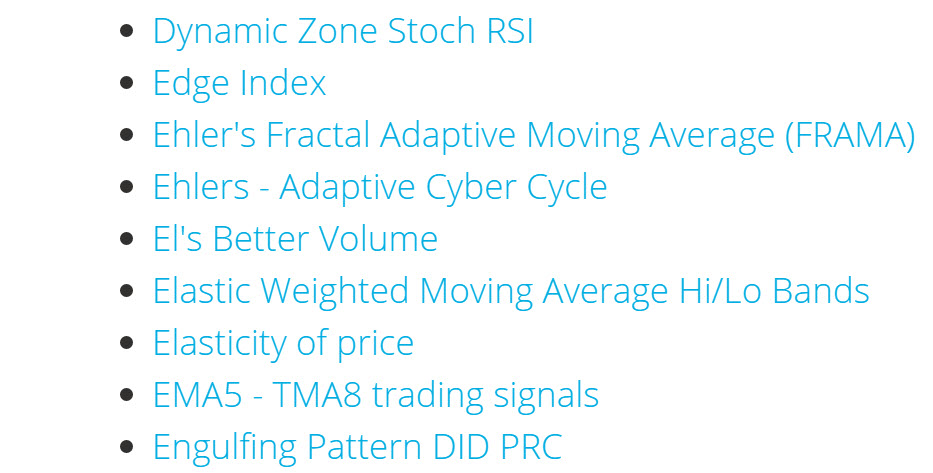
Mmm can’t find Ehler’s Univ Osc SuperSmoother in the Library … see attached? Am I missing something?
Thanks
GraHal
BardParticipant
Master
Hello GraHal, the Chop Index isn’t missing from my strategy above, I had included it when backtesting, but it tested better without the Chop indicator so I striked it out with “//” in my strategy code in PRT and (nearly) removed all references to it in the post above but I forgot to remove the AND c2 in the code for the short trades.
Having noticed it still had that section of code you posted above when I finally fully stripped out all reference to the Chop Index it made no difference to the profit results.
Here’s the Ehler’s Universal Oscillator link for you: (it is in the search results if you type “Ehler’s” – 8th result)
https://www.prorealcode.com/prorealtime-indicators/universal-oscillator-john-ehlers/
Cheers
Bard
Deleted cos answered above, thank you The Bard! 🙂
I’ll have a play including the Choppiness Index … all good practice and might spin-off into another Bot of mine in the future!
Cheers
GraHal
PS The Bard was Shakespeare, but you know that! 🙂
BardParticipant
Master
Also worth having a look at the Damiani Indicator or the McEwan’s Volatility Switch.
I didn’t know you can delete comments. Where/how do you do that, I only see edit/reply etc ?
I know! It was a nickname when I used to write/play music. Have a good weekend.
Click Edit then delete unwanted text but then the post is left blank after submit so I usually try a bit of humour! 🙂
Thanks, I located the Damian, is the McEwan’s Volatility Switch in the Library under another name?
What instrument(s) do you play?
If weekend data is ticked off, results from backtest to live system can differ. Same with the individual trading hours of the instrument. But that’s not your problem as your screenshot shows.
The timezone setting does not affect live results, AFAIK. So, I tried to find another explanation from the different screenshot but I can’t really see with all that many things going on. Can you send screenshots with price, oscillator and trade location and position size only?
BardParticipant
Master
Cheers GraHal,
You’re right it doesn’t show up but I found that indicator by removing the McEwan surname: https://www.prorealcode.com/prorealtime-indicators/volatility-switch-indicator/
I played guitar & keyboards/sampler in bands way back, but nowadays I mainly play guitar. Did you ever pick up an instrument?
BardParticipant
Master
Thanks for the explanation Derek,
The “strategy” code is posted above (pls ignore/delete the Short side “AND C2”) and the screenshots are below (View Performance v’s Backtest). Both start at 19.00pm on the 16th June, London hours, £/$ DFB, 1 Hour.
The main issue is why the live strategy (View Performance) didn’t take second of the three trades towards the end of the 20th June at the bottom of the market as it has done on the back test.
The Universal Osc Bandedge was set at 25 (but in my very first post was probably accidentally set at 50 hence the crossover not happening despite a trade being taken). I’ve posted it below for convenience.
Cheers,
Bard
bandedge= 25
whitenoise= (Close - Close[2])/2

if barindex>bandedge then
 // super smoother filter
 a1= Exp(-1.414 * 3.14159 / bandedge)
 b1= 2*a1 * Cos(1.414*180 /bandedge)
 c2= b1
 c3= -a1 * a1
 c1= 1 - c2 - c3
 filt= c1 * (whitenoise + whitenoise[1])/2 + c2*filt[1] + c3*filt[1]

 filt1 = filt

 if ABS(filt1)>pk[1] then
  pk = ABS(filt1)
 else
  pk = 0.991 * pk[1]
 endif

 if pk=0 then
  denom = -1
 else
  denom = pk
 endif

 if denom = -1 then
  result = result[1]
 else
  result = filt1/pk
 endif
endif

RETURN result COLOURED(66,66,255) as "Universal Oscillator", 0 as "0"