There is a command called “Line” in the command list f(x), when an indicator is coded. But I find nothing in the language documentation. Does anyone know how this command is used and what the parameters are ?
Or, is there a simple way or a simple command that allows calculation of a straight line between two points in an automatic trading system ?
For example, in a 1 second chart, I’d have two points, price = 20000 at Time = 100000, and price = 20100 at Time = 101010, and I want to calculate the value of this line at the current time. Is there a simple command to do this or do I have to calculate the line manually, for example using the Unix time stamp “timestamp” and then calculating the slope of a line between the two points ?
Thank you for any recommendations.
I do not want to draw a line into a chart, but I want to calculate the current value of any line between 2 points in a trading system.
I mean this command called “line” :
To calculate the 2 points you need barindex and price and then use those to draw or calculate the line between them by subrtacting the 2 numbers from eatch point from the other point 😛
I have just written some small code for a 1 second chart that calculates a line between 2 points of (Price1, Time1) and (Price2, Time2) and returns all values of this line, when time is larger than Time2. Does anyone know a simpler way to do this ?
If TIME = Time1 then
TS1 = timestamp
Endif

If TIME = Time2 then
TS2 = timestamp
Endif

If TIME > Zeitpunkt2 then
Slope = (Price2 - Price1) / (TS2-TS1)

valuenow = Price1 + (slope * (timestamp - TS1))
else
valuenow = close
endif

Return valuenow
To calculate the 2 points you need barindex and price and then use those to draw or calculate the line between them by subrtacting the 2 numbers from eatch point from the other point 😛
You can’t do this in a 1 second chart, because there is no new bar at every given second. For many seconds, no bar is shown and barindex does not rise. So you must count the seconds instead of barindex.😛😛😛
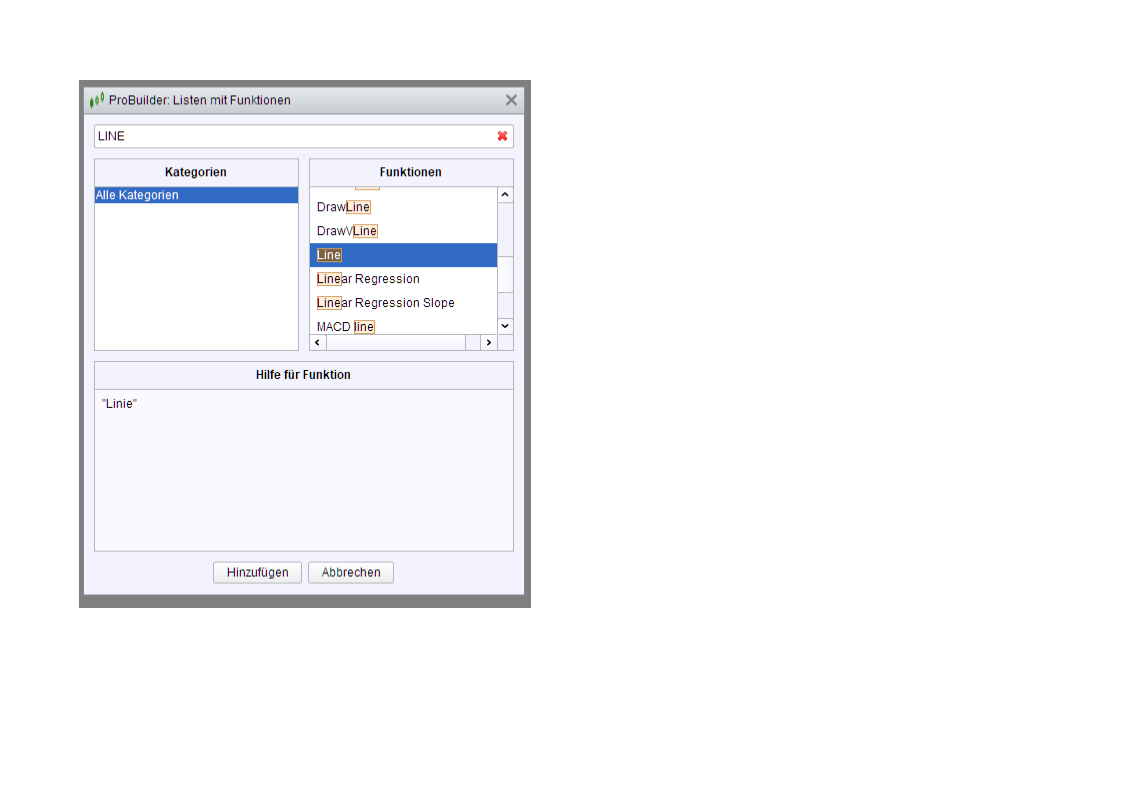
So nobody knows what this obscure command “line” means ?
Hi…
In the code editor, choosing the ‘All Categories’ via the ‘fx’ icon, brings up a list of available functions.
Some of these functions are indicator functions and some are the Probuilder Keywords.
These keywords sometimes take a limited set of pre-determined value’s, these also appear in the list.
When you look at the ‘fx’ comments for ‘LINE’ , it states, “Line” style.
If you use drawing keywords like, DRAWLINE(x1,y1,x2,y2) you can add following additional parameters after, Coloured(r,g,b,a), Style(Type,Thickness)
In the ‘Style’ syntax, ‘Line’ is the option value of the ‘Type’ of line drawn, ‘Line’ refers to a full/ continuous line.
https://www.prorealcode.com/documentation/style/
Thank you very much. I did a search in the documentation, but “line” did not show up. Thanks again.
Following the STYLE documentation link.
Under the heading, ‘Styling Options Available:’
‘LINE’ is the first option, it also states that it is the default style.
This is why all lines appear with this style even if the ‘STYLE’ keyword is not used.
PRC
Regarding the search, you are right that ‘Line’ doesn’t appear with the general search.
The general search doesn’t appear to search the Help/ProBuilder Language Documentation.
‘Line’ doesn’t appear if using Help/ProBuilder Language Documentation search feature either.
PRT
‘Line’ does appear if you use the function search from the code editor however, with the cryptic comment.
Manual
It does appear in the Glossary of keyword on Page 58.
https://assets.prorealtime.com/pdfs/en/probuilder.1718e2f6.pdf
I have seen the LINE command you are talking about, but there’s no instruction, nor indicators, with that exact name. It’s been highlighted being a reserved keyword to be used with the instructio STYLE, as druby said, just to make sure everyone knows it’s a reserved name not to be used to name a variable.
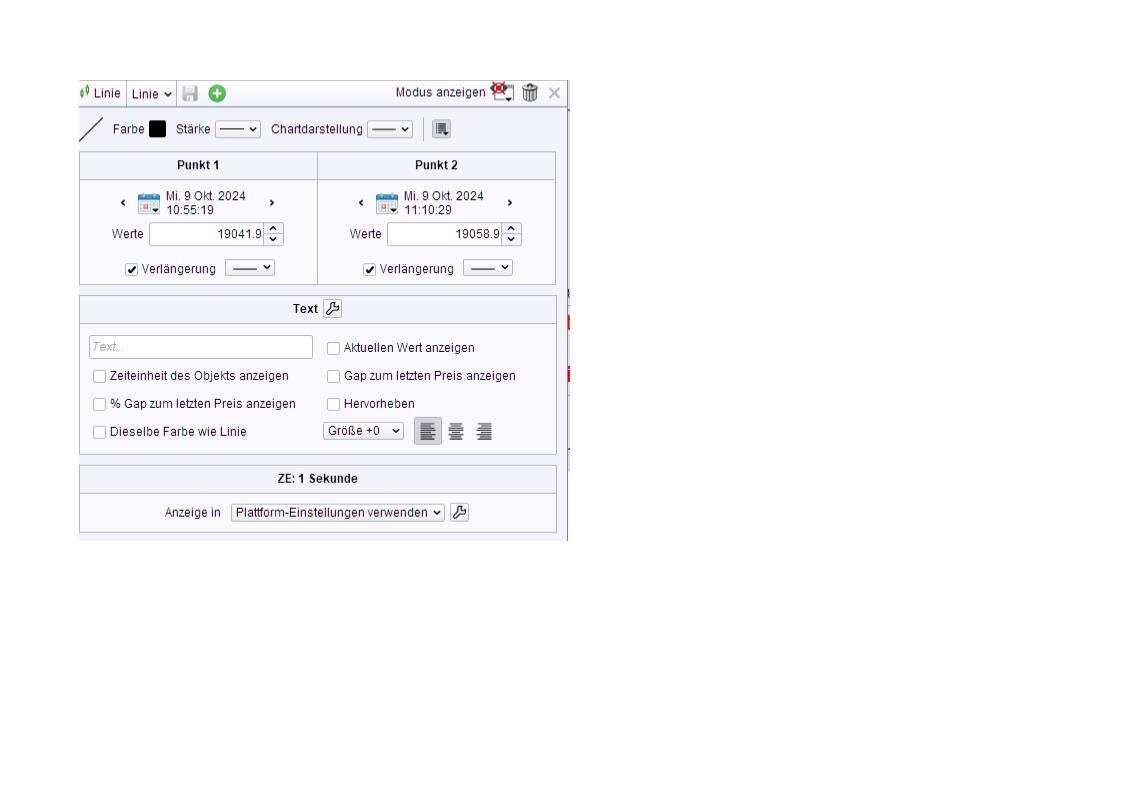
I made a mistake in the code for the calculation of a line between 2 points in a 1 second chart. When you read the 2 points from a line you have manually drawn in a chart, not “Time” has to be taken for the description of the time of a certain point, but “Opentime”, which is the time at the opening of a bar. It is “opentime” what the box for details of a line shows (see image), not the time at the closing of a bar.
So the code should read as follows :
Time1 = 105519
Price1 = 19041.9
Time2 = 111029
Price2 = 19058.9

If Opentime = Time1 then
TS1 = timestamp
Endif

If Opentime = Time2 then
TS2 = timestamp
Slope = (Price2 - Price1) / (TS2-TS1)
Endif

If TIME > Time2 then
valuenow = Price1 + (slope * (timestamp - TS1))
else
valuenow = close
endif

Return valuenow
This code delivers the future points of a line manually drawn in a 1 second chart (see image), after the time of point 2. Before this time, the line can of course not be calculated, and therefore I have set all values before TIME2 to “close”.
“valuenow” can be used in an automatic trading system for the current value of this line you have drawn before in a chart.