Out of interest – what settings are you running on that SuperTrend on the 4HR chart?
Out of interest – what settings are you running on that SuperTrend on the 4HR chart?
[1.9, 10], as the image says on the upper left. The ATR component looks 10 periods back, and the supertrend line is 1.9 * ATR away from the medianprice, roughly spoken.
[1.9, 10], as the image says on the upper left.
Sorry should have seen that – I think I need new glasses!
You should have a look at this customized Supertrend
You should have a look at this customized Supertrend
I have tried out most of these variants, but the standard supertrend with ATR usually gives best results in simple systems that trade long and short from supertrend cut to supertrend cut. This criterion is usually a good first selection.
In addition, manual supertrends run slowly and decelerate backtests a lot.
The only real advantage I have ever found in a customized supertrend was to leave the volatility component (ATR or STD) away entirely, and replace it by a fixed amount of points – or better a fixed fraction of current price. Sometimes, especially when you do long backtests over 10 years with DAX prices ranging from 4.000 to 13.500, this gives better results. See the following example.
ONCE direction = 1
ONCE STlongold = 0
ONCE STshortold = 1000000000000

indicator1 = medianprice

indicator3 = close

indicator2 = indicator3 * factor

STlong = indicator1 - indicator2

STshort = indicator1 + indicator2

If direction = 1 and STlong < STlongold then
STlong = STlongold
endif

If direction = -1 and STshort > STshortold then
STshort = STshortold
endif

If direction = 1 and indicator3 crosses under STlong then
direction = -1
endif

If direction = -1 and indicator3 crosses over STshort then
direction = 1
endif

STlongold = STlong

STshortold = STshort

If direction = 1 then
ST = STlong
else
ST = STshort
endif

Return ST coloured by direction as "Supertrend"
The parameter “factor” in line 9 changes the distance of the supertrend line from the last highest or lowest medianprice. It sets the distance to a fraction of the current “close” value. Try 0.005 as an initial setting, but of course it depends on the time scale and on the instrument you are looking at.
This supertrend will not move closer to the price in sideward movements (like the normal supertrend), when volatility decreases, but will stay constant all the time, as long as price does not change.
This version is also quite well optimized for speed.
That is an interesting new look at SuperTrend. I wasn’t getting any colour with the way the code is written. Never seen ‘coloured as’ before? So I changed it slightly. You should maybe put it in the library for others to consider using.
ONCE direction = 1
ONCE STlongold = 0
ONCE STshortold = 1000000000000
factor = 0.005

indicator1 = medianprice

indicator3 = close

indicator2 = indicator3 * factor

STlong = indicator1 - indicator2

STshort = indicator1 + indicator2

If direction = 1 and STlong < STlongold then
STlong = STlongold
endif

If direction = -1 and STshort > STshortold then
STshort = STshortold
endif

If direction = 1 and indicator3 crosses under STlong then
direction = -1
endif

If direction = -1 and indicator3 crosses over STshort then
direction = 1
endif

STlongold = STlong

STshortold = STshort

If direction = 1 then
ST = STlong
R = 0
G = 128
else
ST = STshort
R = 128
G = 0
endif

Return ST coloured(R,G,0) Style(Line,2) as "Supertrend"
colour was only coded this way so you can set it yourself in the indicator box. By default, it is black.
That is an interesting new look at SuperTrend. I wasn’t getting any colour with the way the code is written. Never seen ‘coloured as’ before? So I changed it slightly. You should maybe put it in the library for others to consider using.
I usually prefer not to judge the optical impression of an indicator. People always show complex and nicely coloured indicators in a chart place that fits best their intentions and appears to work in this detail. In my opinion, the usefulness of an indicator can only be judged by coding a trading system that trades the signals of this indicator. So I rarely use my own indicators in charts, only in trading codes. But thanks for your colour code addition, anyway, so I do not have to look it up.
This version of supertrend is simpler than the normal supertrend, because there is only one adaptable parameter (factor). Curve fitting is not so easy, then. It behaves more like a common trailing stop, because volatility is not used.
colour was only coded this way so you can set it yourself in the indicator box. By default, it is black.
Thanks – wasn’t aware that you could do it like that.
@vonasi
Ich sehe das wir uns hier auf Deutsch unterhalten können.
Damit wird es für mich einfacher, verständlich zu bleiben.
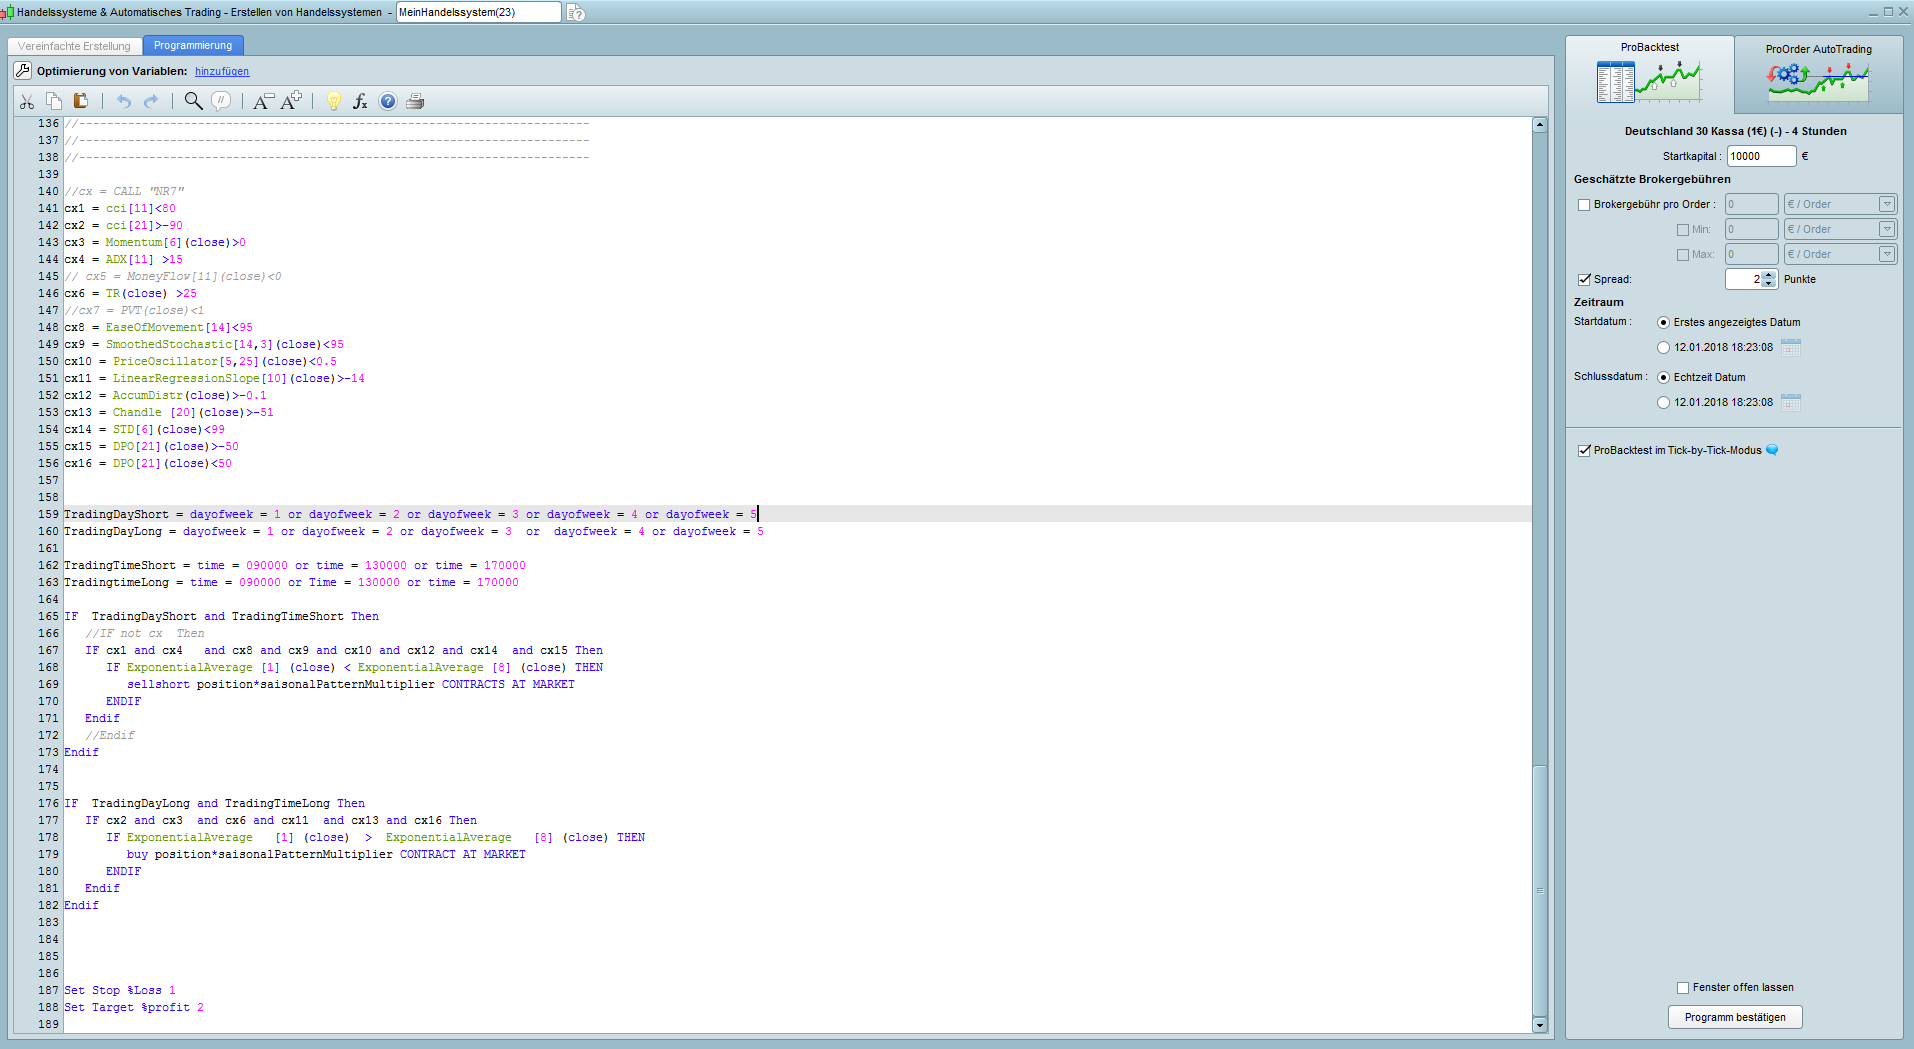
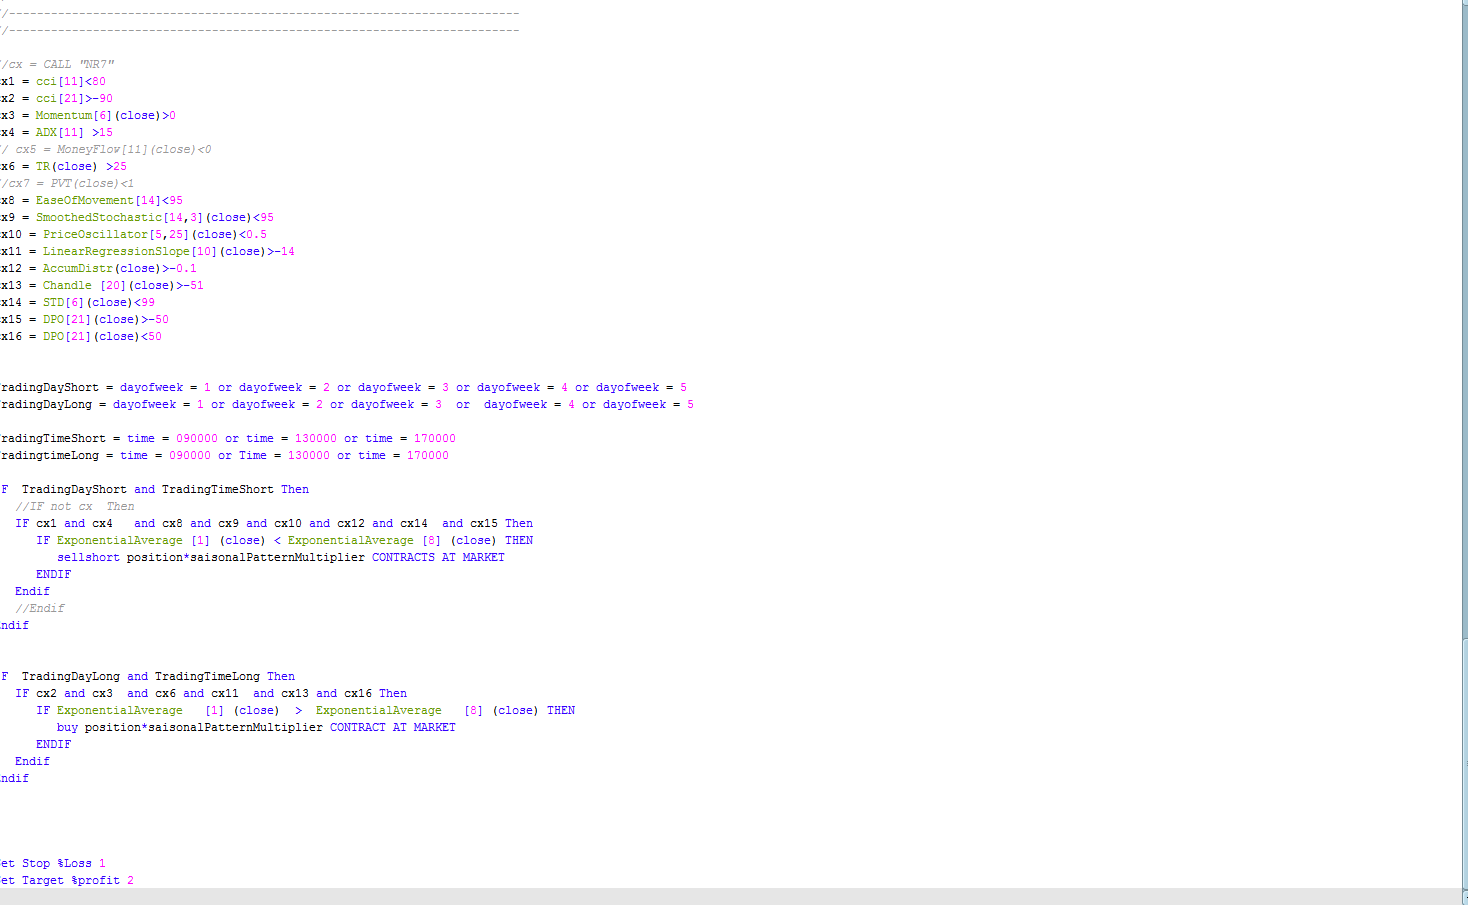
Kannst du mir einen Gefallen tun, und den folgenden Code durch einen Backtest jagen und gucken ob die Ergebnisse halbwegs gleich sind?
Ich halte das Ergebnis schlichtweg für unglaublich.
den “Call NR7” kann ich nachreichen
Nikolas meinete “overfitted” dazu …. aber ja, von mir aus.
// Hauptcode : H4 live cxxxx last PF flat2100
//-------------------------------------------------------------------------
// Start Pathfinder-System
// with define saisonal position multiplier for each month 1-15 / 16-31 (>0 - long / <0 - short / 0 no trade)
defparam flatafter = 210000
ONCE January1 = 3 //0 risk(3)
ONCE January2 = 0 //3 ok
ONCE February1 = 3 //3 ok
ONCE February2 = 3 //0 risk(3)
ONCE March1 = 3 //0 risk(3)
ONCE March2 = 2 //3 ok
ONCE April1 = 3 //3 ok
ONCE April2 = 3 //3 ok
ONCE May1 = 1 //0 risk(1)
ONCE May2 = 1 //0 risk(1)
ONCE June1 = 1 //1 ok 2
ONCE June2 = 2 //3 ok
ONCE July1 = 3 //1 chance
ONCE July2 = 2 //3 ok
ONCE August1 = 2 //1 chance 1
ONCE August2 = 3 //3 ok
ONCE September1 = 3 //0 risk(3)
ONCE September2 = 0 //0 ok
ONCE October1 = 3 //0 risk(3)
ONCE October2 = 2 //3 ok
ONCE November1 = 1 //1 ok
ONCE November2 = 3 //3 ok
ONCE December1 = 3 // 1 chance
ONCE December2 = 2 //3 ok
// set saisonal multiplier
currentDayOfTheMonth = Day
midOfMonth = 15
IF CurrentMonth = 1 THEN
IF currentDayOfTheMonth <= midOfMonth THEN
saisonalPatternMultiplier = January1
ELSE
saisonalPatternMultiplier = January2
ENDIF
ELSIF CurrentMonth = 2 THEN
IF currentDayOfTheMonth <= midOfMonth THEN
saisonalPatternMultiplier = February1
ELSE
saisonalPatternMultiplier = February2
ENDIF
ELSIF CurrentMonth = 3 THEN
IF currentDayOfTheMonth <= midOfMonth THEN
saisonalPatternMultiplier = March1
ELSE
saisonalPatternMultiplier = March2
ENDIF
ELSIF CurrentMonth = 4 THEN
IF currentDayOfTheMonth <= midOfMonth THEN
saisonalPatternMultiplier = April1
ELSE
saisonalPatternMultiplier = April2
ENDIF
ELSIF CurrentMonth = 5 THEN
IF currentDayOfTheMonth <= midOfMonth THEN
saisonalPatternMultiplier = May1
ELSE
saisonalPatternMultiplier = May2
ENDIF
ELSIF CurrentMonth = 6 THEN
IF currentDayOfTheMonth <= midOfMonth THEN
saisonalPatternMultiplier = June1
ELSE
saisonalPatternMultiplier = June2
ENDIF
ELSIF CurrentMonth = 7 THEN
IF currentDayOfTheMonth <= midOfMonth THEN
saisonalPatternMultiplier = July1
ELSE
saisonalPatternMultiplier = July2
ENDIF
ELSIF CurrentMonth = 8 THEN
IF currentDayOfTheMonth <= midOfMonth THEN
saisonalPatternMultiplier = August1
ELSE
saisonalPatternMultiplier = August2
ENDIF
ELSIF CurrentMonth = 9 THEN
IF currentDayOfTheMonth <= midOfMonth THEN
saisonalPatternMultiplier = September1
ELSE
saisonalPatternMultiplier = September2
ENDIF
ELSIF CurrentMonth = 10 THEN
IF currentDayOfTheMonth <= midOfMonth THEN
saisonalPatternMultiplier = October1
ELSE
saisonalPatternMultiplier = October2
ENDIF
ELSIF CurrentMonth = 11 THEN
IF currentDayOfTheMonth <= midOfMonth THEN
saisonalPatternMultiplier = November1
ELSE
saisonalPatternMultiplier = November2
ENDIF
ELSIF CurrentMonth = 12 THEN
IF currentDayOfTheMonth <= midOfMonth THEN
saisonalPatternMultiplier = December1
ELSE
saisonalPatternMultiplier = December2
ENDIF
Endif
position = 2
// End Pathfinder-System
//-------------------------------------------------------------------------
//-------------------------------------------------------------------------
// Start Code Indicator NR7
//-------------------------------------------------------------------------
// C1= Range<Range[1] and Range<Range[2] and Range<Range[3] and Range<Range[4] and Range<Range[5] and Range<Range[6] and Range<Range[7]
// RETURN C1
//-------------------------------------------------------------------------
// End Code IndicatorNr7
//-------------------------------------------------------------------------
//-------------------------------------------------------------------------
// Start Hauptcode
//-------------------------------------------------------------------------
// Hauptcode : H4 Live
//-------------------------------------------------------------------------
//-------------------------------------------------------------------------
//-------------------------------------------------------------------------
//-------------------------------------------------------------------------
//cx = CALL "NR7"
cx1 = cci[11]<80
cx2 = cci[21]>-90
cx3 = Momentum[6](close)>0
cx4 = ADX[11] >15
// cx5 = MoneyFlow[11](close)<0
cx6 = TR(close) >25
//cx7 = PVT(close)<1
cx8 = EaseOfMovement[14]<95
cx9 = SmoothedStochastic[14,3](close)<95
cx10 = PriceOscillator[5,25](close)<0.5
cx11 = LinearRegressionSlope[10](close)>-14
cx12 = AccumDistr(close)>-0.1
cx13 = Chandle [20](close)>-51
cx14 = STD[6](close)<99
cx15 = DPO[21](close)>-50
cx16 = DPO[21](close)<50
TradingDayShort = dayofweek = 1 or dayofweek = 2 or dayofweek = 3 or dayofweek = 4 or dayofweek = 5
TradingDayLong = dayofweek = 1 or dayofweek = 2 or dayofweek = 3 or dayofweek = 4 or dayofweek = 5
TradingTimeShort = time = 090000 or time = 130000 or time = 170000
TradingtimeLong = time = 090000 or Time = 130000 or time = 170000
IF TradingDayShort and TradingTimeShort Then
//IF not cx Then
IF cx1 and cx4 and cx8 and cx9 and cx10 and cx12 and cx14 and cx15 Then
IF ExponentialAverage [1] (close) < ExponentialAverage [8] (close) THEN
sellshort position*saisonalPatternMultiplier CONTRACTS AT MARKET
ENDIF
Endif
//Endif
Endif
IF TradingDayLong and TradingTimeLong Then
IF cx2 and cx3 and cx6 and cx11 and cx13 and cx16 Then
IF ExponentialAverage [1] (close) > ExponentialAverage [8] (close) THEN
buy position*saisonalPatternMultiplier CONTRACT AT MARKET
ENDIF
Endif
Endif
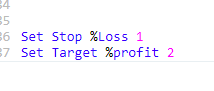
Set Stop %Loss 1
Set Target %profit 2
und das hier noch, hat oben nicht mehr reingepasst
give me 5 points and I fit you an elephant
give me 100 points and the elephant will look really nice
traditional saying from experimental physics
ohne den Code ausprobiert zu haben, natürlich
Hello JohnScher. Yes speaking German is fine….. only I don’t understand a word of it…. oh and the moderators will be along any minute to tell you not to in an English speaking forum. I just use Google translate though – it is normally good for a laugh.
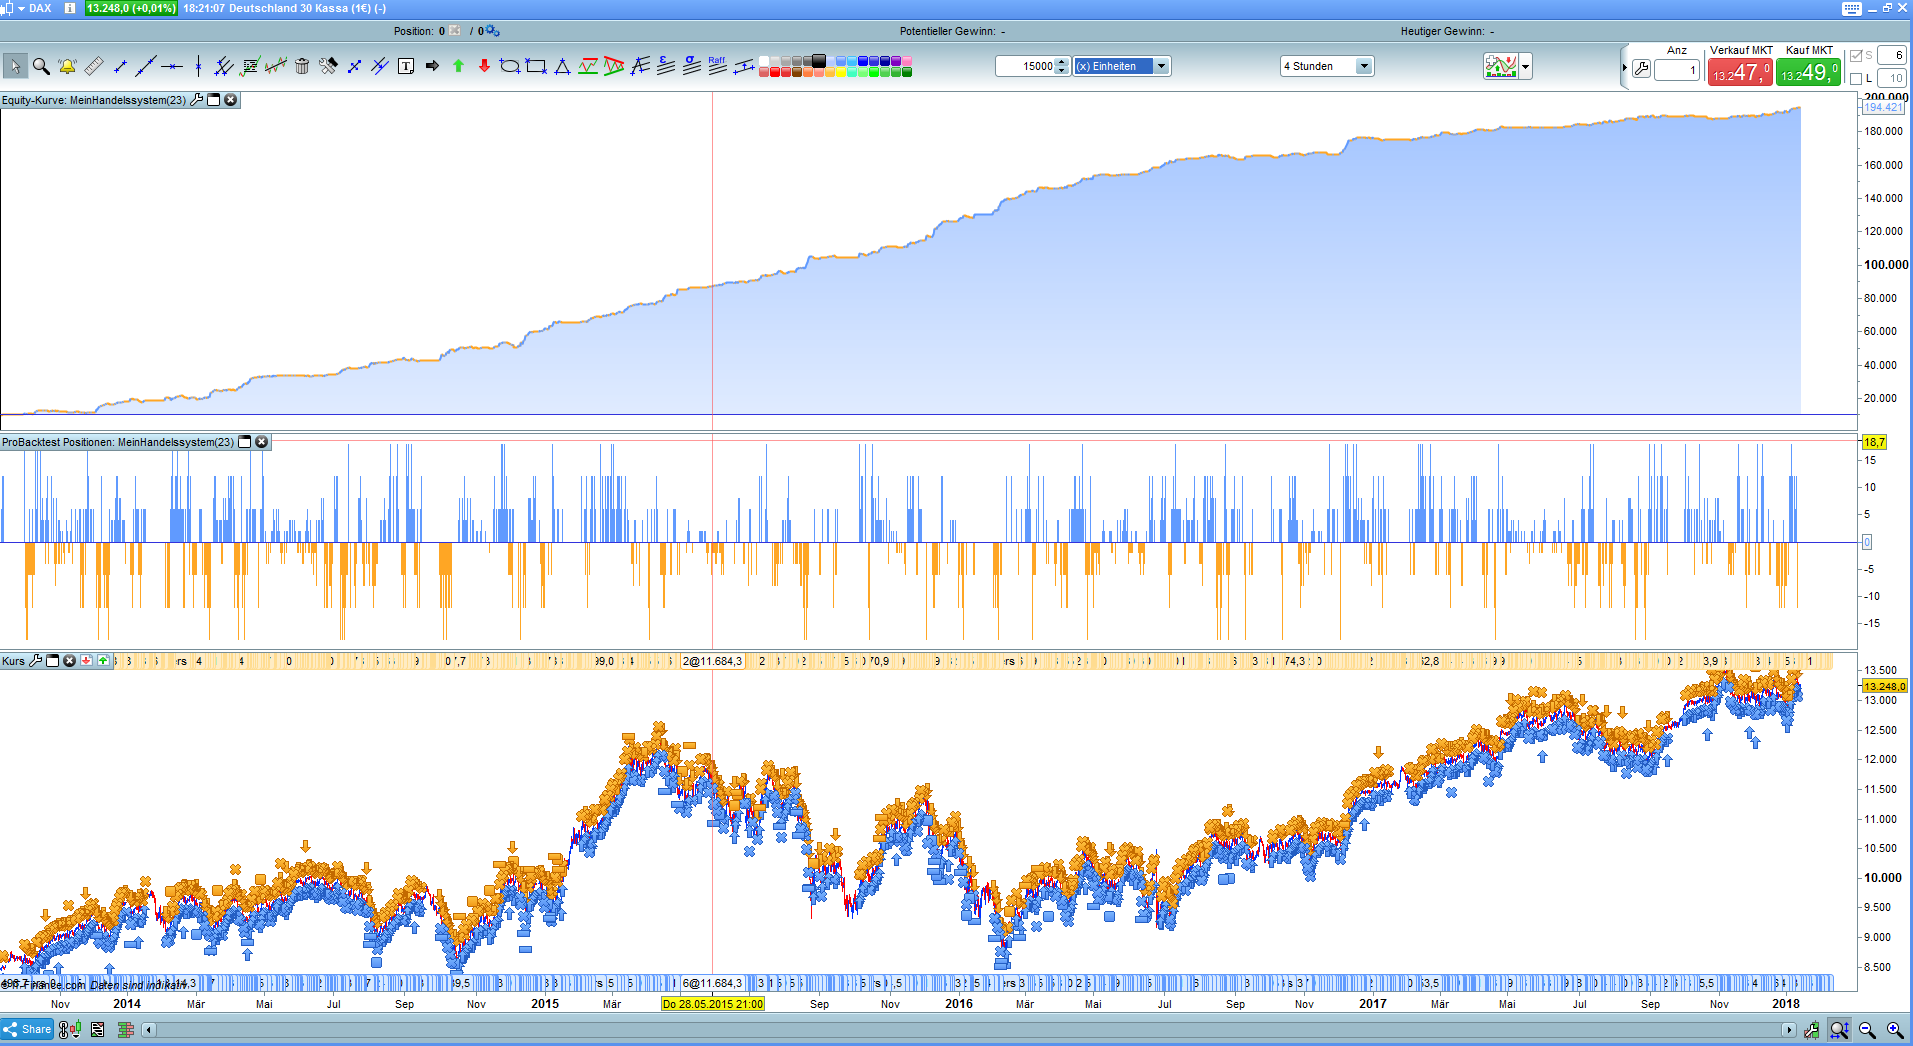
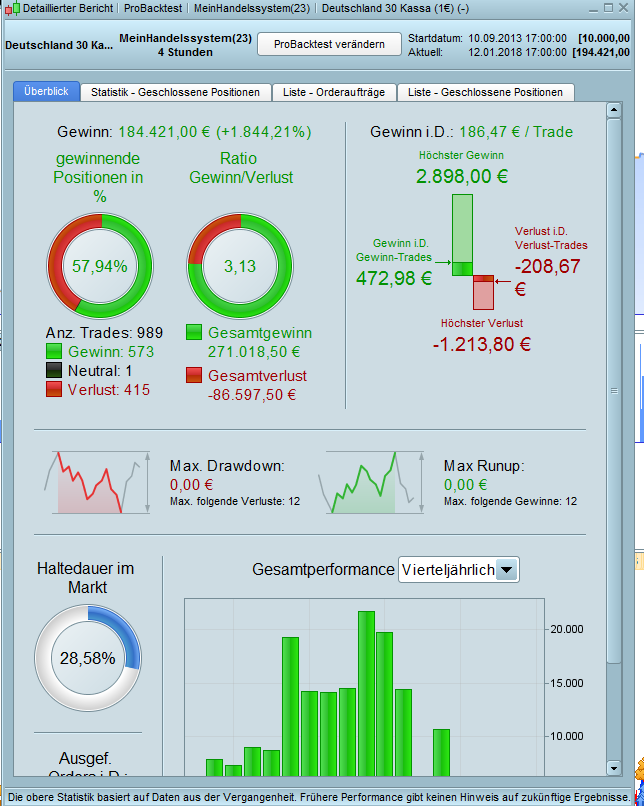
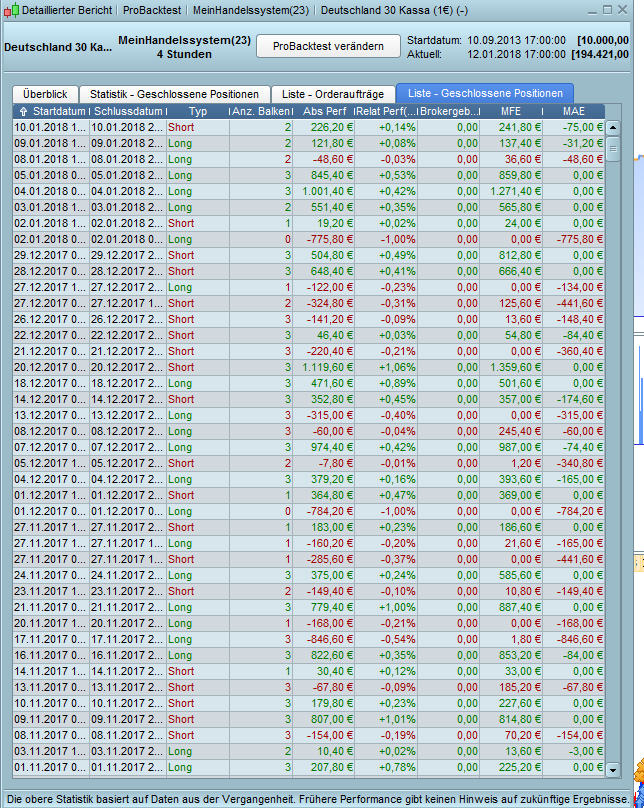
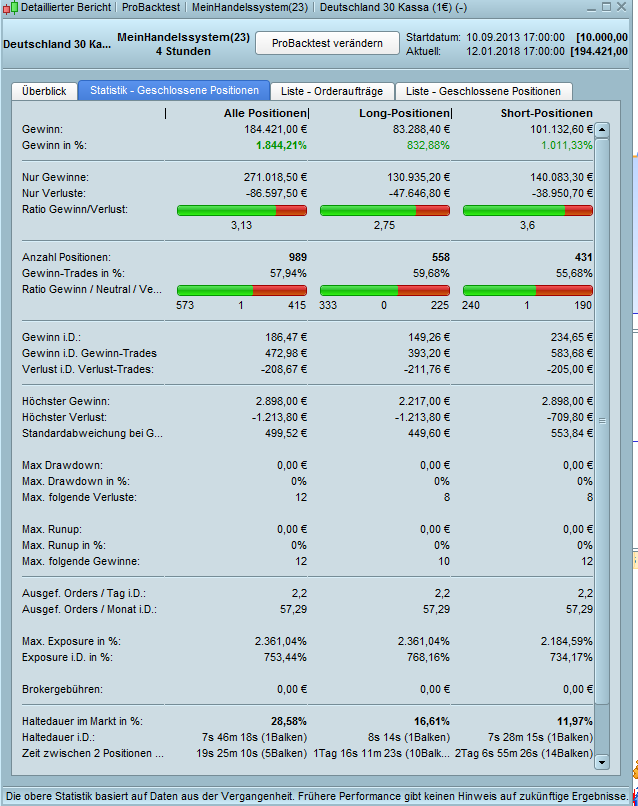
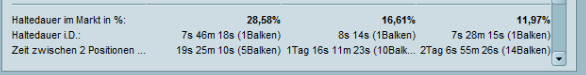
I have not tested the above strategy for two reasons that are shown in the images. It just will not work in real life which is why the equity line is so perfect.
Gut, dann entschuldige ich mich bei dir, dass ich dich mit @vonasi falsch angesprochen habe.
Würdest du trotzdem den Code mal durch einen Backtest jagen?
@vonasi
That’s exactly the question that haunts me.
How do such errors occur?