Hi,
I have searched other threads about walk forward tests but can’t find answers of all my wondering. Hope somebody more experienced can help me.
1 – I have a system optimized the old way (not walk forward) 2010-2018 and it looks very good. I then tested it out of sample 2002-2018 and it worked pretty well 2002-2010 too. Then testing it with walk-forward and optimizing some of the most important variables and it then chose a much worse variable set. The walk forward efficiency ratio declines dramatically against just doing a zero-variable walk forward optimization on my initial set up. It only do about 330 trades 2002-2018 but I think that should be enough. Some years it doesn’t do any trades at all (it’s a daily trend following system on forex) and that might do it difficult for a walk forward analyze. The question is – how would you interpret such case and how would you continue? It feels strange to change my initial parameter set up for something that seem worse just because the WF-test say so.
2 – The system I works on now has about 12 parameters that can be optimized. All of them can’t be optimized with a WF-test at once, that would take years. About 6 parameters are significant for the performance, the other ones can be +-30% without doing any bigger difference. When optimizing the 6 significant parameters only in a WF-test I have seen somewhere you shouldn’t use smaller steps than 5-10%. Is this something you agree on or how big/small steps are you using in your last run of the WF-test?
All help is appreciated, thanks.
A picture tells a thousand words so maybe post some images of non WF results, WF results, equity curves etc.
Without images I find myself reading and re-reading and trying to imagine the results you got.
No need for loads of images as small baby steps / 1 or 2 questions at a time is likely to get you more answers?
Just a few thoughts anyway.
Cheers
GraHal
Another thought … are all the results you are analysing / looking at been produced by running in tick by tick mode?
Hi GraHal,
It’s not many questions there I think? Without the explaining text the first questions would be to explain more. Better to explain at once.
Yes, it’s tick by tick when it’s possible (not in the 2002-2018 test of course).
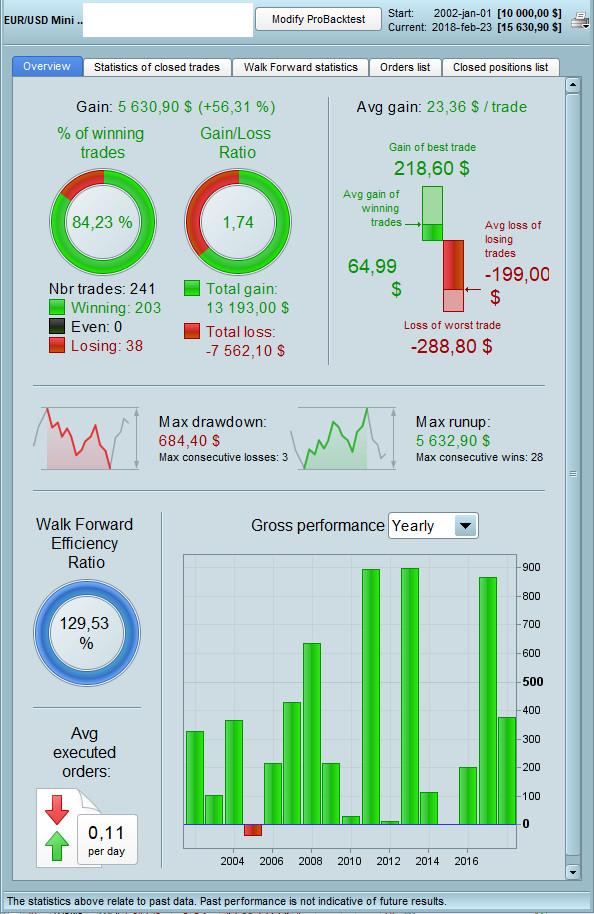
non-WF.jpg shows the zero-optimization WF test of the original parameter set
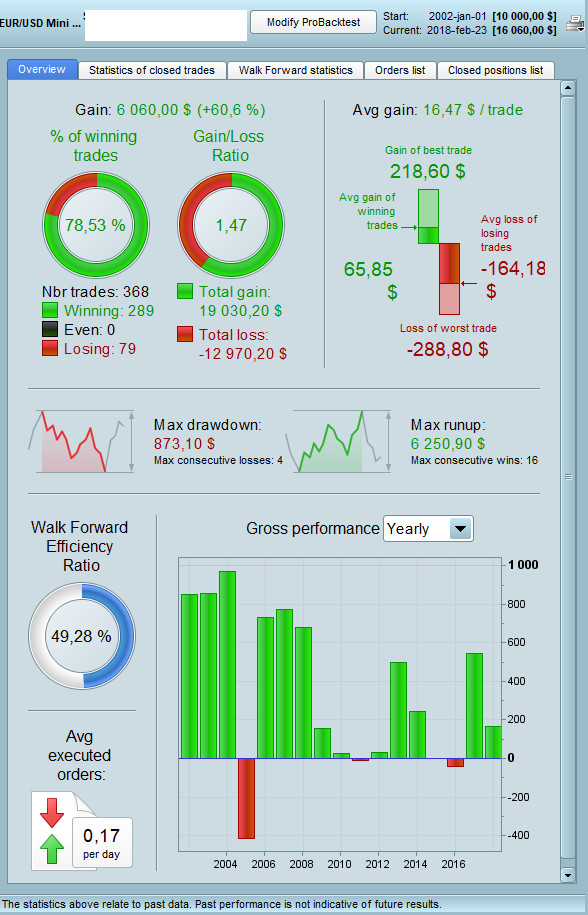
WF.jpg shows the WF test with 5 optimized parameters
As you can see when comparing there are less percentage wins, more draw back and the big incomes are further back in the history (oposite to my believes how it should work) when using the WF optimization.
non WF being when you use a dummy variable that is nit used in the code?
I had same / similar results a few days ago. I’ll think on it while I have a shave!! 🙂
“non WF being when you use a dummy variable that is nit used in the code?
Yes, correct.
so where / how did you work out the value of the variables in the code that you used in the non-WF / dummy variable test?
As I understand you, you “ruined” the WFA by first running a straight optimization using the whole history and then running the dummy variable WFA this settings. This is not they way it should be done. By doing so you turn the OOS period to an insample period and by that destroy the value of the WFA.
OOS testing means that you use different data to test than you used to determine the parameters. By doing so it is more realistic because this is what you have to do when running it live.
A agree Despair, it was what I was working up to saying.
This is why the non-WF results are better because the whole of period 2002-2018 non-WF is an IN Sample period.
The (true) WF period 2002-2018 has most of the period 2002-2018 as IN Sample and some as (non optimised) OUT of Sample.
Does this sound a logical / correct explanation Patrick or have we got it wrong what you did?
Cheers
GraHal
It sounds partly correct. The only thing that isn’t correct is that I did my optimization 2010-2018 and then tried it on 2002-2018 (as an OOS test) where it looked fine all the time. After that I didn’t do any more “manual” optimization but tried it with WF where it showed me (to my believe) strange parameter choices.
I got an hint on Twitter to try doing the WF with a fixed starting point instead (anchored). This way would the large number of trades give it a better first optimization in the WF test. Also this way it chose other parameter values than I would.
Actually by using the WF optimization I get better performance in term of gain. But not in terms of time in the market, number of trades and maximum drawback. These values need to be considered too. I doubt the PRT WF optimization care about that but hopefully it will do in the future.
I have worked a little with another trading system called Zorro that does many things PRT don’t. In that system the optimization took more consern to other aspect than gain. However I stoped using that system when I realized I couldn’t get IG all 24 h historical data to test on. For example on DAX I only could get data during the termine open hours (7-22 I think) and how do you translate a system built on that to IG market with 24 h data? I have no idea and I don’t think anybody else would try that.
Patrick you say … Actually by using the WF optimization I get better performance in term of gain … but the two images in post #63881 show the non-WF to be the higher gain scenario?
Do you mean if you used Anchored WF you got better performance in term of gain?
I’m not being picky, just trying to help and I’m questioning myself also as I’ve had all the same issues you relate above.
Cheers
GraHal
No – the non-WF say 56,31% and the WF say 60,6%.
Ah yes sorry my mistake … I looked at the % of Winning Trades, Gain to Loss Ratio and Drawdown and decided that I’d rather run the Non-WF Algo / Variable values and then kinda locked it in my mind that the Non-WF was the better Algo.