Hello All,
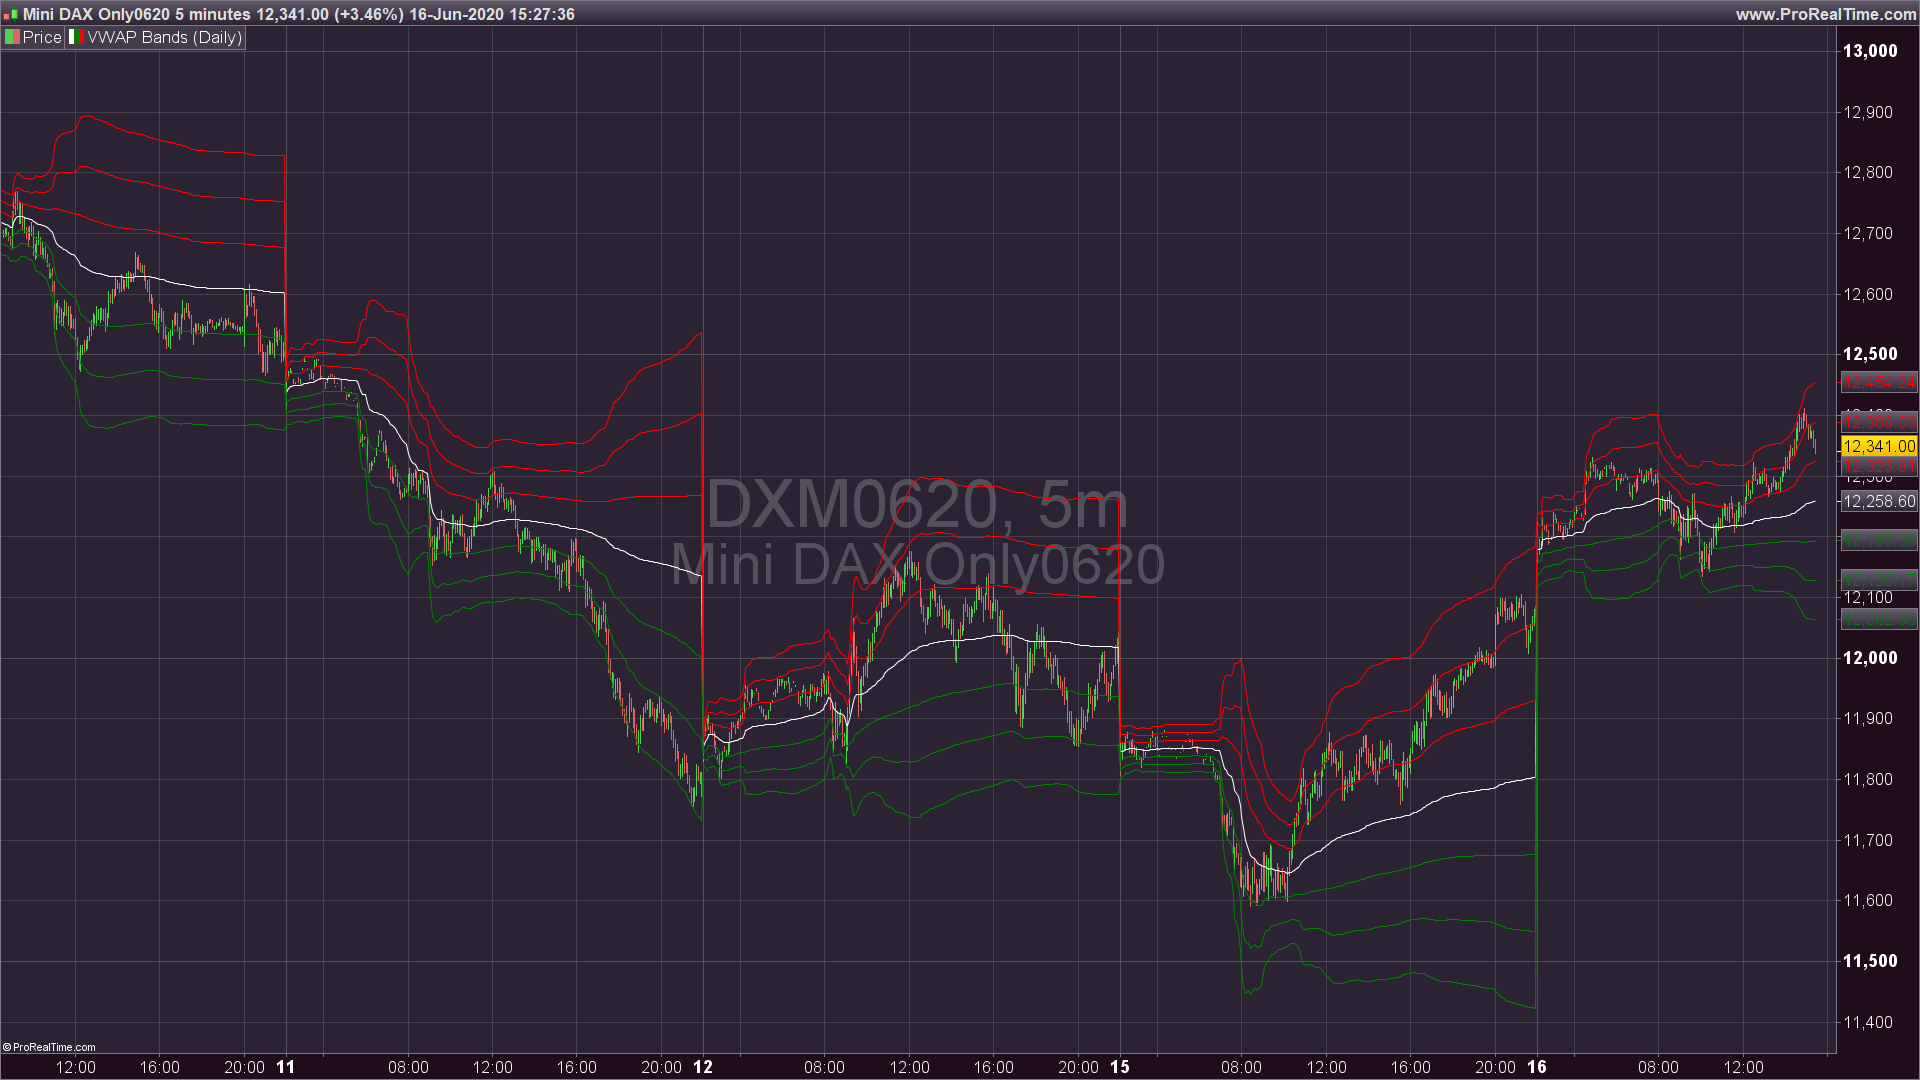
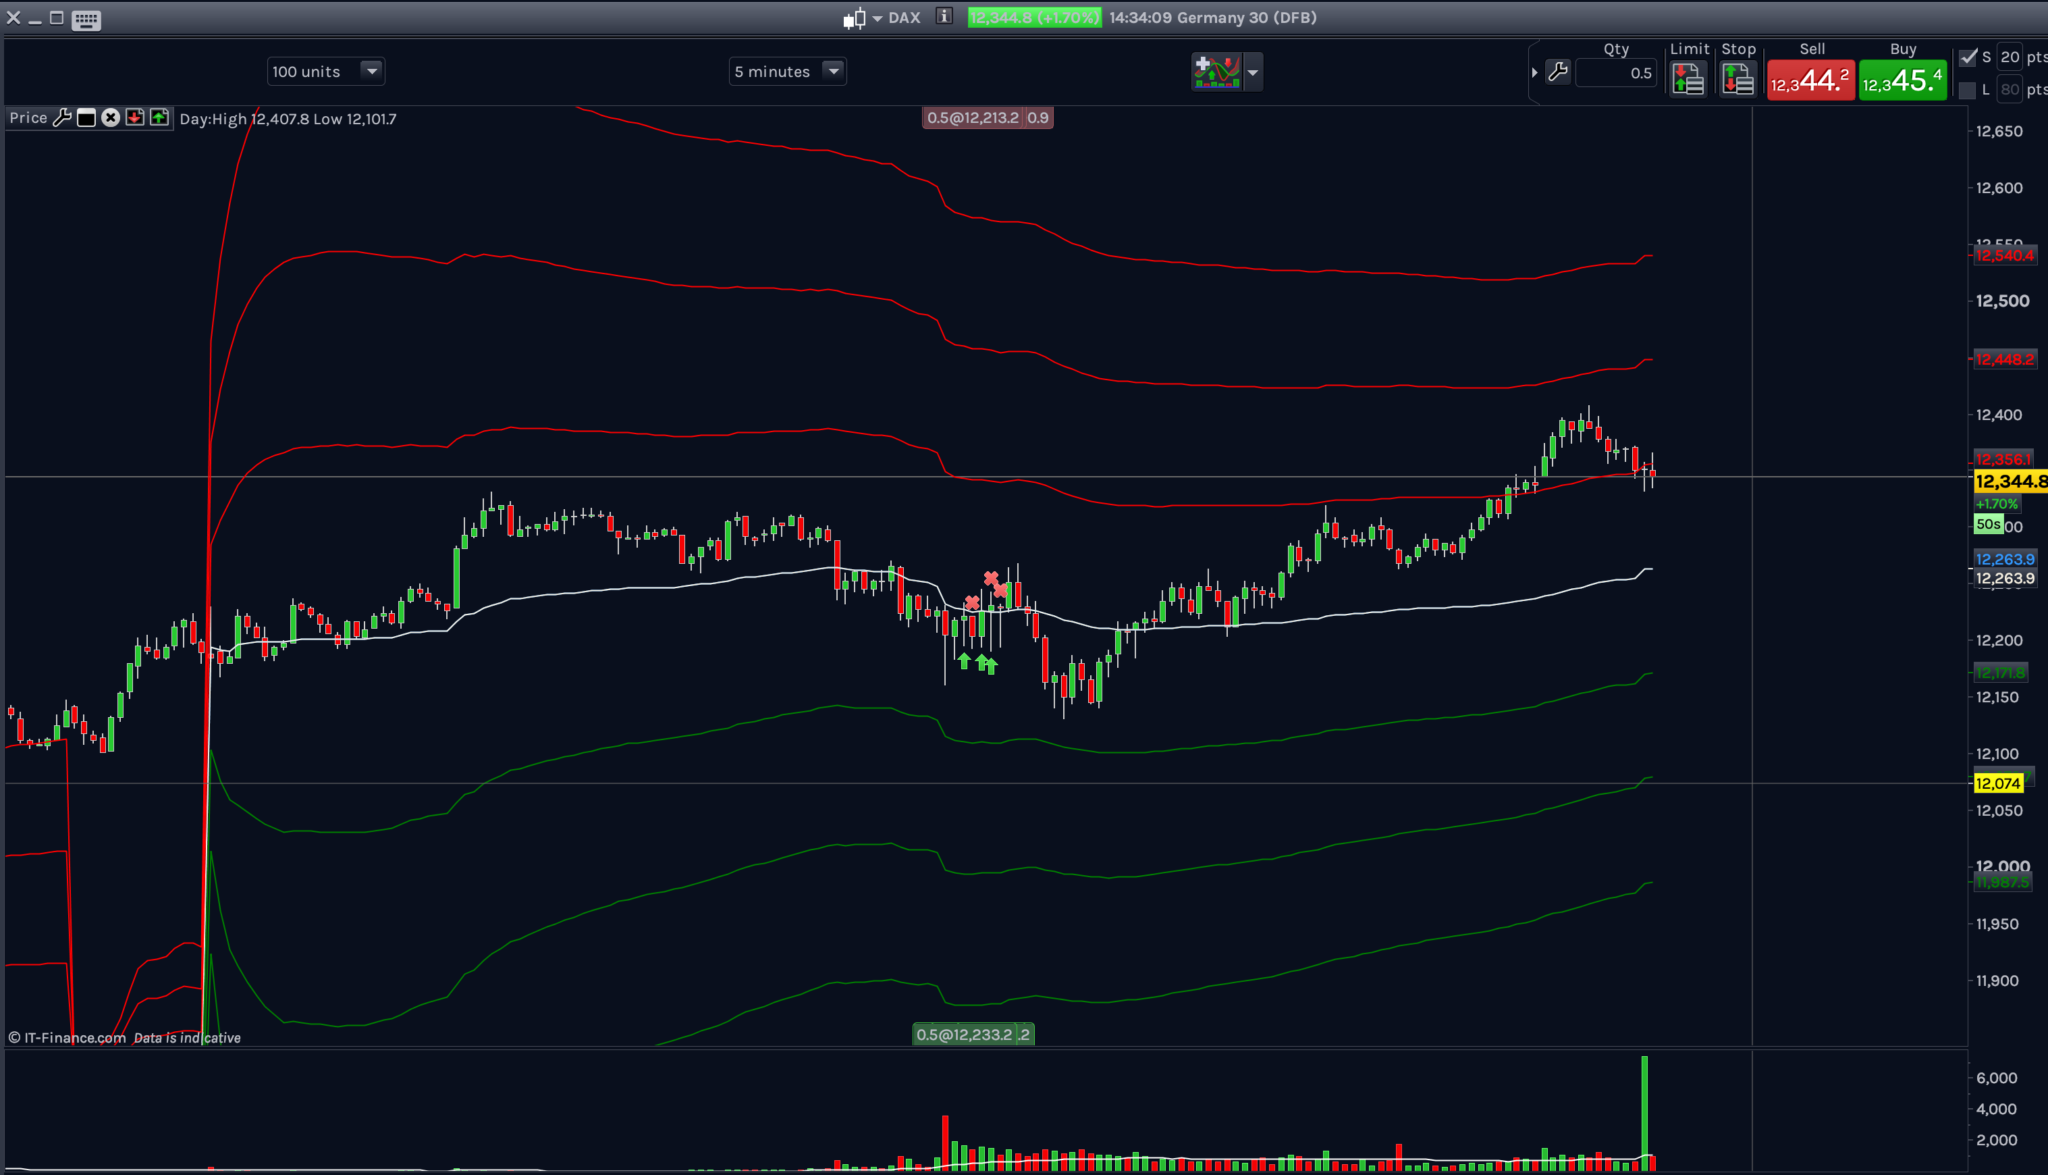
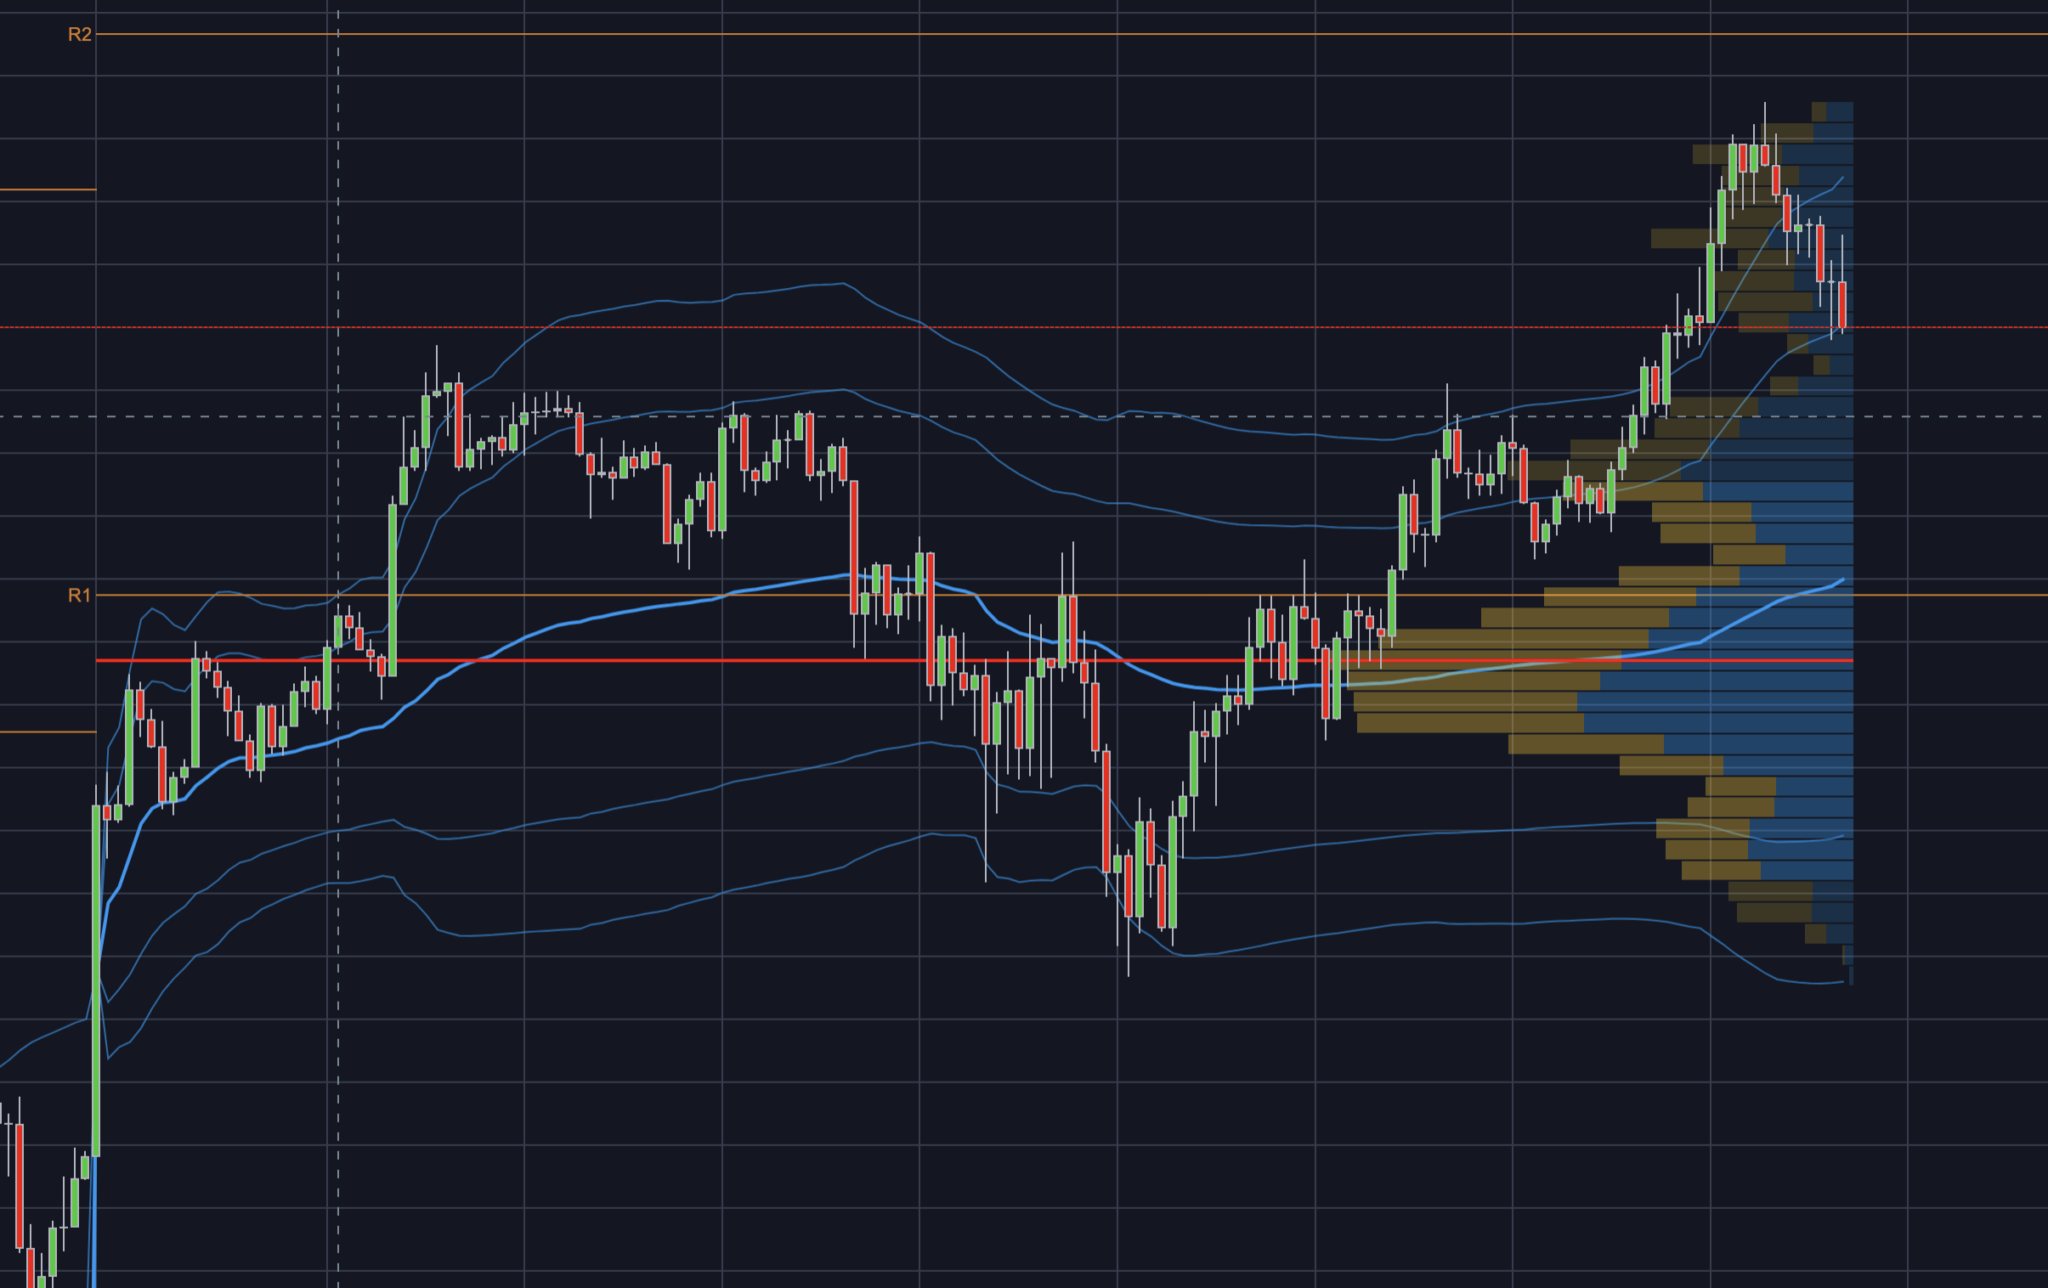
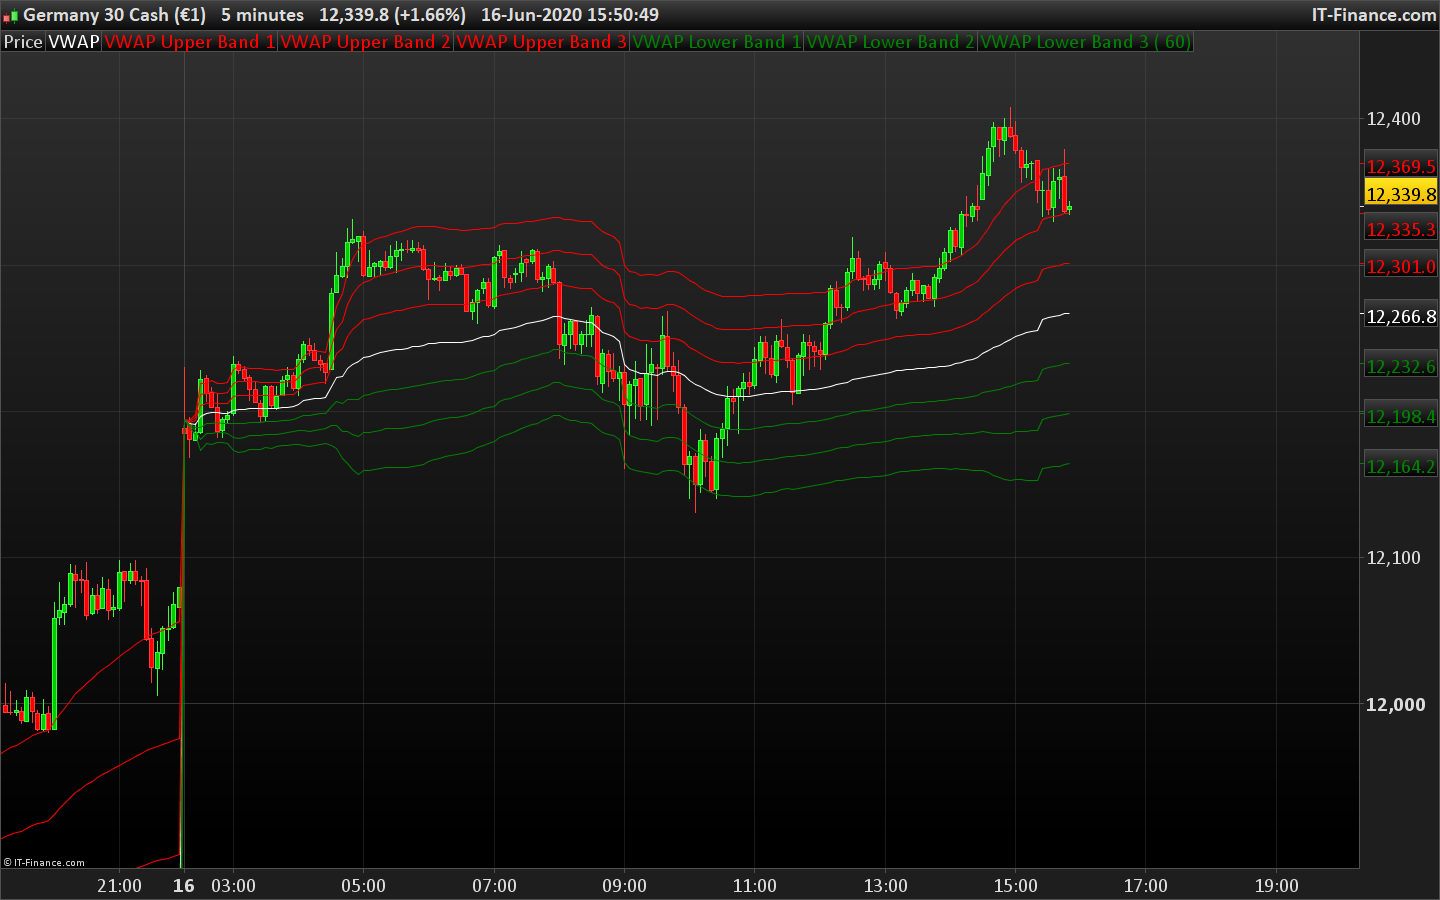
I’ve been trying to use the VWAP Bands which come as standard in the PRT platform but I’ve noticed large discrepancies between PRT and the TradingView VWAP Bands. I’ve attached the code below from the TV indicator – is there a reason that they’re so different? TradingView seems to fit closely with what I’m looking for whereas the PRT bands are miles away from price.
//"version=2
//with barcolors and stuff
study("VWAP Stdev Bands v2 Mod", overlay=true)
devUp1 = input(1.28, title="Stdev above (1)")
devDn1 = input(1.28, title="Stdev below (1)")

devUp2 = input(2.01, title="Stdev above (2)")
devDn2 = input(2.01, title="Stdev below (2)")

devUp3 = input(2.51, title="Stdev above (3)")
devDn3 = input(2.51, title="Stdev below (3)")

devUp4 = input(3.09, title="Stdev above (4)")
devDn4 = input(3.09, title="Stdev below (4)")

devUp5 = input(4.01, title="Stdev above (5)")
devDn5 = input(4.01, title="Stdev below (5)")
showBcol = input(true, title="Turn Barcolor ON/OFF?")
showDv2 = input(true, type=bool, title="Show second group of bands?")
showDv3 = input(true, type=bool, title="Show third group of bands?")
showDv4 = input(false, type=bool, title="Show fourth group of bands?")
showDv5 = input(false, type=bool, title="Show fifth group of bands?")

showPrevVWAP = input(false, type=bool, title="Show previous VWAP close")
ColorSrc=input(close)
price=ColorSrc
start = security(tickerid, "D", time)

newSession = iff(change(start), 1, 0)

vwapsum = iff(newSession, hl2*volume, vwapsum[1]+hl2*volume)
volumesum = iff(newSession, volume, volumesum[1]+volume)
v2sum = iff(newSession, volume*hl2*hl2, v2sum[1]+volume*hl2*hl2)
myvwap = vwapsum/volumesum
dev = sqrt(max(v2sum/volumesum - myvwap*myvwap, 0))

A=plot(myvwap,style=circles, title="VWAP", color=black)
U1=plot(myvwap + devUp1 * dev,style=circles, title="VWAP Upper", color=gray)
D1=plot(myvwap - devDn1 * dev, style=circles, title="VWAP Lower", color=gray)

myvwapu1= myvwap + devUp1 * dev
myvwapd1= myvwap - devDn1 * dev

U2=plot(showDv2 ? myvwap + devUp2 * dev : na, color=red, title="VWAP Upper (2)")
D2=plot(showDv2 ? myvwap - devDn2 * dev : na, color=green, title="VWAP Lower (2)")

myvwapu2= myvwap + devUp2 * dev
myvwapu3= myvwap + devUp3 * dev
myvwapd2= myvwap - devDn2 * dev
myvwapd3= myvwap - devDn3 * dev

U3=plot(showDv3 ? myvwap + devUp3 * dev : na, title="VWAP Upper (3)", color=red)
D3=plot(showDv3 ? myvwap - devDn3 * dev : na, title="VWAP Lower (3)", color=green)

myvwapu4= myvwap + devDn4 * dev
myvwapd4= myvwap - devDn4 * dev

U4=plot(showDv4 ? myvwap + devUp4 * dev : na, title="VWAP Upper (4)", color=red)
D4=plot(showDv4 ? myvwap - devDn4 * dev : na, title="VWAP Lower (4)", color=green)

U5=plot(showDv5 ? myvwap + devUp5 * dev : na, title="VWAP Upper (5)", color=red)
D5=plot(showDv5 ? myvwap - devDn5 * dev : na, title="VWAP Lower (5)", color=green)

prevwap = iff(newSession, myvwap[1], prevwap[1])

plot(showPrevVWAP ? prevwap : na, style=circles, color=close > prevwap ? green : red)

ColorMiddleU = price > myvwap and price < myvwapu2 ? white:na
ColorMiddleD = price > myvwapd1 and price < myvwap ? black:na

ColorDv1d = price > myvwapd2 and price < myvwapd1 ? gray:na
ColorDv1u = price > myvwapu1 and price < myvwapu2 ? gray:na

ColorDv2d = price > myvwapd3 and price < myvwapd2 ? green:na
ColorDv2u = price > myvwapu2 and price < myvwapu3 ? maroon:na

ColorDv3d = price > myvwapd4 and price < myvwapd3 ? lime:na
ColorDv3u = price > myvwapu3 and price < myvwapu4 ? red:na

barcolor(showBcol?ColorMiddleD:na, title="BarColor vwap-1 Lower")
barcolor(showBcol?ColorMiddleU:na, title="BarColorColor vwap-1 upper")
barcolor(showBcol?ColorDv1d:na, title="BarColor 1-2 Lower")
barcolor(showBcol?ColorDv1u:na, title="BarColorColor 1-2 upper")
barcolor(showBcol?ColorDv2d:na, title="BarColor 2-3 Lower")
barcolor(showBcol?ColorDv2u:na, title="BarColorColor 2-3 upper")
barcolor(showBcol?ColorDv3d:na, title="BarColor 3-4 Lower")
barcolor(showBcol?ColorDv3u:na, title="BarColorColor 3-4 upper")

fill(U1, U2, color=red, transp=90, title="Over Bought Fill 1")
fill(D1, D2, color=green, transp=90, title="Over Sold Fill 1")
fill(U2, U3, color=red, transp=90, title="Over Bought Fill 2")
fill(D2, D3, color=green, transp=90, title="Over Sold Fill 2")
fill(U3, U4, color=red, transp=90, title="Over Bought Fill 3")
fill(D3, D4, color=green, transp=90, title="Over Sold Fill 3")
fill(U4, U5, color=red, transp=90, title="Over Bought Fill 4")
fill(D4, D5, color=green, transp=90, title="Over Sold Fill 4")
fill(A, U1, color=gray, transp=90, title="Middle Fill Up")
fill(A, D1, color=gray, transp=90, title="Middle Fill Down")