Hello @Nicolas
I am looking for a solution to code a VWAP indicator with the same bands/SD as the PRT VWAP Band indicator.
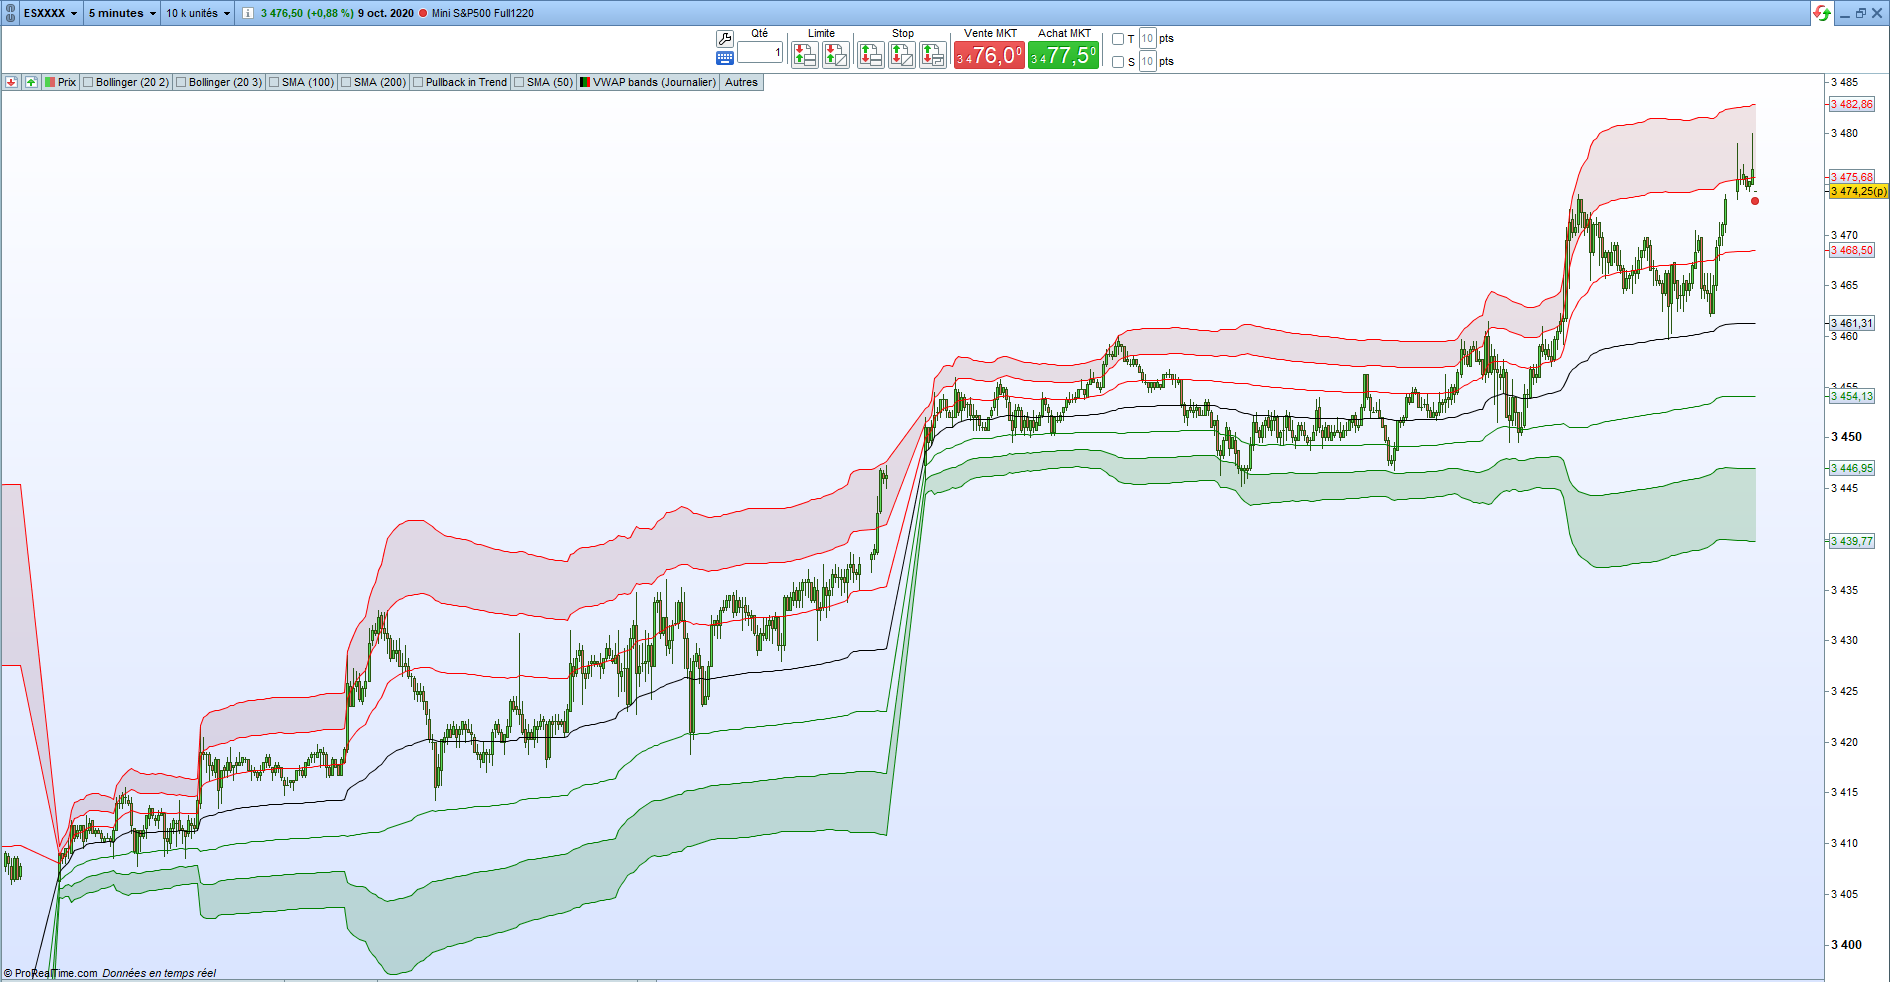
As you can see on the screenshots (on the left the PRT one), the indicators you have created with the help of PRT (https://www.prorealcode.com/topic/is-there-any-working-intraday-vwap/#post-116309) do not give the same bands as the original indicator present on the platform.
In my manual trading one of my strategies is based on buy/sell when rejecting prices between SD2 and SD3 of the PRT VWAP Band indicator.
Is it possible to have the code to obtain the same bands as the PRT indicator in order to integrate it into a trading robot?
Thank you for your help 🙂
You are right there is a difference, while it is exactly the same but for CFD instrument (look at attached picture).
The formula might have changed between 10.3 and v11, I’ll try to know more about the new VWAP formula and let you know.
hello Nicolas,
Any feedback on this? Big differences between built-in and recoded
Here is the new version of the custom code of the PRT VWAP Bands, it works the same as the internal indicator now:
//PRC_VWAP Bands v11 intraday
//04/07/2022
//Nicolas @ www.prorealcode.com
//Sharing ProRealTime knowledge

d = max(1, intradaybarindex)

VWAP = SUMMATION[d](volume*typicalprice)/SUMMATION[d](volume)
if(intradaybarindex=0) then
sd = 0
else
p1 = SUMMATION[d](volume*typicalprice)
p2 = SUMMATION[d](volume)
p3 = SUMMATION[d](volume*typicalprice*typicalprice)
ma = p1/p2
ma2 = p3/p2
sd = sqrt(abs(ma2 - ma * ma))
endif

SDup1 = vwap+sd
SDlw1 = vwap-sd
SDup2 = vwap+sd*2
SDlw2 = vwap-sd*2
SDup3 = vwap+sd*3
SDlw3 = vwap-sd*3

if vwap>vwap[1] then
color = 1
else
color = -1
endif

//yesterday vwap
if intradaybarindex=0 then
yVWAP = VWAP[1]
endif

RETURN VWAP coloured by color as "VWAP", SDup1 coloured(102,102,102) as "upper 1 STD", SDlw1 coloured(102,102,102) as "lower 1 STD", SDup2 coloured(102,102,102) as "upper 2 STD", SDlw2 coloured(102,102,102) as "lower 2 STD", SDup3 coloured(102,102,102) as "upper 3 STD", SDlw3 coloured(102,102,102) as "lower 3 STD", yVWAP as "yesterday VWAP"
Hi,
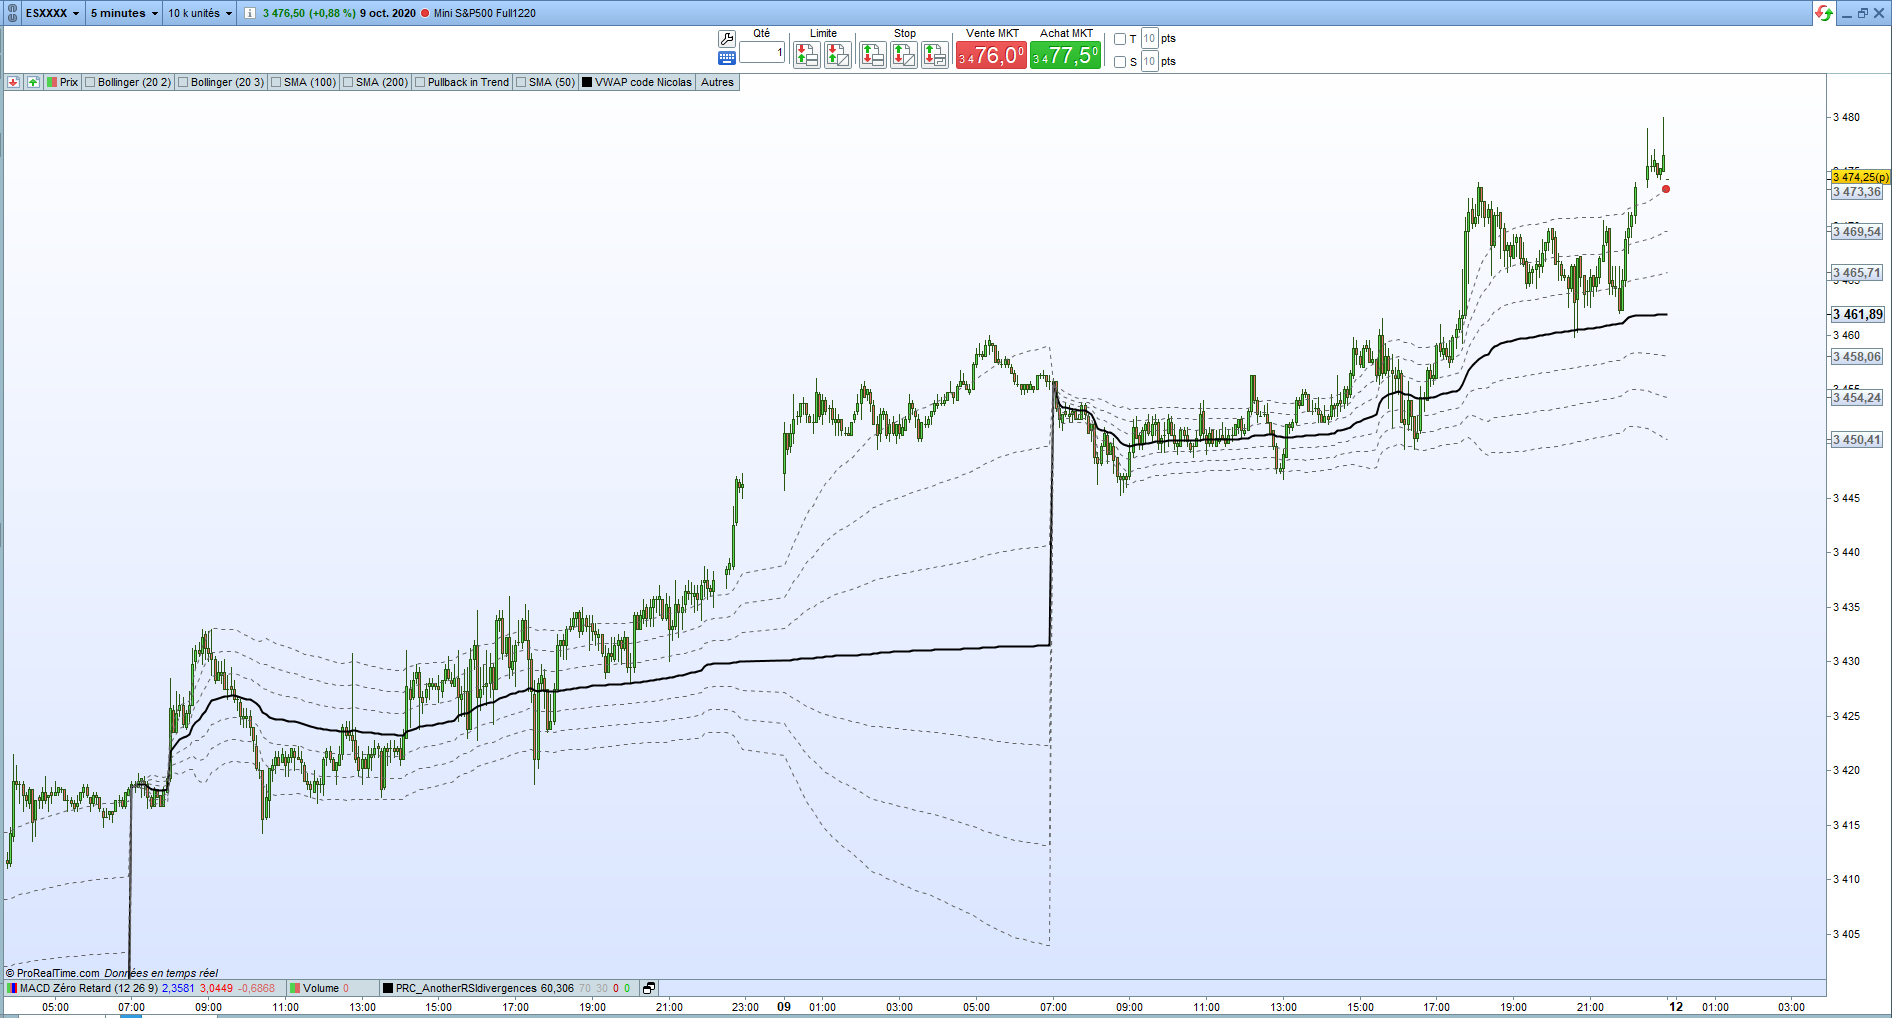
I have found that this indicator does not match the VWAP indicator in Prorealtime v12 that comes by default.
You don’t know why this happens?
I attach a screenshot where you can see that the green line is that of Nicolas’ VWAP and the blue line is that of the indicator that comes by default on the Prorealtime platform v12.
Thank you so much.
 JS
JSParticipant
Veteran
Hi,
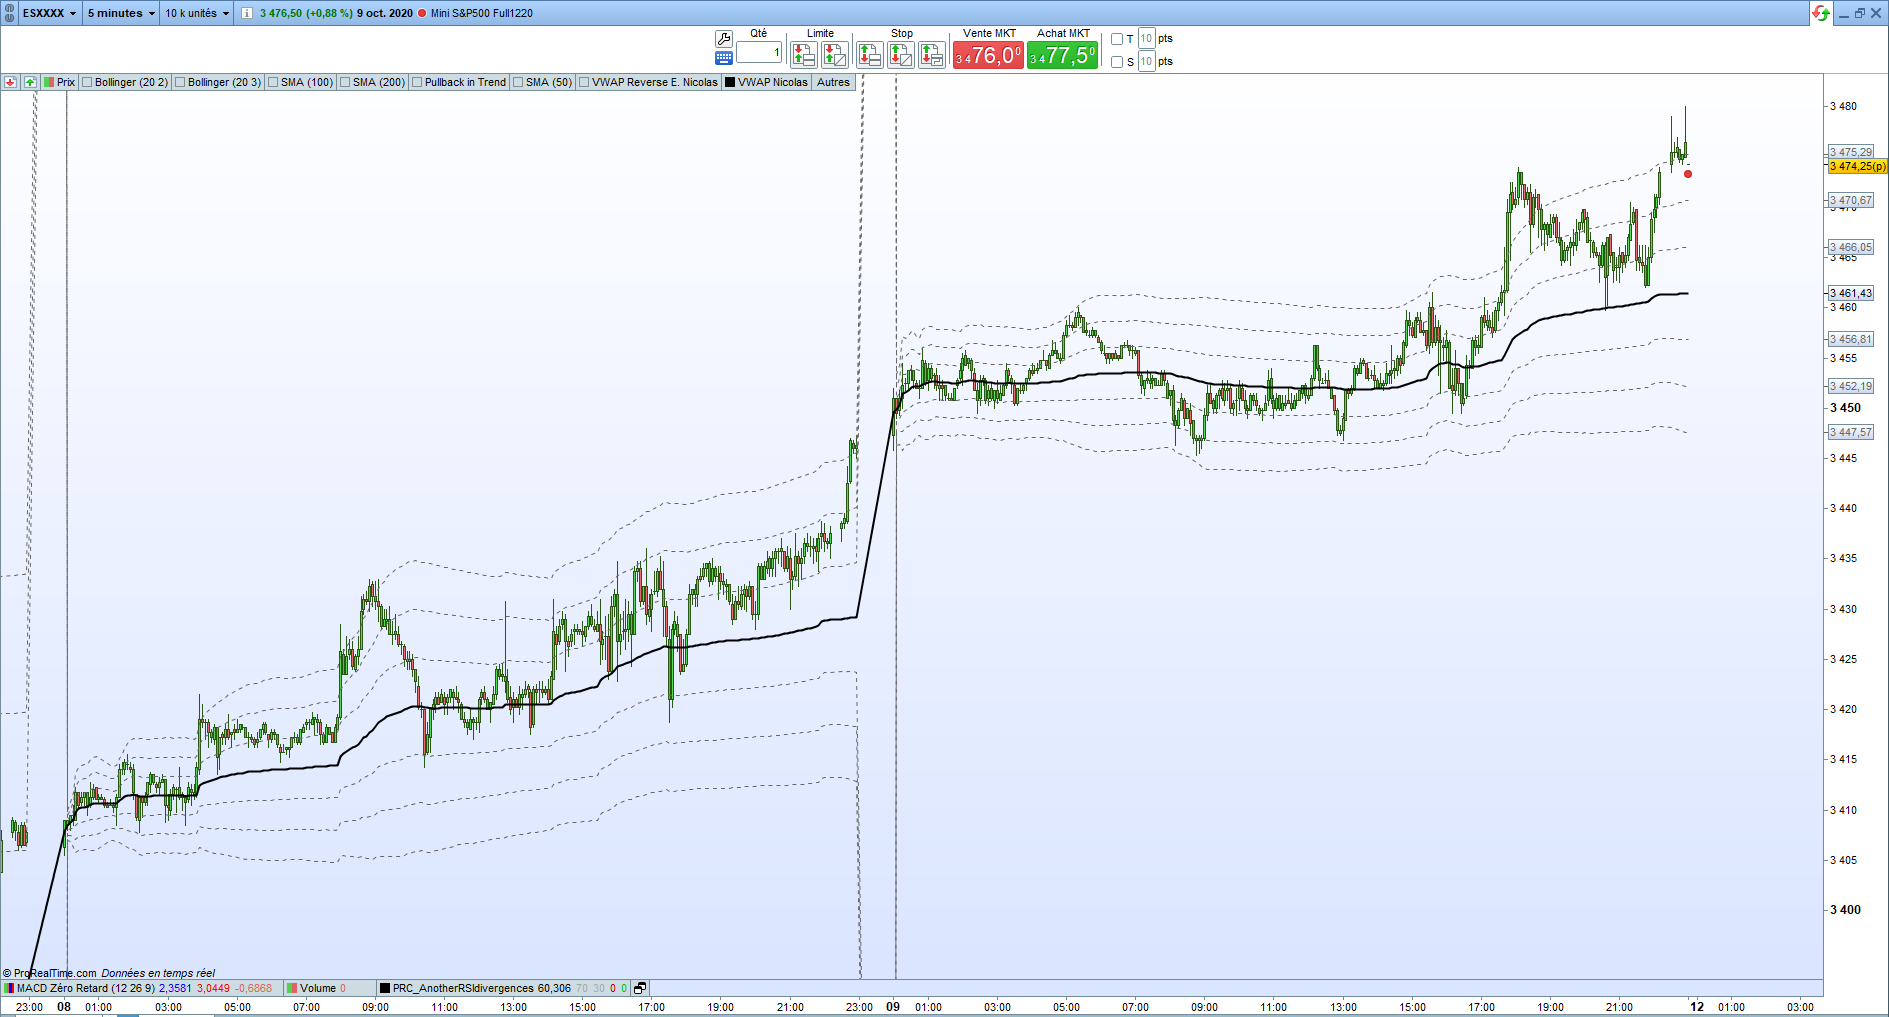
When I compare the indicators, there is a minimal difference between… (screenshot)
(difference occurs during the first bar of the day)
The difference in your screenshot is so big because the settings of the (default) VWAP don’t match…
Time interval: 1 day
Interval mode: Reset at each interval
Data accuracy: Historical data graph (default (H+L+C)/3)
JSParticipant
Veteran
Hi,
Hereby the continuous VWAP (bands):
// Continuous VWAP Bands
// Adjusted to compute VWAP continuously across multiple days without reset

// Initialize cumulative variables only once at the start
ONCE cumVolume = 0
ONCE cumPriceVolume = 0
ONCE cumPriceVolumeSquared = 0

// Accumulate volume and price-volume continuously
cumVolume = cumVolume + volume
cumPriceVolume = cumPriceVolume + (volume * typicalprice)
cumPriceVolumeSquared = cumPriceVolumeSquared + (volume * typicalprice * typicalprice)

// Continuous VWAP calculation
VWAP = cumPriceVolume / cumVolume

// Calculate Standard Deviation
ma = cumPriceVolume / cumVolume
ma2 = cumPriceVolumeSquared / cumVolume
sd = sqrt(abs(ma2 - ma * ma))

// Define Standard Deviation Bands
SDup1 = VWAP + sd
SDlw1 = VWAP - sd
SDup2 = VWAP + sd * 2
SDlw2 = VWAP - sd * 2
SDup3 = VWAP + sd * 3
SDlw3 = VWAP - sd * 3

// Color VWAP based on trend
if VWAP > VWAP[1] then
R=0
G=255
B=0
else
R=255
G=0
B=0
endif

// Return VWAP and SD Bands with colors
RETURN VWAP coloured(R,G,B) as "VWAP"
Hello,
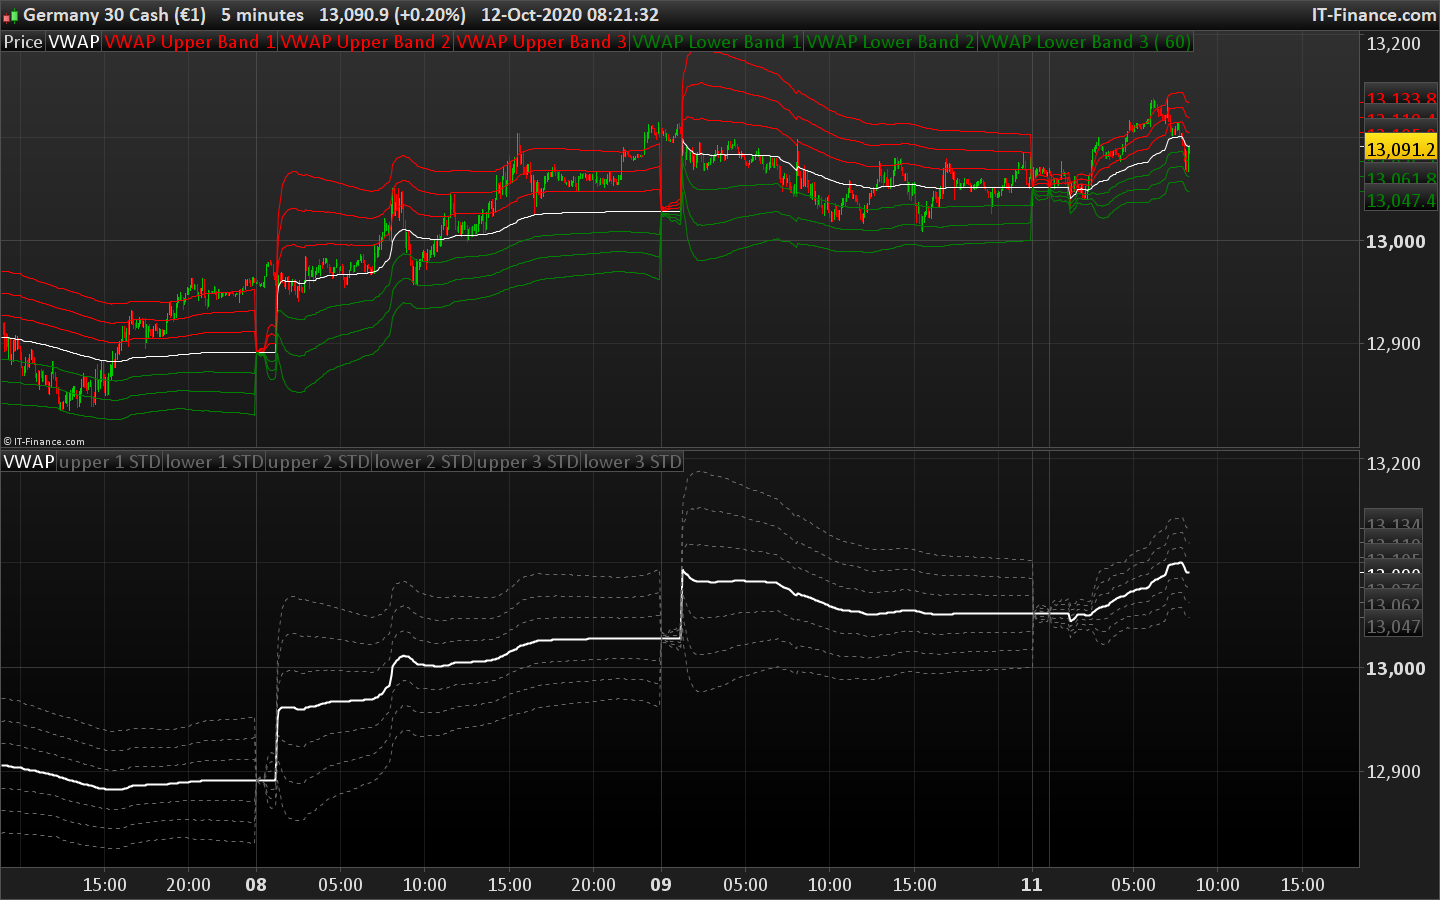
Thank you very much again, I tried JS your VWAP indicator but I have seen that it does not work very well.
I attached a screenshot with the configuration I have in the platform’s Bandas VWAP (blue line) and the two VWAPs made with code. The green line is the intraday PRC_VWAP that resets at each interval and the VWAP (red line) is the last code posted by you in the community.
Thank you very much.
JSParticipant
Veteran
Hi,
When the last code is used, the continuous VWAP, and you want to compare it with the standard indicator, VWAP Bands, you should NOT set a time interval but take the setting “all” (todos)…
You should also use the “typical price”…
Hi guys is there any update with this please?
I seem to be unable to add the default VWA Bands (Daily) into a trading system as its not in the selectable list even though its added to and visible on the chart.
Many Thanks
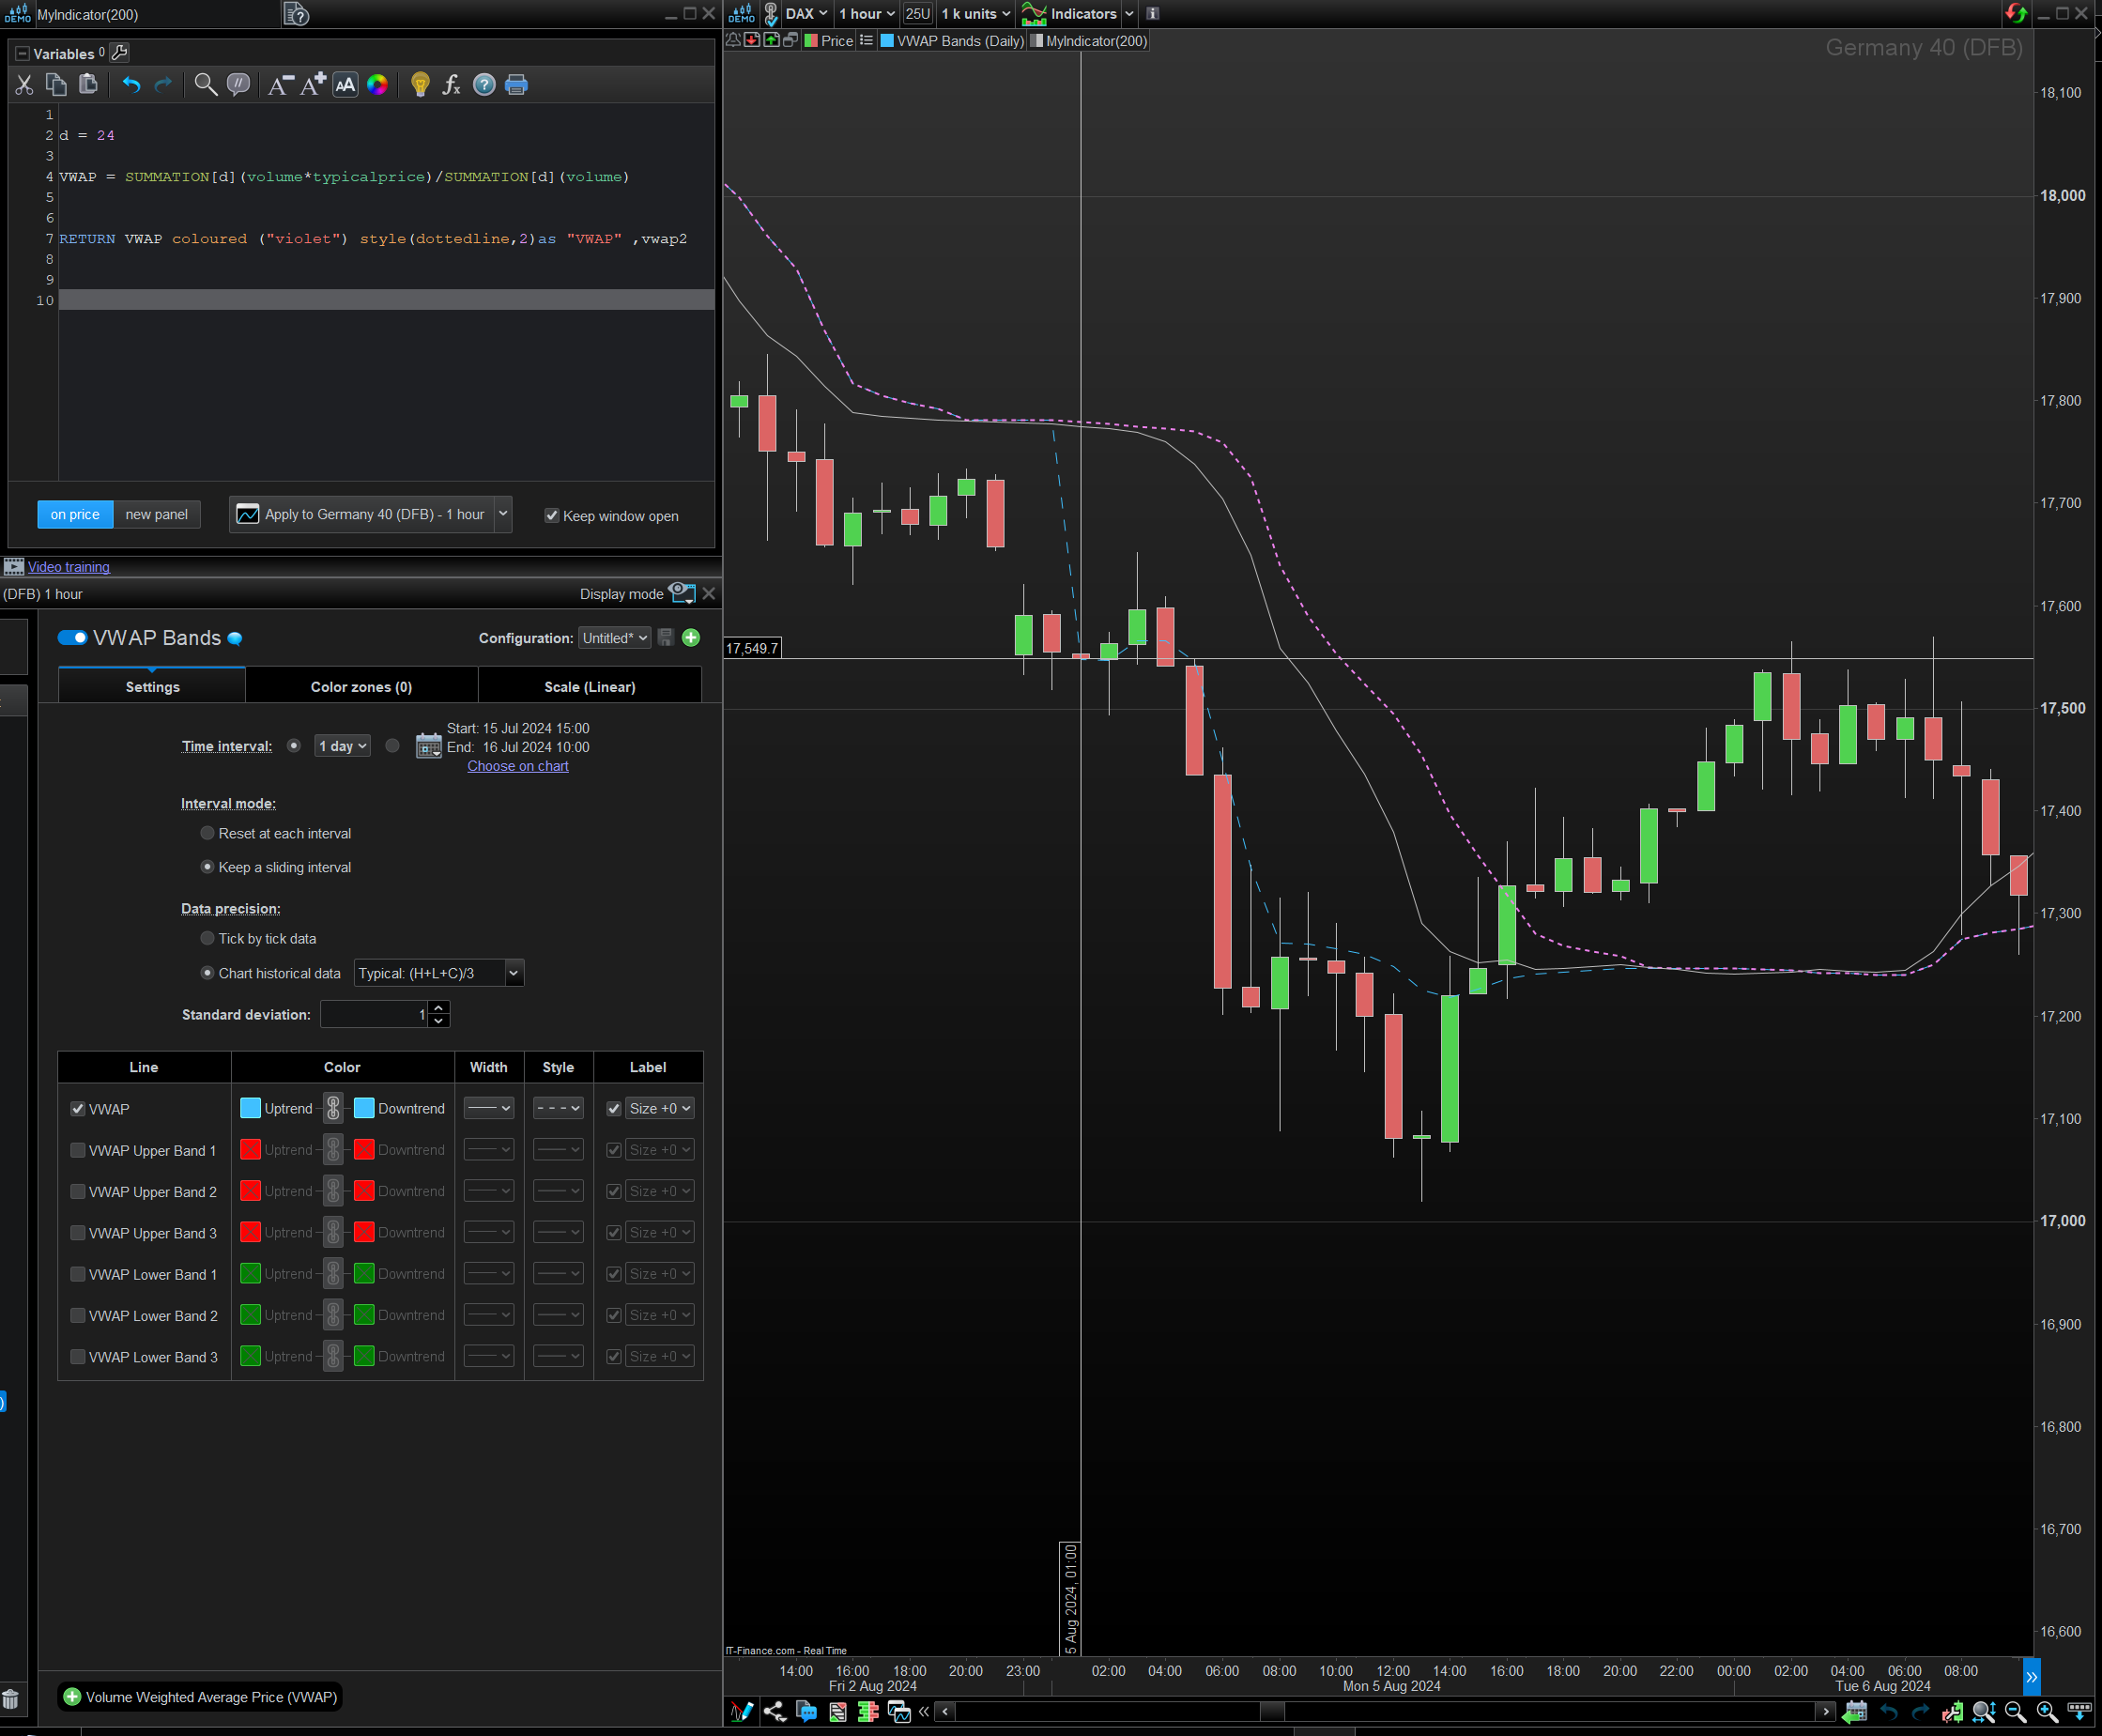
I was trying to verify that the VWAP statement, see code in image, tracked with the stock VWAP Bands(Daily) VWAP.
It tracks perfectly till it gets to 1am every Monday where it deviates.
When it deviates it appears to jump to a value which is equivalent to the typical price of that candle.
Then going forward eventually deviates back.
I can’t figure out how the mechanism of the jump or the return back.
I was using the ‘Dax’ German40 (DFB) on 1 hour Timeframe.
Tried others and they too have a jump to the Typical Price, However the days and times differ.
Any idea’s…