Hi Guys ,
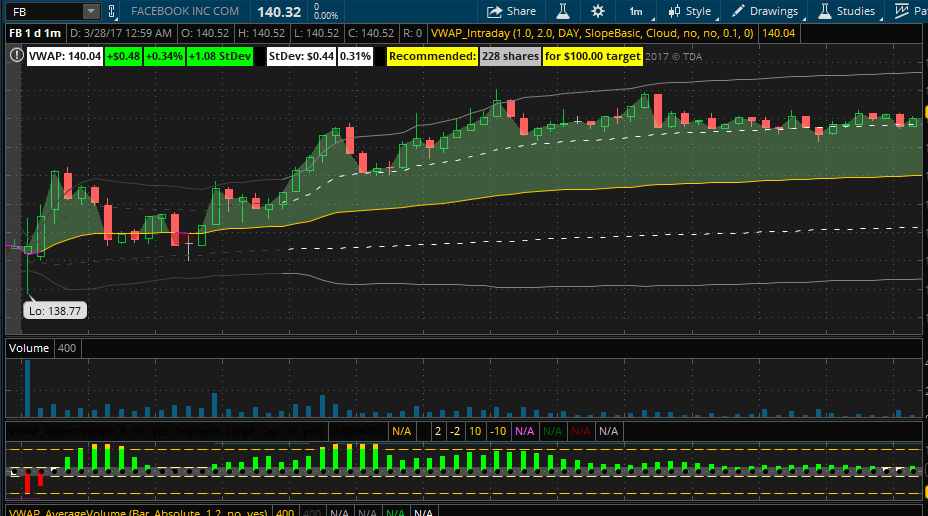
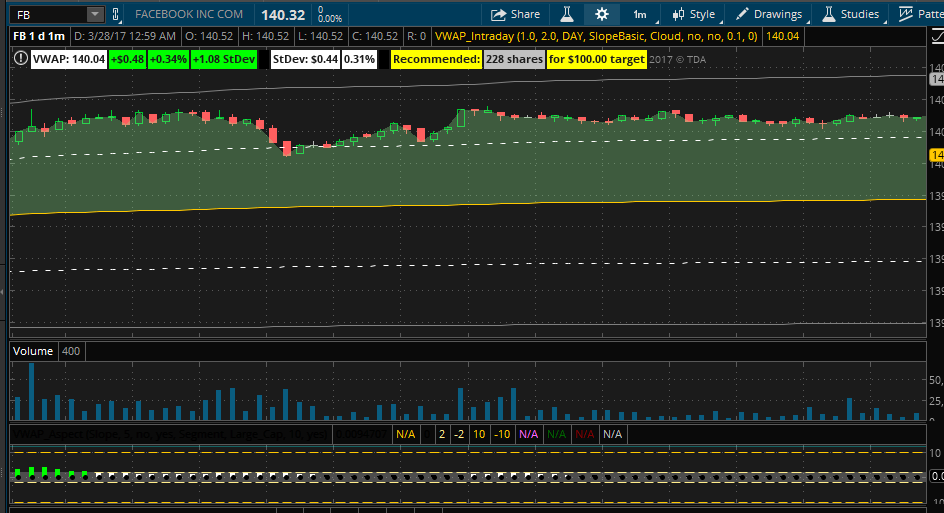
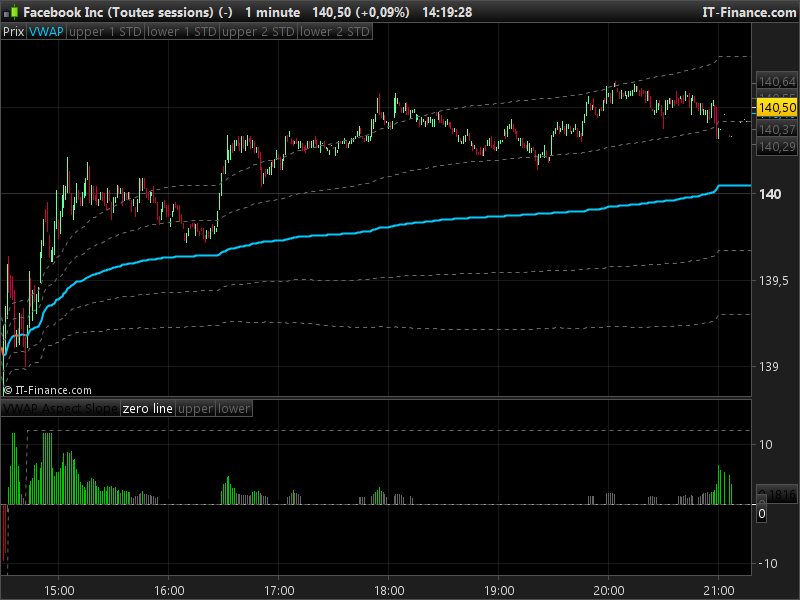
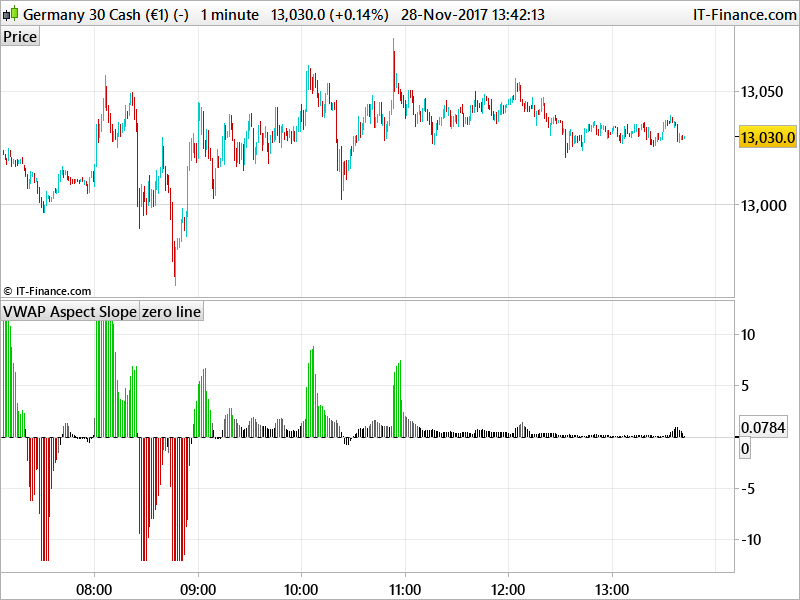
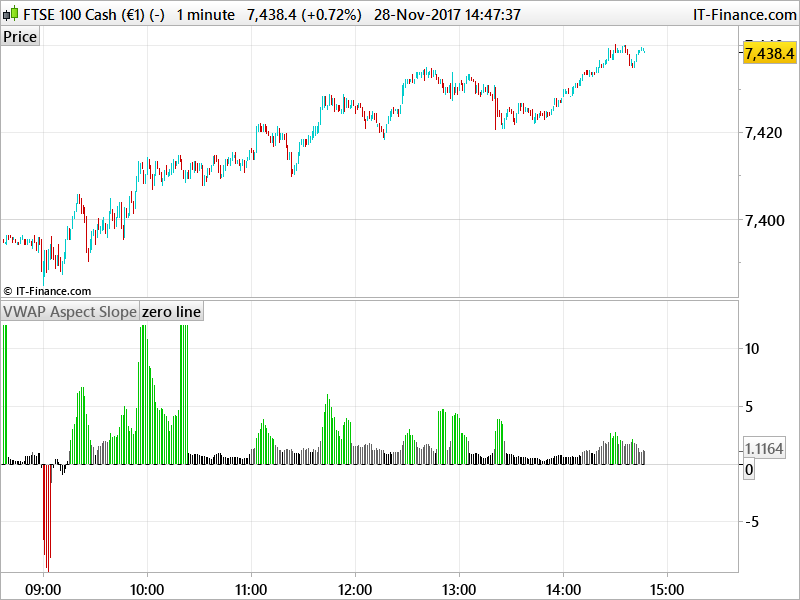
Please find attached the code from TOS for the VWAP aspect ratio – this is useful as it displays the slope of the VWAP in a bar graph format.
#hint: Plots position (distance relative to VWAP, expressed in standard deviations), intensity (VWAP slope), or a comparison of current-vs.-historical-average VWAP deviation width across the (user-defined) chart length.

#hint Aspect: Displays either position (distance relative to VWAP, expressed in standard deviations), intensity (VWAP slope), or current-vs.-historical-average VWAP deviation width.
#hint Slope_length: The number of bars over which the VWAP slope is calculated.  (default = 5, calibrated for a 1min chart basis)
#hint Price_Color: [BETA] Displays price colorization in accordance with likely trend signal (or not).
#hint Zeroline_Color: Displays yellow highlighting when current deviation width exceeds the chart length's average width.
#hint Slope_Style: Choose display style for slope (Segment subdivides brackets of slope intensity, while Gradient calls a dynamic gradient for the current day).
#hint Sensitivity: Choose the level of preset sensitivity according to trading product type.
#hint Custom_Sensitivity: User-defined coefficient for displaying Slope values in appropriate context for a given product.
#hint Slope_Trend: Displays highlighting at the upper and lower extremes of the slope plot to signify consistent directionality of slope (indicative of sustained long or short activity).

declare lower;

input Aspect = {"Position", default "Slope", "DevWidth"};
input Slope_length = 5;
input Price_Color = no;
input Zeroline_Color = yes;
input Slope_Style = {default Segment, Gradient};
input Sensitivity = {default Large_Cap, Small_Cap, ETF_or_Index, Futures, Custom};
input Custom_Sensitivity = 10;
input Slope_Trend = yes;

def Equities_Futures = if TickValue() * TickSize() == 0.0001 then 1 else 0;

def coefficient;
switch (Sensitivity) {
case Small_Cap:
    coefficient = 5;
case ETF_or_Index:
    coefficient = 3;
case Futures:
    coefficient = 2;
case Custom:
    coefficient = Custom_Sensitivity;
default:
    coefficient = 1;
};

def SecondsFromStart = (GetTime() - RegularTradingStart(GetYYYYMMDD())) / 1000;
def time = if SecondsFromStart < 0 then -1 else if Between(SecondsFromStart, 0, 1200) then 0 else if Between(SecondsFromStart, 1200, 1800) then 1 else if SecondsFromStart > 1800 then 2 else Double.NaN;
def NewDay = CompoundValue(1, GetYYYYMMDD() != GetYYYYMMDD()[1] and !IsNaN(close), yes);
def DayCount = TotalSum(NewDay);
def BarNo = if NewDay then 1 else BarNo[1] + 1;

def minor = 2;
def major = 10;

def VW = reference VWAP();
def VWone = reference VWAP(-1.0, 1.0)."UpperBand";
def deviation = VWone - VW;

def current_price = close;
def pureslope = (VW - VW[Slope_length]) / Slope_length;
def adjustedslope = (pureslope / current_price) * 100000 * coefficient;

plot slope = if aspect == aspect."Slope" then if Slope_Style == Slope_Style."Segment" then if adjustedslope > 0 then Min(10, adjustedslope) else Max(-10, adjustedslope) else if adjustedslope > 0 then Min(12, adjustedslope) else Max(-12, adjustedslope) else Double.NaN;

slope.SetPaintingStrategy(PaintingStrategy.HISTOGRAM);
slope.AssignValueColor(if slope >= major then Color.GREEN else
                       if Between(slope, minor, major) then Color.GREEN else
                       if Between(slope, minor/2, minor) then Color.WHITE else
                       if Between(slope, -minor, -minor/2) then Color.WHITE else
                       if Between(slope, -major, -minor) then Color.RED else
                       if slope <= -major then Color.RED else Color.BLACK);
slope.SetHiding(Aspect != Aspect."Slope" or (Aspect == Aspect."Slope" and Slope_Style == Slope_Style."Gradient"));

plot slope_highlight = if aspect == aspect."Slope" and !Between(adjustedslope,-major,major) then if adjustedslope > 0 then Min(12, adjustedslope) else Max(-12, adjustedslope) else Double.NaN;
slope_highlight.SetDefaultColor(color.ORANGE);
slope_highlight.SetPaintingStrategy(paintingstrategy.HISTOGRAM);
slope_highlight.SetHiding(Slope_Style == Slope_Style."Gradient");

def Pos_Slope = if Slope_Style == Slope_Style."Gradient" then if slope > 0 then slope else Double.NaN else Double.NaN;
def Neg_Slope = if Slope_Style == Slope_Style."Gradient" then if slope < 0 then slope else Double.NaN else Double.NaN;

plot Slope_Pos = Round(Pos_Slope, 2);
Slope_Pos.SetPaintingStrategy(PaintingStrategy.SQUARED_HISTOGRAM);
Slope_Pos.AssignNormGradientColor(BarNo + 1, Color.WHITE, Color.GREEN);
Slope_Pos.SetHiding(Aspect != Aspect."Slope" or (Aspect == Aspect."Slope" and Slope_Style == Slope_Style."Segment"));

plot Slope_Neg = Round(Neg_Slope);
Slope_Neg.SetPaintingStrategy(PaintingStrategy.SQUARED_HISTOGRAM);
Slope_Neg.AssignNormGradientColor(BarNo + 1, Color.RED, Color.WHITE);
Slope_Neg.SetHiding(Aspect != Aspect."Slope" or (Aspect == Aspect."Slope" and Slope_Style == Slope_Style."Segment"));

def DevRec = if time == 2 then deviation else DevRec[1];
def AccumDev = if time == 2 then AccumDev[1] + DevRec else AccumDev[1];
def Count = CompoundValue(1, if time == 2 then Count[1] + 1 else Count[1], 0);
def Avg_Dev_Width = CompoundValue(1800 / (GetAggregationPeriod() / 1000), AccumDev / Count, 0);

plot zeroline = 0;
zeroline.SetLineWeight(if Aspect == Aspect."Slope" and Slope_Style == Slope_Style."Segment" then 2 else 1);
zeroline.SetPaintingStrategy(if (Aspect == Aspect."Slope" and Slope_Style == Slope_Style."Segment") then PaintingStrategy.POINTS else PaintingStrategy.LINE);
zeroline.AssignValueColor(if Aspect == Aspect."Slope" then Color.BLACK else if Aspect == Aspect."DevWidth" then if deviation > Avg_Dev_Width then Color.ORANGE else Color.LIGHT_GRAY else if Aspect == Aspect."Position" then Color.LIGHT_GRAY else Color.BLACK);

plot R1 = if Aspect == Aspect."Slope" and slope < minor then minor else Double.NaN;
R1.SetPaintingStrategy(PaintingStrategy.DASHES);
R1.SetDefaultColor(CreateColor(255, 236, 139));
plot S1 = if Aspect == Aspect."Slope" and slope > -minor then -minor else Double.NaN;
S1.SetPaintingStrategy(PaintingStrategy.DASHES);
S1.SetDefaultColor(CreateColor(255, 236, 139));
plot R2 = if Aspect == Aspect."Slope" and slope < major then major else Double.NaN;
R2.SetPaintingStrategy(PaintingStrategy.DASHES);
R2.SetDefaultColor(Color.ORANGE);
plot S2 = if Aspect == Aspect."Slope" and slope > -major then -major else Double.NaN;
S2.SetPaintingStrategy(PaintingStrategy.DASHES);
S2.SetDefaultColor(Color.ORANGE);

def upper = if Slope_Trend and Aspect == Aspect."Slope" and slope > 0 and slope[1] > 0 and slope[10] > 0 then 12.5 else Double.NaN;
def lower = if Slope_Trend and Aspect == Aspect."Slope" and slope < 0 and slope[1] < 0 and slope[10] < 0 then -12.5 else Double.NaN;

AddCloud(if Aspect == Aspect."Slope" then minor else Double.NaN, if Aspect == Aspect."Slope" then -minor else Double.NaN, Color.LIGHT_GRAY, Color.WHITE);
AddCloud(upper, 12, Color.CYAN, Color.WHITE);
AddCloud(-12, lower, Color.MAGENTA, Color.WHITE);

plot DfV =
if Aspect == Aspect."Position" then
  if GetYYYYMMDD() == GetYYYYMMDD()[1] then
    if time >= 1 then
      if ((close - VW) / deviation) <= -3 then -3
      else if ((close - VW) / deviation) >= 3 then 3
      else ((close - VW) / deviation)
    else 0
  else Double.NaN
else Double.NaN;

def z = if Aspect == Aspect."Position" then 0 else Double.NaN;
AddCloud(DfV, z, Color.LIGHT_GREEN, Color.LIGHT_RED);
DfV.AssignNormGradientColor(14, Color.LIGHT_RED, Color.LIME);

plot U2 = if Aspect == Aspect."Position" then 2 else Double.NaN;
U2.SetDefaultColor(Color.DARK_GREEN);
U2.AssignValueColor(if DfV > U2 then Color.YELLOW else Color.DARK_GREEN);
U2.SetLineWeight(2);

plot U1 = if Aspect == Aspect."Position" then 1 else Double.NaN;
U1.SetDefaultColor(Color.LIGHT_GREEN);
U1.AssignValueColor(if DfV > U1 then Color.YELLOW else Color.LIGHT_GREEN);
U1.SetStyle(Curve.SHORT_DASH);
U1.HideTitle();

plot U25 = if Aspect == Aspect."Position" then 2.5 else Double.NaN;
U25.SetDefaultColor(Color.DARK_GREEN);
U25.AssignValueColor(if DfV > U25 then Color.YELLOW else Color.DARK_GREEN);
U25.SetStyle(Curve.SHORT_DASH);
U25.HideTitle();

plot L2 = if Aspect == Aspect."Position" then -2 else Double.NaN;
L2.SetDefaultColor(Color.DARK_RED);
L2.AssignValueColor(if DfV < L2 then Color.YELLOW else Color.DARK_RED);
L2.SetLineWeight(2);

plot L1 = if Aspect == Aspect."Position" then -1 else Double.NaN;
L1.SetDefaultColor(Color.LIGHT_RED);
L1.AssignValueColor(if DfV < L1 then Color.YELLOW else Color.LIGHT_RED);
L1.SetStyle(Curve.SHORT_DASH);
L1.HideTitle();

plot L25 = if Aspect == Aspect."Position" then -2.5 else Double.NaN;
L25.SetDefaultColor(Color.DARK_RED);
L25.AssignValueColor(if DfV < L25 then Color.YELLOW else Color.DARK_RED);
L25.SetStyle(Curve.SHORT_DASH);
L25.HideTitle();

plot Signal_Line = if Aspect == Aspect."DevWidth" then 0 - Round((Avg_Dev_Width / 3), 2) else Double.NaN;
Signal_Line.SetDefaultColor(Color.LIGHT_GRAY);
Signal_Line.SetStyle(Curve.SHORT_DASH);

plot difference = if Aspect == Aspect."DevWidth" then if GetYYYYMMDD() != GetYYYYMMDD()[1] then Double.NaN else Round(deviation - (Avg_Dev_Width), 2) else Double.NaN;
difference.AssignValueColor(if difference > 0 then Color.CYAN else if difference < Signal_Line then Color.RED else Color.WHITE);
difference.SetLineWeight(1);
difference.SetPaintingStrategy(PaintingStrategy.HORIZONTAL);
difference.Hide();

AddLabel(Aspect == Aspect."DevWidth", "Avg. StDev: " + AsDollars(Round(Avg_Dev_Width, 2)), Color.WHITE);
AddLabel(Aspect == Aspect."DevWidth", " ", Color.BLACK);
AddLabel(Aspect == Aspect."DevWidth", "Current StDev: " + AsDollars(Round(deviation, 2)), if difference >= 0 then Color.LIGHT_GREEN else Color.PINK);
AddLabel(Aspect == Aspect."DevWidth", " ", Color.BLACK);

AddLabel(if difference > 0 then yes else no, "Diff: +" + AsDollars(Round(difference, 2)) + " (" + AsPercent(1 + Round(difference / Avg_Dev_Width, 2)) + " of Avg.)", Color.LIGHT_GREEN);
AddLabel(if difference <= 0 then yes else no, "Diff: -$" + AbsValue(Round(difference, 2)) + " (" + AsPercent(1 + Round(difference / Avg_Dev_Width, 2)) + " of Avg.)", Color.PINK);

AddCloud(difference, zeroline, CreateColor(50, 237, 190), Color.CURRENT);
def conditional = Min(zeroline, Max(Signal_Line, difference));
AddCloud(conditional, Signal_Line, CreateColor(144, 195, 212), Color.CURRENT);
AddCloud(Signal_Line, difference, Color.PINK, Color.CURRENT);

AddVerticalLine(if NewDay then yes else no , "", Color.DARK_GRAY, Curve.FIRM);

AssignPriceColor(if Price_Color then
if difference > zeroline and Between(close, VW, VW + deviation) then Color.WHITE else
if difference > zeroline and close > (VW + deviation) then Color.GREEN else
if difference > zeroline and Between(close, VW - deviation, VW) then Color.WHITE else
if difference > zeroline and close < (VW - deviation) then Color.RED else
Color.DARK_GRAY else Color.CURRENT);

#plot typicaldevwidth_upper = VW + (Avg_Dev_Width);
#plot typicaldevwidth_lower = VW - (Avg_Dev_Width);