Bonjour,
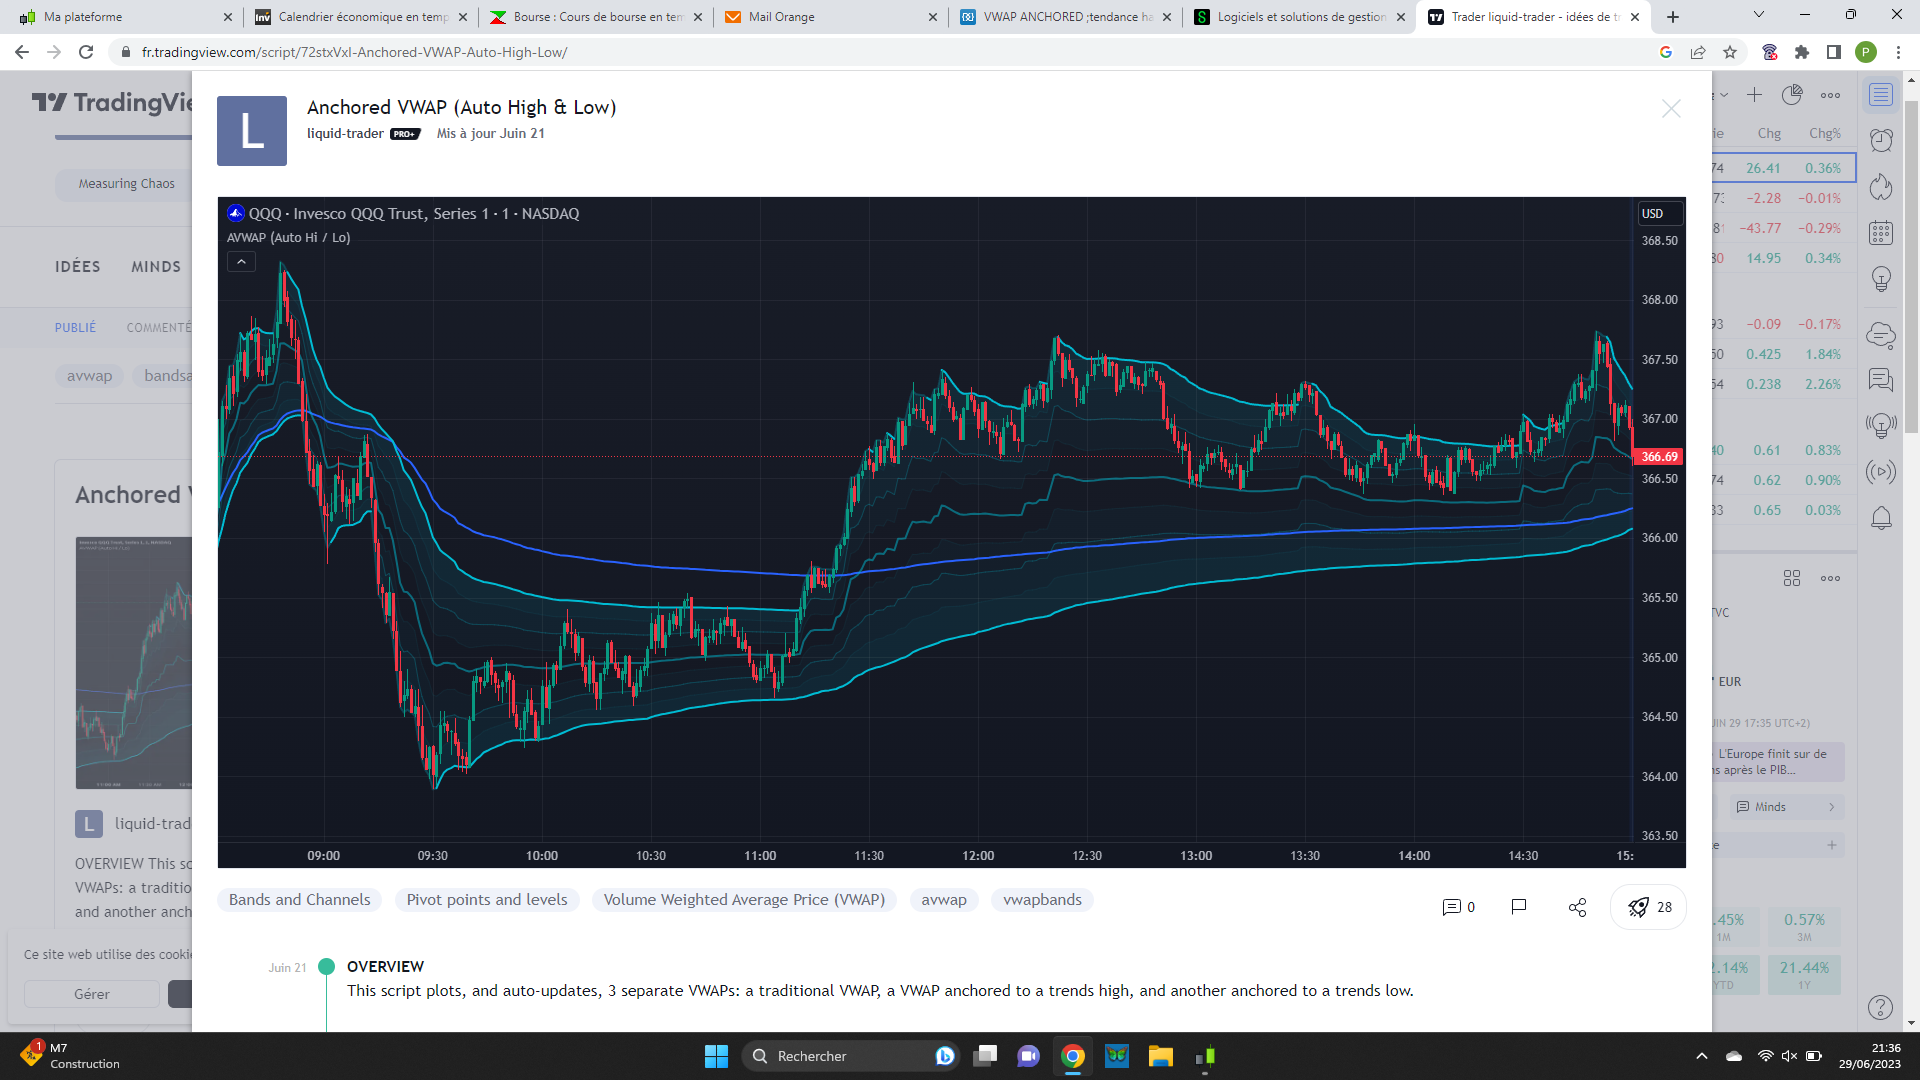
Voici un code mis en ligne par liquid-trader sur tradingview.
Ce script trace et met à jour automatiquement 3 VWAP distincts : un VWAP traditionnel, un VWAP ancré à une tendance haute et une autre ancrée à une tendance basse.
Les VWAP et les VWAP ancrés sont couramment utilisés par les institutions responsables de la majorité du volume du marché un jour donné. Citadel Trading, par exemple, représente environ 35 % de l’ensemble du volume de vente au détail coté aux États-Unis , en grande partie effectuée par le biais de transactions programmées au cours d’une journée, d’une semaine ou d’ un mois.
Étant donné que VWAP est un outil de création de marché de premier plan pour l’exécution de transactions importantes, les day traders peuvent l’utiliser pour mieux anticiper les tendances, le retour à la moyenne et les cassures.
Ceci est particulièrement utile sur les graphiques avec des délais intrajournaliers (1 minute, 5 minutes, etc.) couramment utilisés pour le day trading. Ce n’est pas idéal pour les périodes plus longues (1 heure ou plus) couramment utilisées pour le swing trading ou l’identification de tendances plus importantes.
N’étant pas programmeur, je vous joint le script ci-dessous.
Merci
//@version=5
indicator("Anchored VWAP (Auto High & Low)", "AVWAP (Auto Hi / Lo)", overlay=true, max_bars_back=1440), max_bars_back(time, 1440)

// Base Colors
none = color.new(color.black, 100)
clr1 = color.aqua
clr2 = color.blue

// VWAP Settings
var shoVWAP = input.bool(true, "VWAP", "The Volume Weighted Average Price is reset at the beginning of each session.", inline="vwap")
var vwapClr = input.color(clr2, "", inline="vwap")
var vWidth = input.int(2, "", 1, inline="vwap")

// High Anchor
var shoHiA = input.bool(true, "High Anchor", "VWAP anchored and weighted to trend highs.", inline="hi")
var hiAnClr = input.color(clr1, "", inline="hi")
var hiWidth = input.int(2, "", 1, inline="hi")

// Low Anchor
var shoLoA = input.bool(true, "Low Anchor", "VWAP anchored and weighted to trend lows.", inline="lo")
var loAnClr = input.color(clr1, "", inline="lo")
var loWidth = input.int(2, "", 1, inline="lo")

// Average of Anchors
var shoMid = input.bool(true, "Average of Anchors", "The mean (average) between the high and low anchored VWAP's", inline="mid")
var midClr = input.color(color.new(clr1, 50), "", inline="mid")
var mWidth = input.int(2, "", 1, inline="mid")

// Quarter levels
var shoQrt = input.bool(true, "Quarter values", "The median (middle) value between the mean (average) and high / low anchors.", inline="quarter")
var qrtClr = input.color(color.new(clr1, 80), "", inline="quarter")
var qWidth = input.int(1,"", 1, inline="quarter")

// Eight levels with fill
var shoFil = input.bool(true, "Interim Bands", "The ",  inline="fill")
var ethClr = input.color(color.new(clr1, 93), "", inline="fill")
var filClr = input.color(color.new(clr1, 97), "", inline="fill")

// Smooth Average of Anchors
var shoMA = input.bool(false, "Smooth Average", inline="smooth")
var maLen = input.int(3, "", 1, inline="smooth")
var maSrc = input.string("SMMA (RMA)", "", ["SMA", "EMA", "SMMA (RMA)", "WMA", "VWMA", "Linear Regression"], inline="smooth")

// Define new sessions.
newSession = timeframe.isdwm ? false : session.isfirstbar

// Put common price calls into variables.
o = open, h = high, l = low, c = close, index = bar_index

// Define candle patterns and parts.
candleBody = c > o ? c - o : o - c
rising = c > o
falling = o > c
upWick = rising ? h - c : h - o
dnWick = falling ? c - l : o - l
doji = (upWick >= candleBody or dnWick >= candleBody) and (h != o and h != c and l != o and l != c)
higher = o > o[1] and c > c[1]
lower = o < o[1] and c < c[1]
risingHigher = rising and higher
fallingLower = falling and lower

// Anchor variables.
var hi = h, var lo = l, var anchoredHi = h, var anchoredLo = l, var resetHiAnchor = false, var resetLoAnchor = false
var lastResetLo = index
var lastResetHi = index
var bullish = false
var bearish = false

// Logic for what qualifies as "breaking" the previous anchors.
breakingHigher = rising  and (c > hi or (c[1] > anchoredHi and c > h[1] and o > anchoredHi and not doji))
breakingLower  = falling and (c < lo or (c[1] < anchoredLo and c < l[1] and o < anchoredLo and not doji))

// Logic for when to reset anchors.
if newSession
    hi := h
    lo := l
    resetHiAnchor := true
    resetLoAnchor := true
    bullish := true
    bearish := true
    lastResetHi := not doji ? index : lastResetHi
    lastResetLo := not doji ? index : lastResetLo
else if breakingHigher
    hi := h
    resetHiAnchor := true
    bullish := true
    lastResetHi := index
else if breakingLower
    lo := l
    resetLoAnchor := true
    bearish := true
    lastResetLo := index
else
    resetHiAnchor := false
    resetLoAnchor := false

// Get how many number of bars have passed since the last reset.
hiResetIndex = index - lastResetHi
loResetIndex = index - lastResetLo

// Set the Anchored VWAP, and their average.
anchoredHi := ta.vwap(h, resetHiAnchor)
anchoredLo := ta.vwap(l, resetLoAnchor)
anchoredMean = math.avg(anchoredHi, anchoredLo)

// Smooth the average according to the traders settings.
if shoMA
    anchoredMean := switch maSrc
        "SMA" => ta.sma(anchoredMean, maLen)
        "EMA" => ta.ema(anchoredMean, maLen)
        "SMMA (RMA)" => ta.rma(anchoredMean, maLen)
        "WMA" => ta.wma(anchoredMean, maLen)
        "VWMA" => ta.vwma(anchoredMean, maLen)
        "Linear Regression" => ta.linreg(anchoredMean, maLen, 0)

// Set the anchored quarter values.
avg75 = math.avg(anchoredHi, anchoredMean), avg87 = math.avg(anchoredHi, avg75), avg62 = math.avg(avg75, anchoredMean)
avg25 = math.avg(anchoredLo, anchoredMean), avg12 = math.avg(anchoredLo, avg25), avg42 = math.avg(anchoredMean, avg25)

// VWAP
vwapColor = newSession ? none : vwapClr
var showHideVWAP = shoVWAP ? display.pane : display.none
plot(ta.vwap(hlc3, timeframe.change("1D")), "VWAP", vwapColor, vWidth, plot.style_linebr, false, na, na, na, false, na, showHideVWAP)

// Determine if a plot should display, based on the traders settings.
displayPlot(ifTrue) =>
    _return_ = ifTrue ? display.pane : display.none
var showHideH = displayPlot(shoHiA)
var showHideL = displayPlot(shoLoA)
var showHideM = displayPlot(shoMid)
var showHideTopQ = displayPlot(shoHiA and shoQrt)
var showHideBotQ = displayPlot(shoLoA and shoQrt)
var showHideTopE = displayPlot(shoHiA and shoFil)
var showHideBotE = displayPlot(shoLoA and shoFil)

// Function defining abnormal candle move continuation.
moveCont(a) =>
    switch a
        "higher" => hiResetIndex <= 5 and anchoredHi > anchoredHi[1]
        "lower"  => loResetIndex <= 5 and anchoredLo < anchoredLo[1]

// Function defining candle consolidation, relative to the previous anchor.
consolidating(i) =>
    _return_ = o <= h[i] and c <= h[i] and o >= l[i] and c >= l[i]

// Function to set the plot and fill colors.
clr(a, c) =>
    ifTrue = switch a
        "top" => bullish and (resetHiAnchor or moveCont("higher") or consolidating(hiResetIndex))
        "bot" => bearish and (resetLoAnchor or moveCont("lower") or consolidating(loResetIndex))
        => false
    _return_ = newSession ? none : ifTrue ? color.new(c, 75) : c

// Set the plot and fill colors.
tClr = clr("top", hiAnClr)
bClr = clr("bot", loAnClr)
mClr = clr("", midClr)
qClr = clr("", qrtClr)
fClr = clr("", filClr)
eClr = clr("", ethClr)

// Toggle the colors reset to be false, if it has been reset back to the user specified color.
bullish := tClr == hiAnClr ? false : bullish
bearish := bClr == loAnClr ? false : bearish

// Plot the top, bottom, and average anchor values.
top = plot(anchoredHi, "High Anchor", tClr, hiWidth, plot.style_linebr, false, na, na, na, false, na, showHideH)
bot = plot(anchoredLo, "Low Anchor", bClr, loWidth, plot.style_linebr, false, na, na, na, false, na, showHideL)
mid = plot(anchoredMean, "Average of Anchors", mClr, mWidth, plot.style_linebr, false, na, na, na, false, na, showHideM)

// Plot 1/4 values (half way between average and anchor).
t25 = plot(avg75, "Top 25% Line", qClr, qWidth, plot.style_linebr, false, na, na, na, false, na, showHideTopQ)
b25 = plot(avg25, "Bottom 25% Line", qClr, qWidth, plot.style_linebr, false, na, na, na, false, na, showHideBotQ)

// Plot 1/8 values.
t12  = plot(avg87, "Top 12.5% Line",eClr, 1, plot.style_linebr, false, na, na, na, false, na, showHideTopE)
t252 = plot(avg75, "Top 25% Line", eClr, 1, plot.style_linebr, false, na, na, na, false, na, showHideTopE)
t42  = plot(avg62, "Top 42.5% Line",eClr, 1, plot.style_linebr, false, na, na, na, false, na, showHideTopE)
b42  = plot(avg42, "Bottom 42.5% Line",eClr, 1, plot.style_linebr, false, na, na, na, false, na, showHideBotE)
b252 = plot(avg25, "Bottom 25% Line", eClr, 1, plot.style_linebr, false, na, na, na, false, na, showHideBotE)
b12  = plot(avg12, "Bottom 12.5% Line",eClr, 1, plot.style_linebr, false, na, na, na, false, na, showHideBotE)

// Determine if the fill should display, based on the traders settings.
displayFill(ifTrue) =>
    _return_ = ifTrue ? display.all : display.none
var showHideF = displayFill(shoFil)
var showHideTopF = displayFill(shoHiA and shoFil)
var showHideBotF = displayFill(shoLoA and shoFil)

// Plot fill.
fill(top, t12, fClr, "Top 12.5% Fill", false, display = showHideTopF)
fill(top, t25, fClr, "Top 25% Fill", false, display = showHideTopF)
fill(top, t42, fClr, "Top 42.5% Fill", false, display = showHideTopF)
fill(bot, b42, fClr, "Bottom 42.5% Fill", false, display = showHideBotF)
fill(bot, b25, fClr, "Bottom 25% Fill", false, display = showHideBotF)
fill(bot, b12, fClr, "Bottom 12.5% Fill", false, display = showHideBotF)