Nicholas, herewith the lastest offering…any thoughts?
Robert
defparam CALCULATEONLASTBARS=2000
bi=barindex
i=100
//define first time factor
factor=bi/i
if bi=(i*factor) then
factor=round(factor)
endif
if factor<>factor[1] then
b=bi
endif
count=0
while b=b[1] do
count=count[1]+1
break
wend
counter=round(count)
ii=0
for ii=ii to counter[100] do
if factor[0]>factor[1] then
DRAWVLINE(barindex[0])
endif
next
for ii= 1 to counter[100] do
if counter[0]>1 and close[0]>open[1] then
DRAWSEGMENT((barindex[0]-counter[0])+(volume[0]), close[0],(barindex[0]-counter[0]), close[0]) coloured(0,255,0)
endif
break
break
next
for ii= 1 to counter[100] do
if counter[0]>1 and close[0]<open[1] then
DRAWSEGMENT((barindex[0]-counter[0])+(volume[0]), close[0]+.1,(barindex[0]-counter[0]), close[0]+.1) coloured(255,0,0)
endif
break
break
next
return close[0]
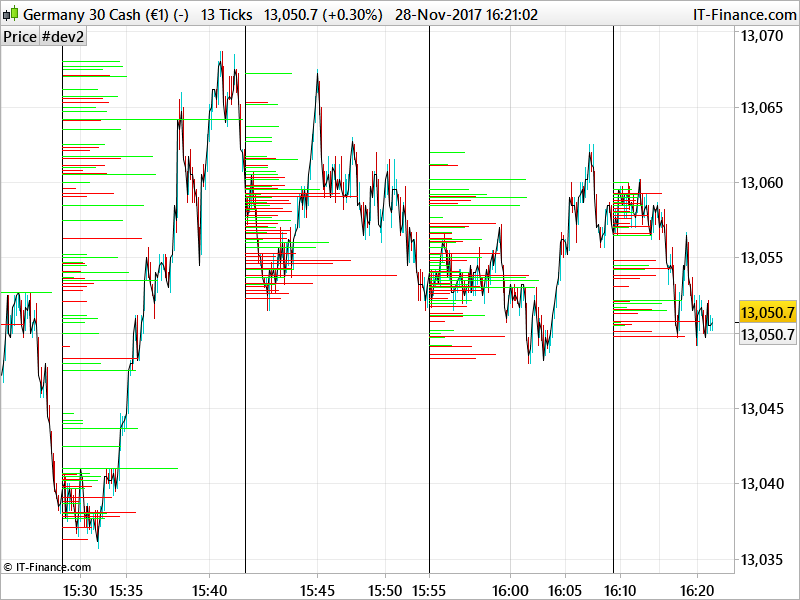
Works on smaller time frames i.ev 13 tick chart at the moment….will need to place with the volume scale(ratio) in order to get it to fit in between the vertical bars.
Very nice Robert!
> For clarity of messages on ProRealCode’s forums, please use the “insert code PRT” button to separate the text of the code part! Thank you! <<
I’m trying to read your code, but I don’t really understand why you are making loops but not using their increments in your calculation? You are also adding Volume to Barindex to create coordinate for segments?! Is this a way to simulate their weight between them?
Thank you Nicholas,
The Vertical line is the tether point. I.E every X bars or (i=100). I am …and have …for a while now …been trying to code it so that the volume bar is tether to the vertical, the use of the ‘segment’ is indeed the volume wieght.(DRAWSEGMENT((barindex[0]-counter[0])+(volume[0]), close[0],(barindex[0]-counter[0]), close[0]) coloured(0,255,0))
I hope this makes sense( although i doubt it!)
If you think you can stream line this I would be grateful if you could give it a go…as my coding runs along the ‘blind pig’ pig method.
Robert
About the vertical line, I understood the principle. I know that it is a big problem to calculate all the volumes by price zones and draw them on the graph with a weighted weight vis-à-vis all the other volumes already found (and without arrays!), This is why I have not yet managed to code something really satisfying. In this sense I congratulate you for the work done here. But, without wanting to offend you, the way you coded the indicator is a bit “weird” for me 🙂 Especially about loops that are useless so I don’t know where to start to help you finish it 🙂
No offense taken! My coding is basic at best. I think it best if I post the code that you supplied me with at the start of this excersise, then try and explain my thinking.
At the bottom of the linked page is the code you gave me for higher time frames. It is the start of the volume profile code.
code for one tick time frame to another
Here is a cleaned up version!!
defparam CALCULATEONLASTBARS=2000
bi=barindex
i=39
//define first time factor
factor=bi/i

if bi=(i*factor) then

factor=round(factor)
endif
if factor<>factor[1] then
b=bi
endif
count=0
while b=b[1] do
count=count[1]+1
break
wend


for i= .1 to count[100] do
if count[0]>.01 and close[0]>open[0] then


DRAWRECTANGLE((barindex[0]-count[0])+(volume[0]), close[0]+.02,(barindex[0]-count[0]), close[0]+.01) coloured(0,255,0)
endif

break

break
next
for i= .1 to count[100] do
if count[0]>.01 and close[0]<open[0] then


DRAWRECTANGLE((barindex[0]-count[0])+(volume[0]), close[0]+.03,(barindex[0]-count[0]), close[0]+.04) coloured(255,0,0)
endif

break

break
next


return close[0]
Very interesting Robert, why do not you see it on a daily basis?
Bolsatrilera, it will work if you play about with the volume…I.E
Instead of the below ..
DRAWRECTANGLE((barindex[0]–count[0])+(volume[0]), close[0]+.02,(barindex[0]–count[0]), close[0]+.01) coloured(0,255,0)
endif
Try…
DRAWRECTANGLE((barindex[0]–count[0])+(volume[0]/1000), close[0]+.02,(barindex[0]–count[0]), close[0]+.01) coloured(0,255,0)
endif
hope that helps.
Hi Robert – really very cool – even for a pig coder 🙂
It is clunky but I think this is necessary to overcome some of the shortcomings in PRT.
FWIW tweak i=20 and the volume statement to (volume[0]/100) to get it to work with a 100 tick CL chart, (on IG).
Good Luck
Copperwave
Thanks Copper-I think, going forward, that the start of the code-i.e the ability to ‘section’ the chart into time frames might be quite useful for finding Fib times….just a thought.
R