Hi, here you have the code translated:
// Parameter declaration
EMALen = 25  // Adjustable EMA length set by the user

// Calculation variables
xROC = ROC[1](Close)  // Rate of Change of the closing price

// Ensure enough bars exist for EMA calculation
IF BarIndex > EMALen THEN

    // Calculate nRes1 based on decreasing volume
    IF Volume < Volume[1] THEN
        nRes1 = nRes1[1] + xROC
    ELSE
        nRes1 = nRes1[1]
    ENDIF

    // Calculate nRes2 based on increasing volume
    IF Volume > Volume[1] THEN
        nRes2 = nRes2[1] + xROC
    ELSE
        nRes2 = nRes2[1]
    ENDIF

    // Combine results to compute nRes3
    nRes3 = nRes1 + nRes2  // Combine nRes1 and nRes2 to compute the main indicator

    // Calculate EMA (Exponential Moving Average) of the accumulators
    nResEMA1 = Average[EMALen](nRes1)
    nResEMA2 = Average[EMALen](nRes2)
    nResEMA3 = nResEMA1 + nResEMA2  // Combine the EMAs of nRes1 and nRes2 to get the total EMA

    // Determine fill color based on the relationship between nRes3 and nResEMA3
    IF nRes3 > nResEMA3 THEN
        r = 0
        g = 0
        b = 255
    ELSE
        r = 255
        g = 0
        b = 0
    ENDIF

    // Draw the shaded area between nRes3 and nResEMA3 with the calculated color
    ColorBetween(nRes3, nResEMA3, r, g, b, 30)

ENDIF

// Return the results on the chart
RETURN nRes3 AS "PVI+NVI" COLOURED("blue"), nResEMA3 AS "EMA" COLOURED("red")
Ivan, Thank you, Thank you Thank you.
Perfect – Very grateful
Would it be possible to include the option to paint the EMA line completely red as it is now OR green if Rate of Change is > zero and Red if ROC is < zero and black if ROC = zero? Not necessary on the other line, just the EMA.
Hope that is not pushing the boundaries too much.
Thyank you
Bruce
No problem. Here you have it
// Parameter declaration
EMALen = 25  // Adjustable EMA length set by the user

// Calculation variables
xROC = ROC[1](Close)  // Rate of Change of the closing price

// Ensure enough bars exist for EMA calculation
IF BarIndex > EMALen THEN

// Calculate nRes1 based on decreasing volume
IF Volume < Volume[1] THEN
nRes1 = nRes1[1] + xROC
ELSE
nRes1 = nRes1[1]
ENDIF

// Calculate nRes2 based on increasing volume
IF Volume > Volume[1] THEN
nRes2 = nRes2[1] + xROC
ELSE
nRes2 = nRes2[1]
ENDIF

// Combine results to compute nRes3
nRes3 = nRes1 + nRes2  // Combine nRes1 and nRes2 to compute the main indicator

// Calculate EMA (Exponential Moving Average) of the accumulators
nResEMA1 = Average[EMALen](nRes1)
nResEMA2 = Average[EMALen](nRes2)
nResEMA3 = nResEMA1 + nResEMA2  // Combine the EMAs of nRes1 and nRes2 to get the total EMA

// Determine fill color based on the relationship between nRes3 and nResEMA3
IF nRes3 > nResEMA3 THEN
r = 0
g = 0
b = 255
ELSE
r = 255
g = 0
b = 0
ENDIF

// Draw the shaded area between nRes3 and nResEMA3 with the calculated color
ColorBetween(nRes3, nResEMA3, r, g, b, 30)

// Determine EMA color based on ROC
if xROC > 0 then
r1=0
g1=255
b1=0
elsif xROC < 0 then
r1=255
g1=0
b1=0
else
r1=0
g1=0
b1=0
endif

ENDIF

// Return the results on the chart
RETURN nRes3 AS "PVI+NVI" COLOURED("blue"), nResEMA3 AS "EMA" COLOURED(r1,g1,b1)
Thank you Ivan. Only issue now is that the colour of the EMA line changes based on the Rate of Change (ROC) of the PVI+NVI Line, not the ROC of the EMA line itself.
Thank you
Bruce
 JS
JSParticipant
Veteran
Hi,
Do you mean like this…?
DefParam DrawOnLastBarOnly=true
// Parameter declaration
EMALen = 25  // Adjustable EMA length set by the user

// Calculation variables
xROC = ROC[1](Close)  // Rate of Change of the closing price

// Ensure enough bars exist for EMA calculation
IF BarIndex > EMALen THEN

// Calculate nRes1 based on decreasing volume
IF Volume < Volume[1] THEN
nRes1 = nRes1 + xROC
ELSE
nRes1 = nRes1
ENDIF

// Calculate nRes2 based on increasing volume
IF Volume > Volume[1] THEN
nRes2 = nRes2 + xROC
ELSE
nRes2 = nRes2
ENDIF

// Combine results to compute nRes3
nRes3 = nRes1 + nRes2  // Combine nRes1 and nRes2 to compute the main indicator

// Calculate EMA (Exponential Moving Average) of the accumulators
nResEMA1 = Average[EMALen,1](nRes1)
nResEMA2 = Average[EMALen,1](nRes2)
nResEMA3 = nResEMA1 + nResEMA2  // Combine the EMAs of nRes1 and nRes2 to get the total EMA

// Determine fill color based on the relationship between nRes3 and nResEMA3
IF nRes3 > nResEMA3 THEN
r = 0
g = 0
b = 255
ELSE
r = 255
g = 0
b = 0
ENDIF

// Draw the shaded area between nRes3 and nResEMA3 with the calculated color
ColorBetween(nRes3, nResEMA3, r, g, b, 30)
EndIf

EMAROC=ROC[1](nResEMA3)

If EMAROC>0 then
r=0
g=255
b=0
ElsIf EMAROC<0 then
r=255
g=0
b=0
Else
r=0
g=0
b=0
EndIf


// Return the results on the chart
RETURN nRes3 AS "PVI+NVI" COLOURED("blue"), nResEMA3 AS "EMA" COLOURED(r,g,b)
Hi Ivan, Apologies for delay in getting back to you.
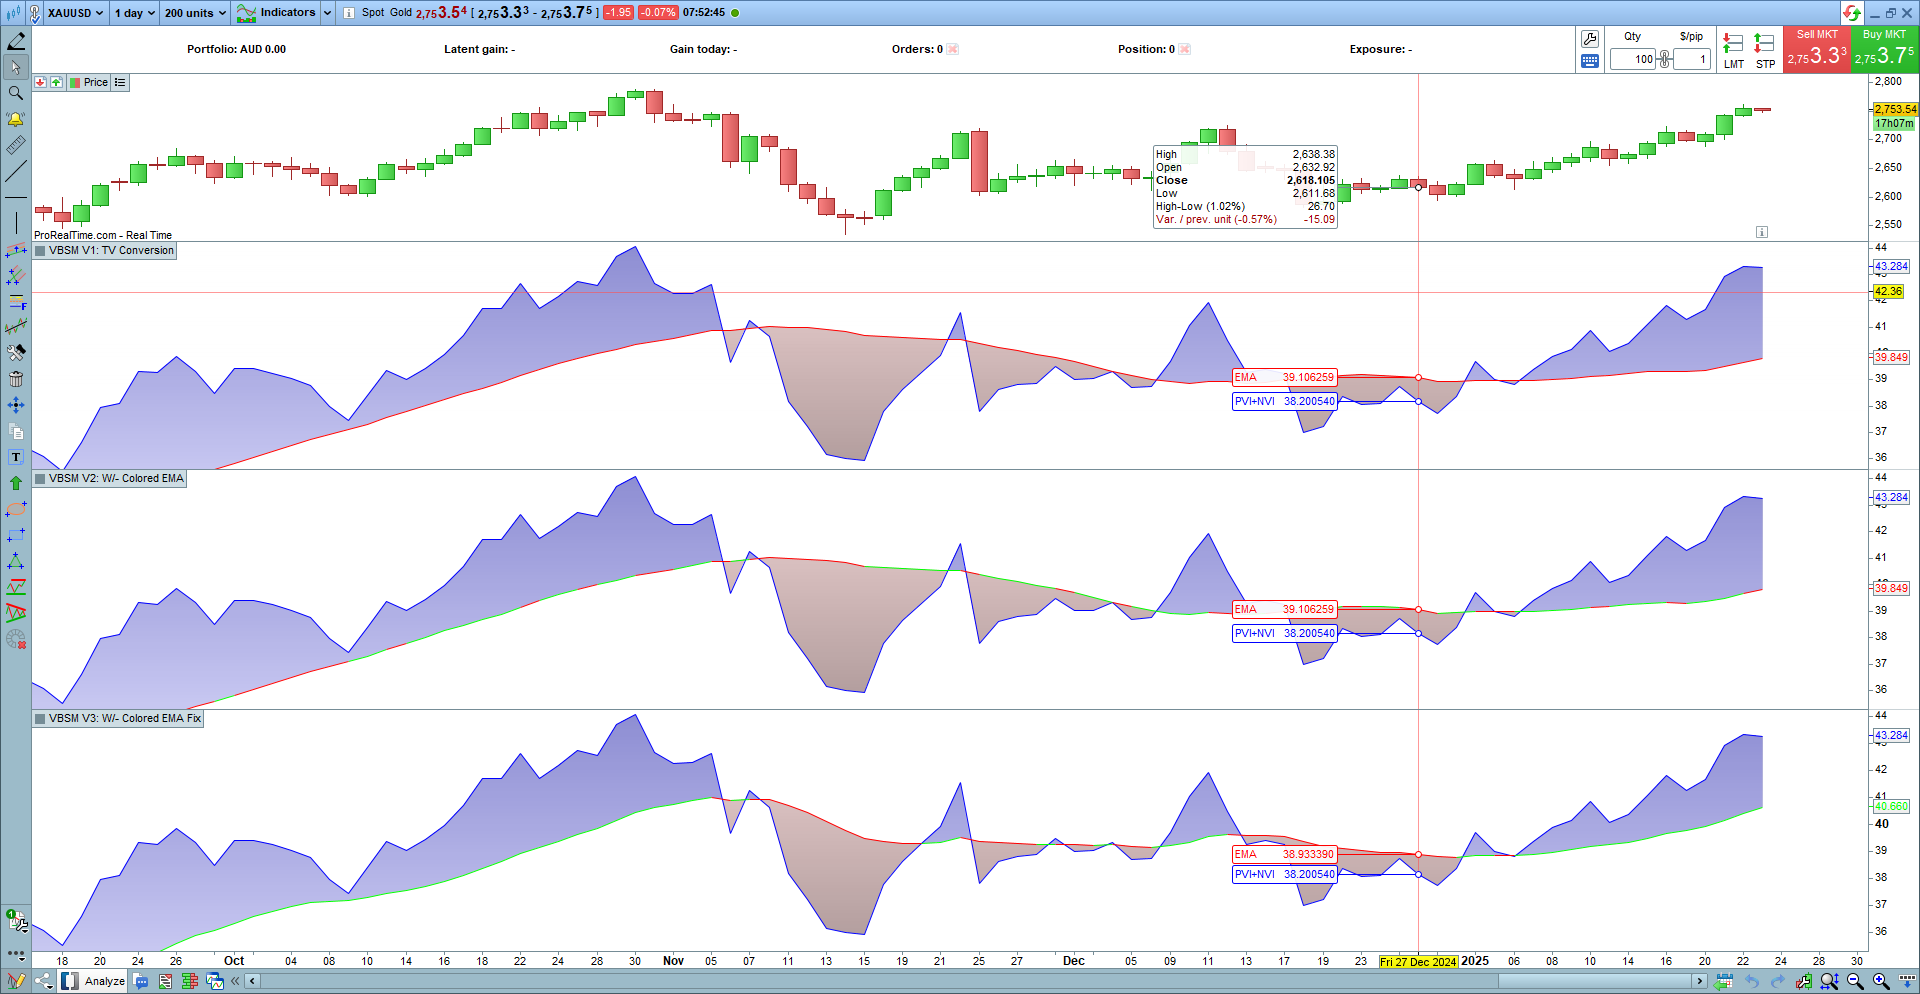
I think the green (up trend) and red (down trend) of the EMA is now painting correctly on the EMA line on the chart, based on the slope of the EMA – see Pane 4 on attached chart. However, the plot of the EMA in the latest iteration of the code doesn’t look correct.
I’ve attached a screen shot of the PRT chart showing:
Pane 1 – Price Candles
Pane 2 – Version 1 of the VBSM converted from Tradingview, without alternate color plots on EMA (weren’t asked for at the time)
Pane 3 – Version 2 showing alternate color plots on EMA, but color coding incorrectly based on the trend/slope of the PVI+NVI line and not the EMA line
Pane 4 – Version 3 (and latest) showing alternate color plots on EMA, correctly based on the slope of the EMA line, but with incorrect EMA plot.
The plot of the EMA in latest version (Pane 4) is different to the previous two plots. The plots in Panes 2 and 3 are correct as I have compared them to the plot of the original indicator in Tradingview.
So grateful for your work to date and wondering if you could have a look at for me please and resolve? That will be all that is required then thank you.
Thank you
Bruce