

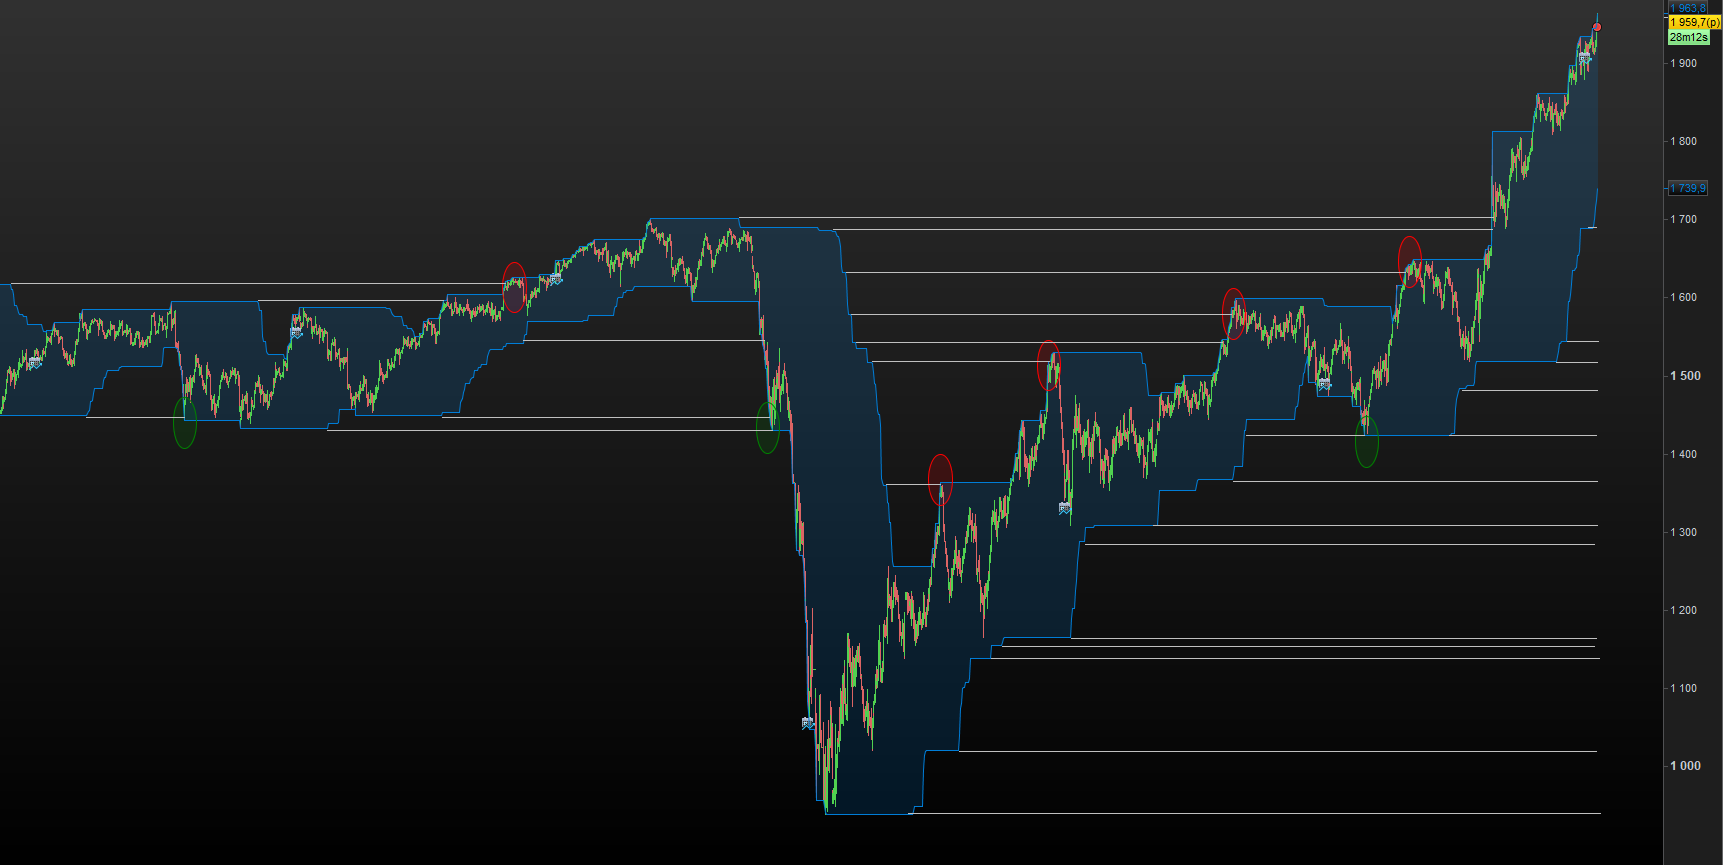
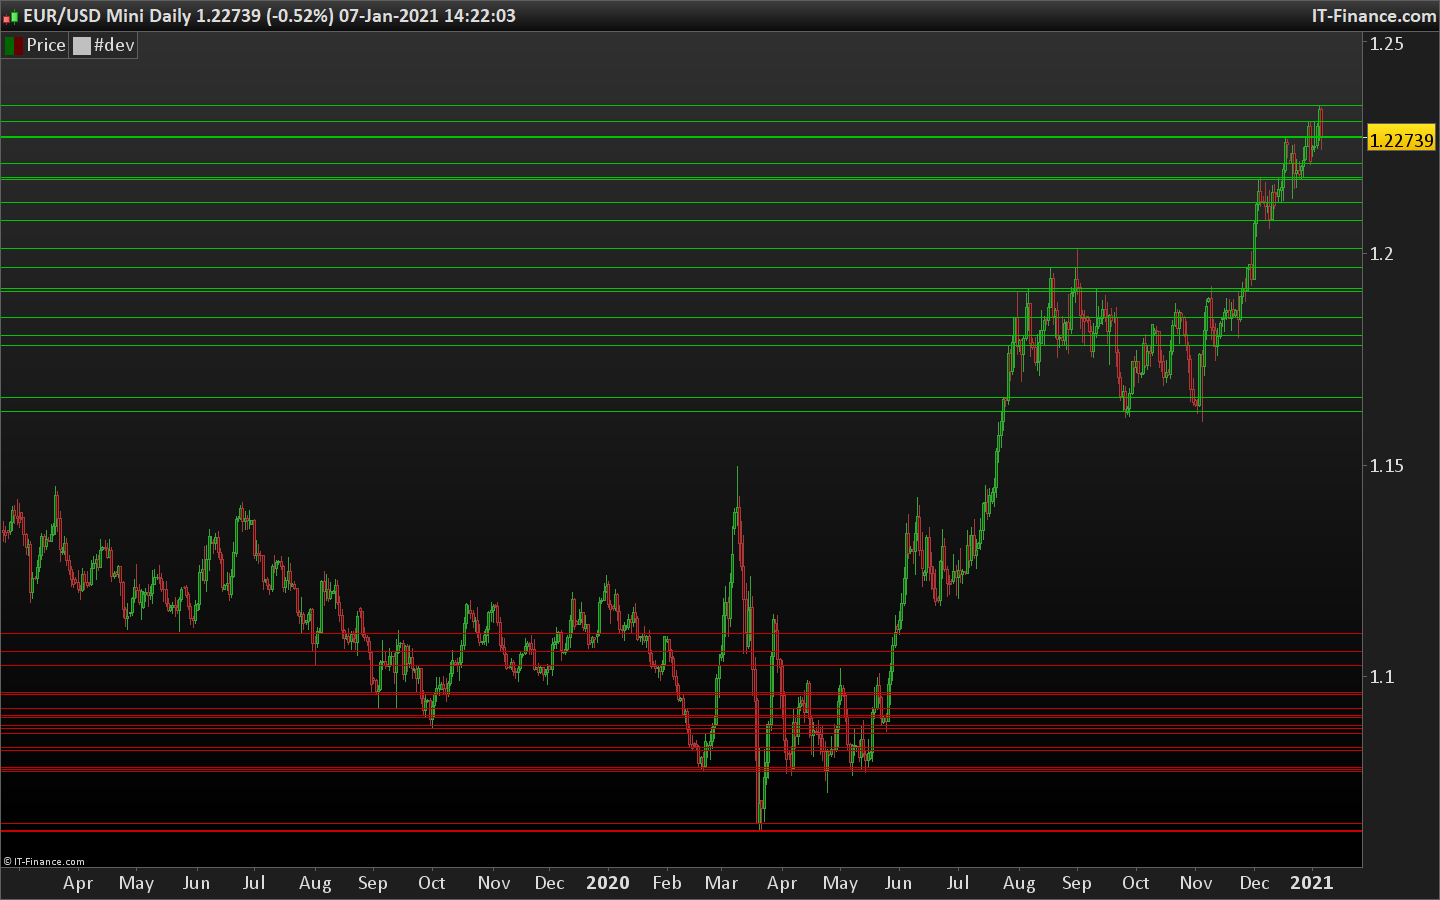
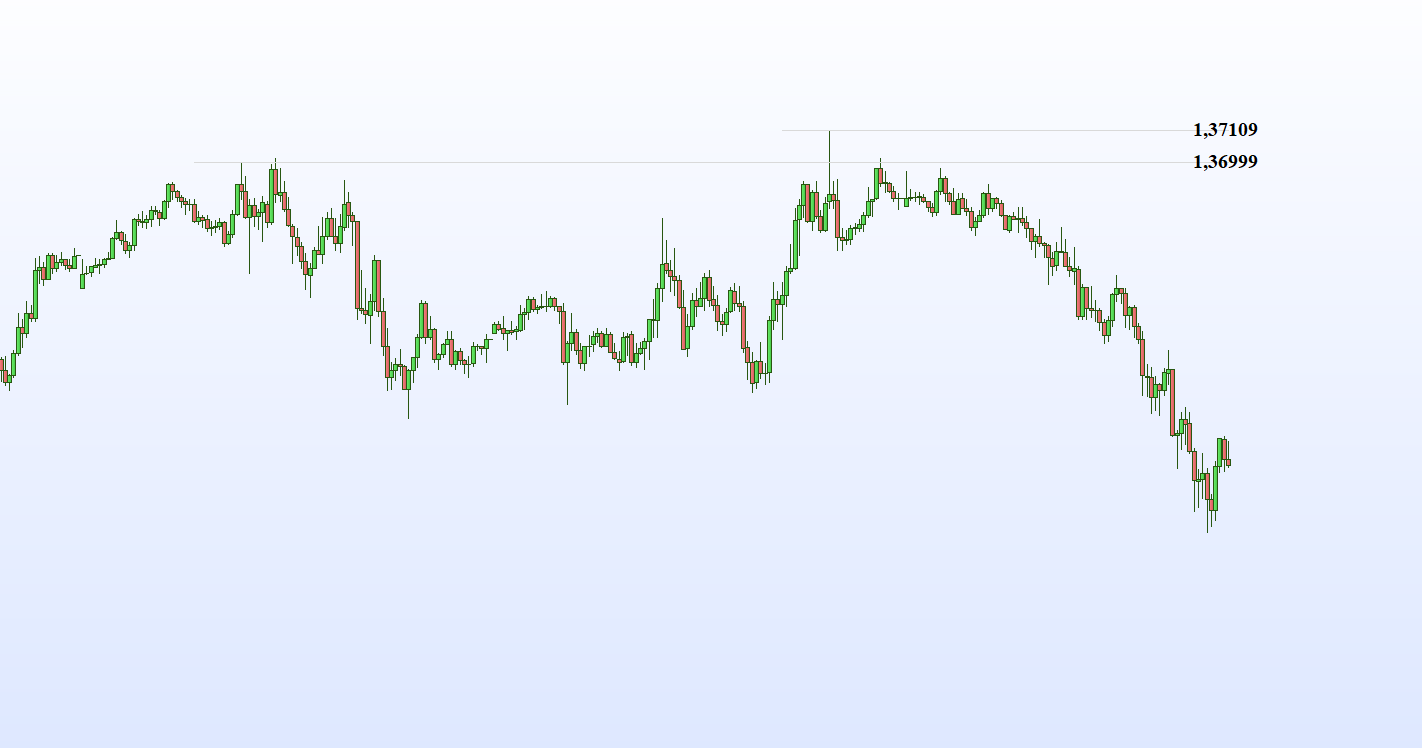
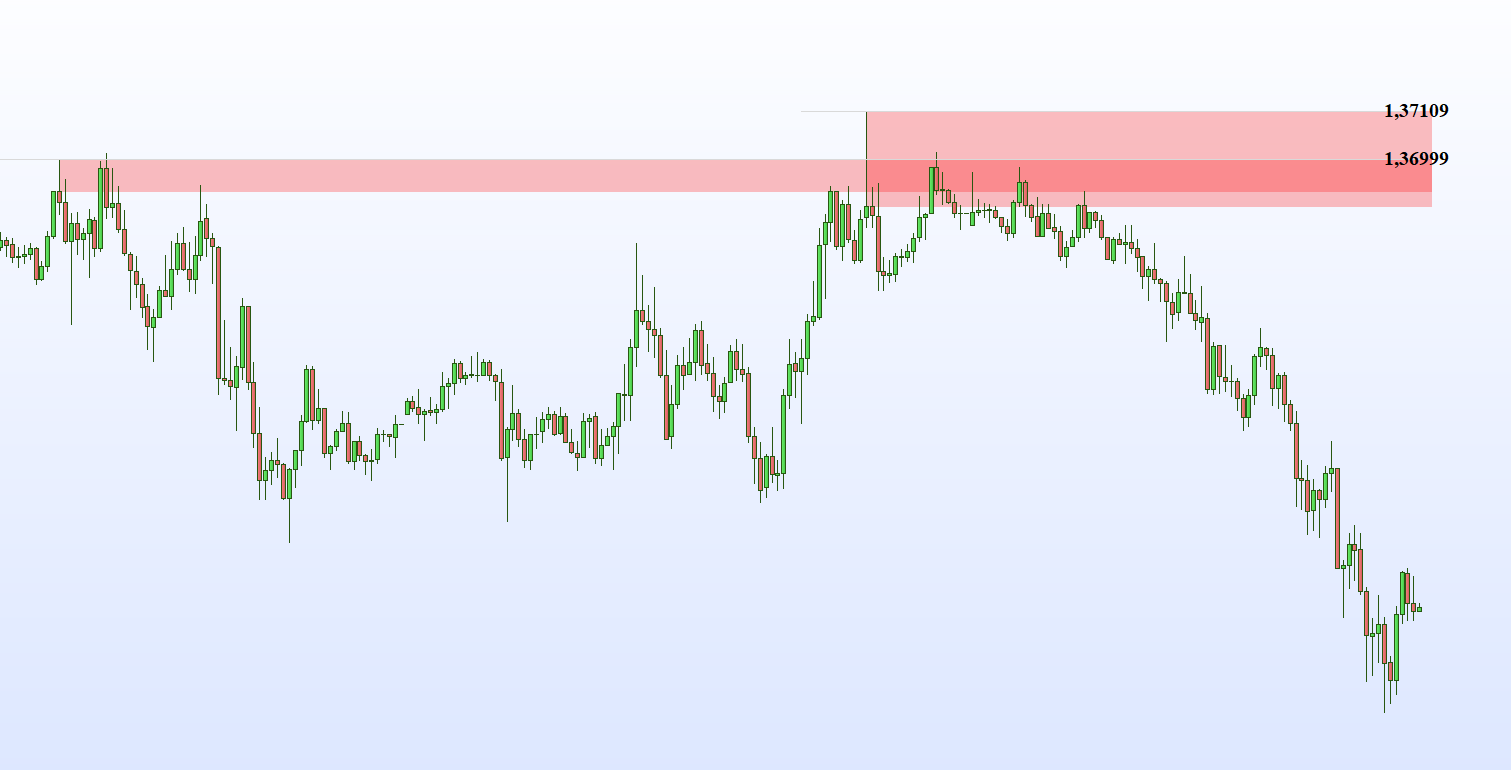
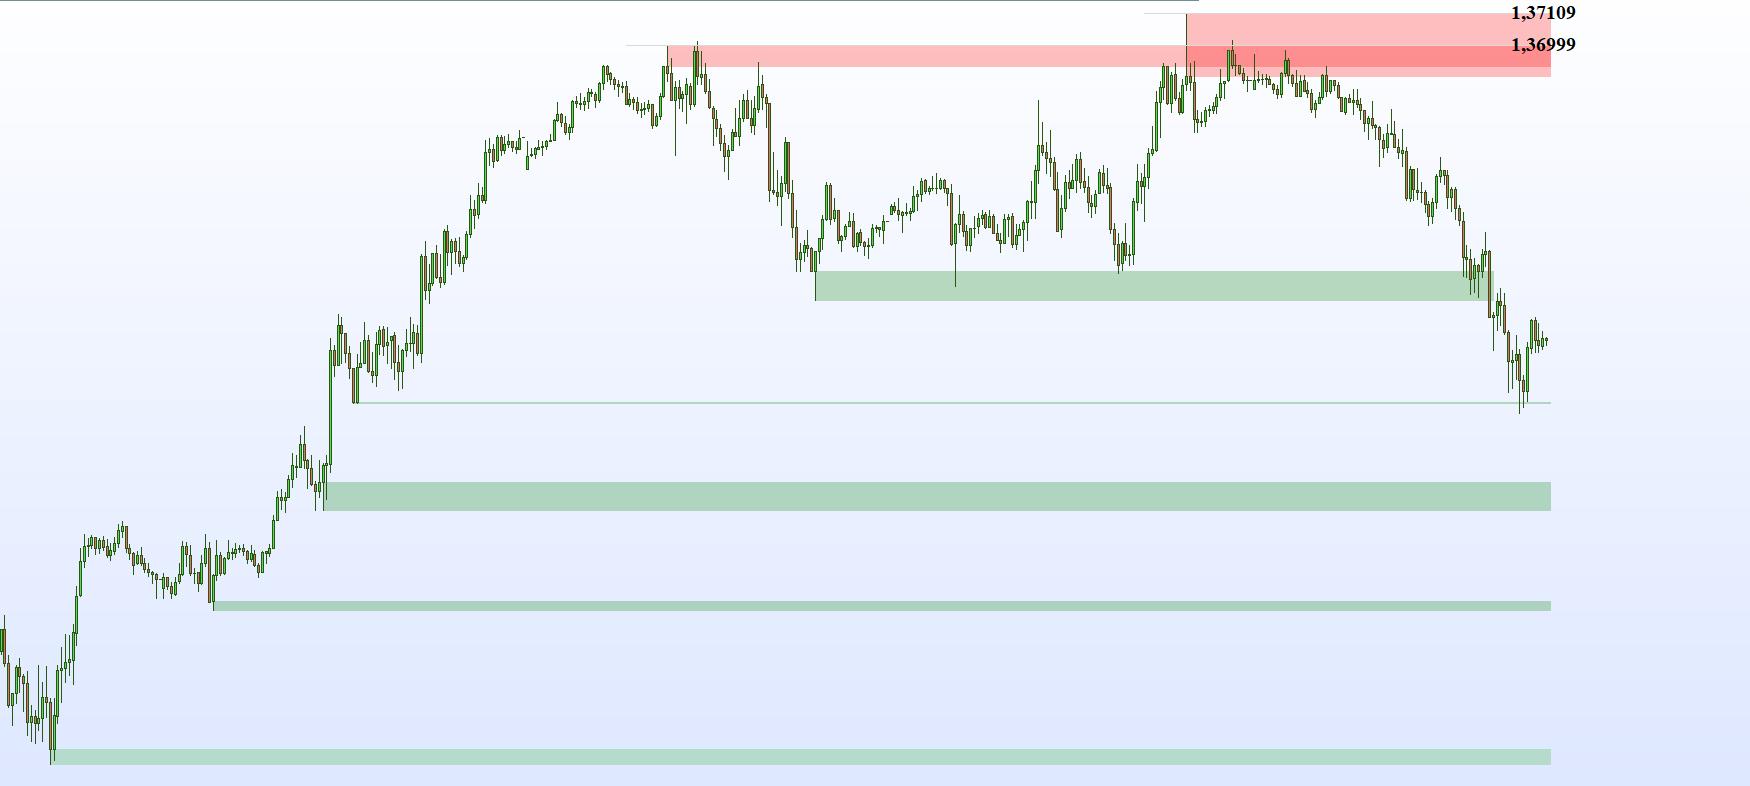
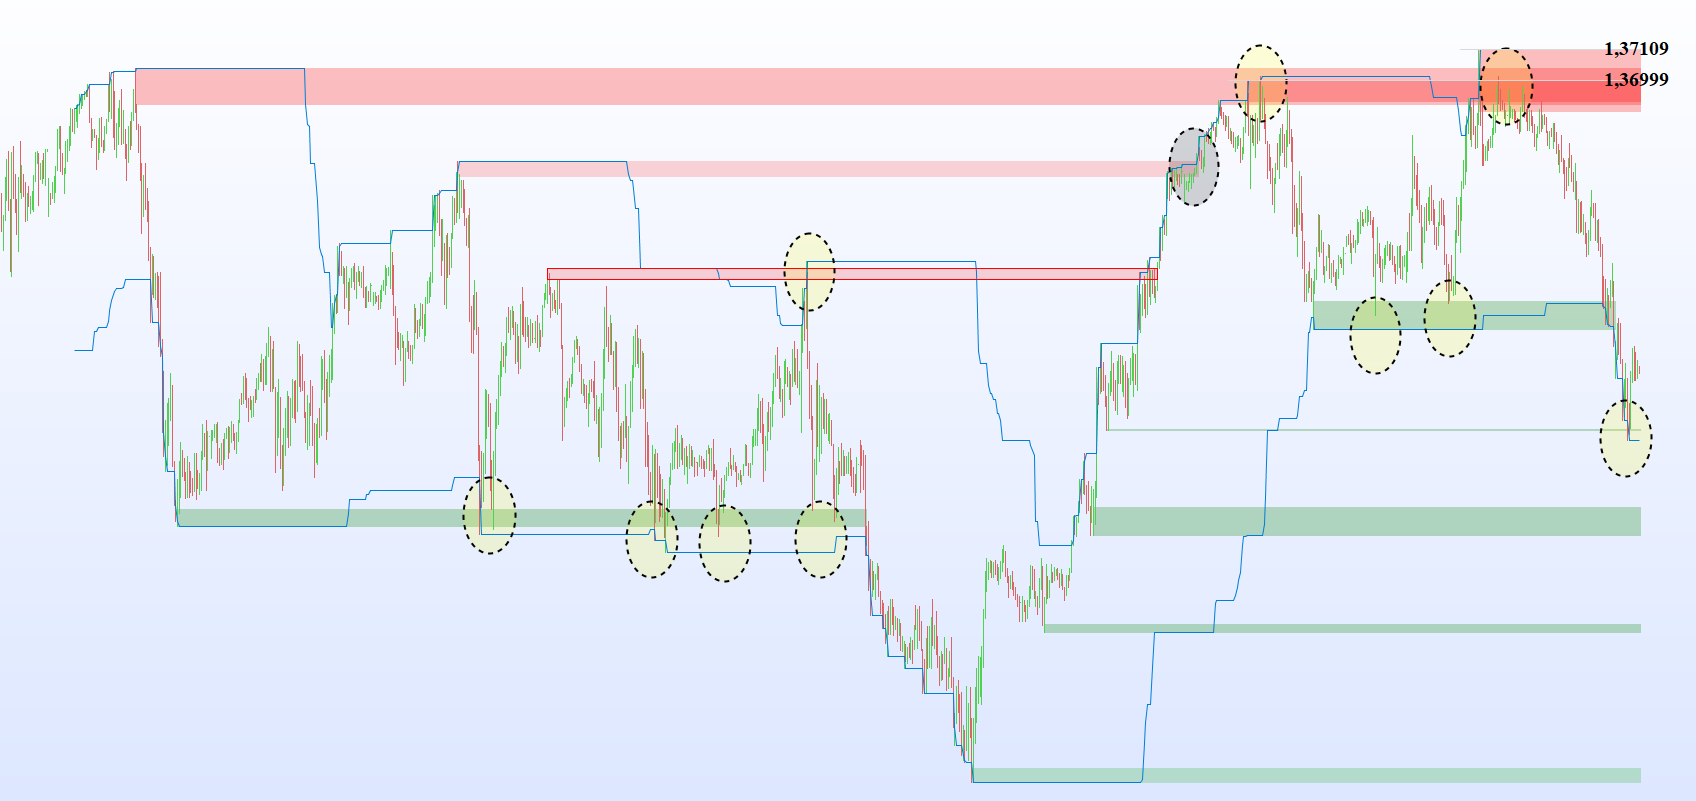
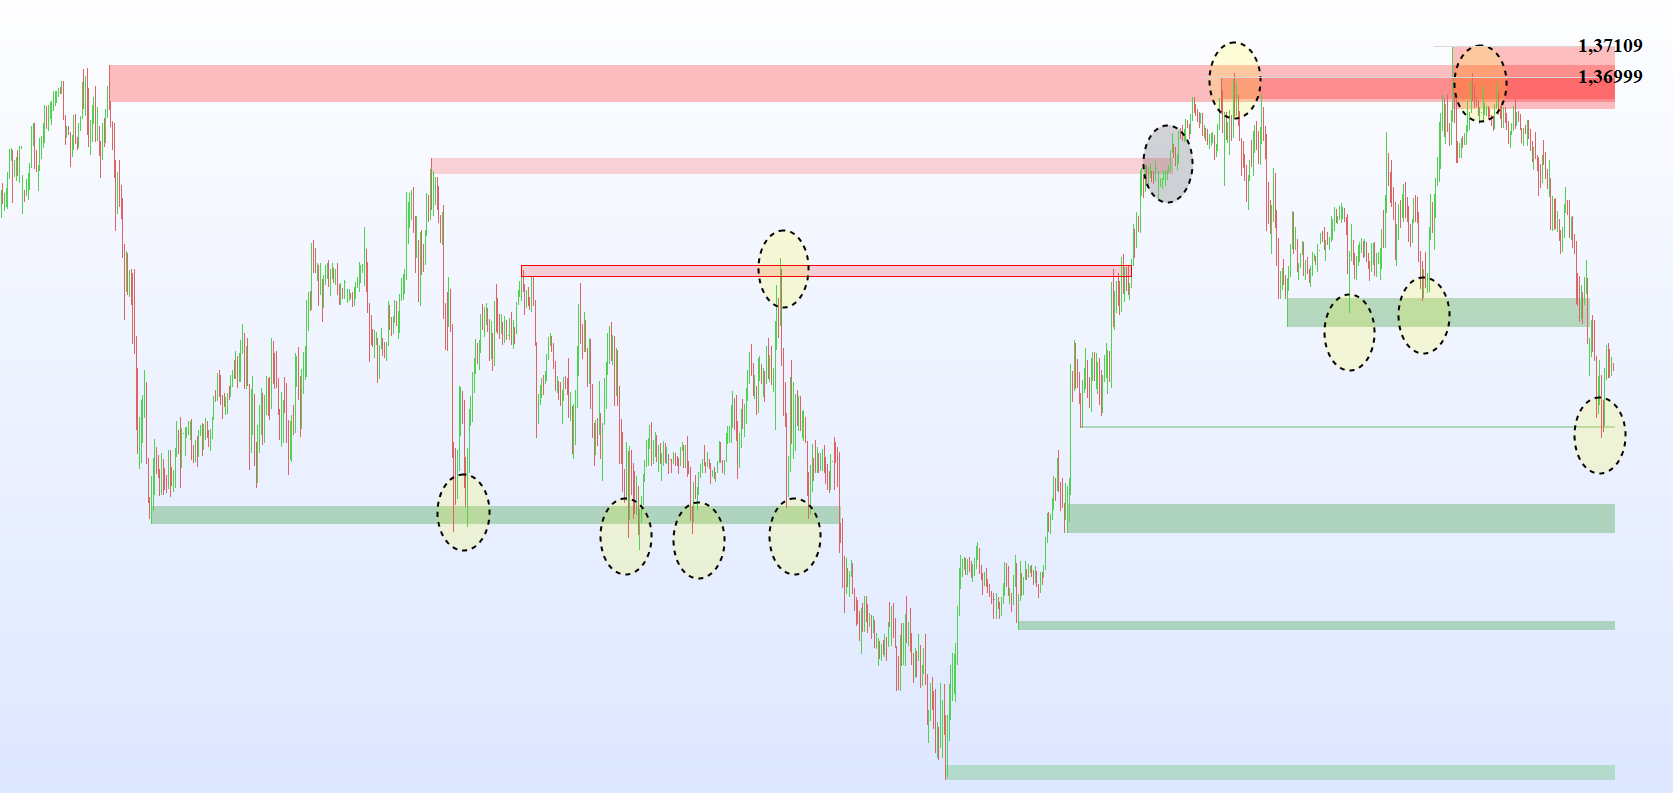
VISUAL LEVELs INDICATOR with Donchian channel

- You must be logged in to reply to this topic.
New Reply

Author
Summary
This topic contains 27 replies,
has 6 voices, and was last updated by ![]()
2 years, 12 months ago.
Topic Details
| Forum: | ProBuilder: Indicators & Custom Tools |
| Language: | English |
| Started: | 12/15/2020 |
| Status: | Active |
| Attachments: | 21 files |
Loading...