Bard
BardParticipant
Master
I thought this might be worth converting and make a good addition to the indicator library if someone would like to covert the code? It’s John Ehler’s Correlation Trend Indicator from the Stocks & Commodities 05/2020 edition.
“The basic idea of the Correlation Trend Indicator (CTI) is quite simple. The ideal trend curve is a straight upwards line. So the CTI just measures the correlation of the price curve with this ideal trend line. Ehlers provided TradeStation code. This is the indicator:
var CTI (vars Data, int Length)
    {
      int count;
      var Sx = 0, Sy = 0, Sxx = 0, Sxy = 0, Syy = 0;

for(count = 0; count < Length; count++) {
        var X = Data[count]; // the price curve
        var Y = -count; // the trend line
        Sx = Sx + X; Sy = Sy + Y;
        Sxx = Sxx + X*X; Sxy = Sxy + X*Y; Syy = Syy + Y*Y;
      }
      if(Length*Sxx-Sx*Sx > 0 && Length*Syy-Sy*Sy > 0)
        return (Length*Sxy-Sx*Sy)/sqrt((Length*Sxx-Sx*Sx)*(Length*Syy-Sy*Sy));
      else return 0;
}
X represents the price curve, Y the trend line, and correlation is measured with the Spearman algorithm. The trend line is supposed to linearly rise with count, but I’m using the negative count here because the Data series is stored backwards, with the most recent values at the beginning.
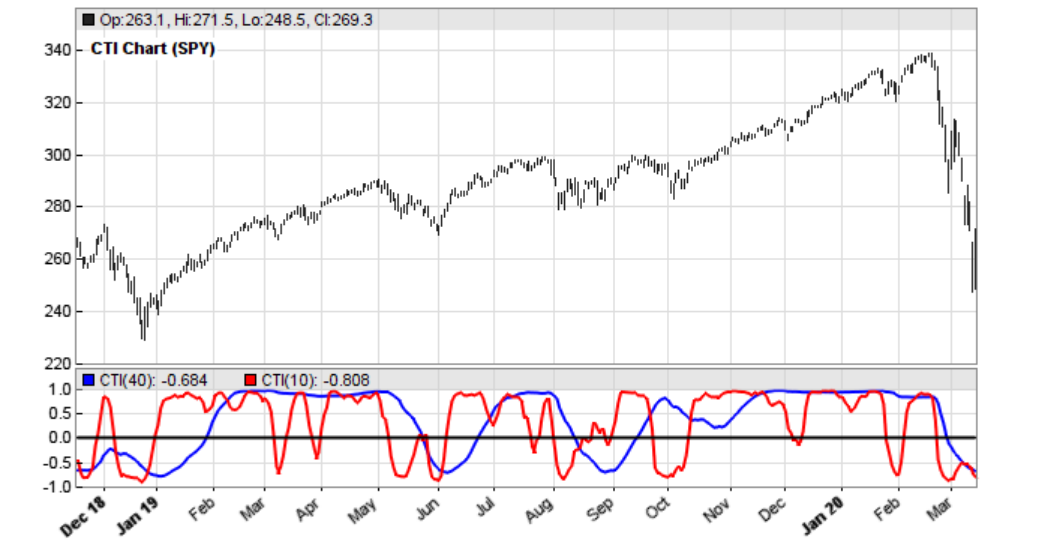
This is how the Correlation Trend Indicator (CTI) looks when applied to SPY (red = 10 days period, blue = 40 days): Pls see image.
We can see that the lines reproduce rather well the price curve trend. And we can also see that the blue line, the 40-days trend, is not just a smoothed version of the red 10-days trend – it looks entirely different. This is an interesting feature of a trend indicator – it separates long-term and short-term trend perfectly.”
The article goes on to say that it might be difficult profitably trading on CTI zero crossovers but I would regard, judging form the indicator screenshot, that the -0.8 and +0.8 crossings are more useful for determining future price direction.
https://financial-hacker.com/petra-on-programming-a-unique-trend-indicator/#more-3424
BardParticipant
Master
At first I was so close
@Nicolas!
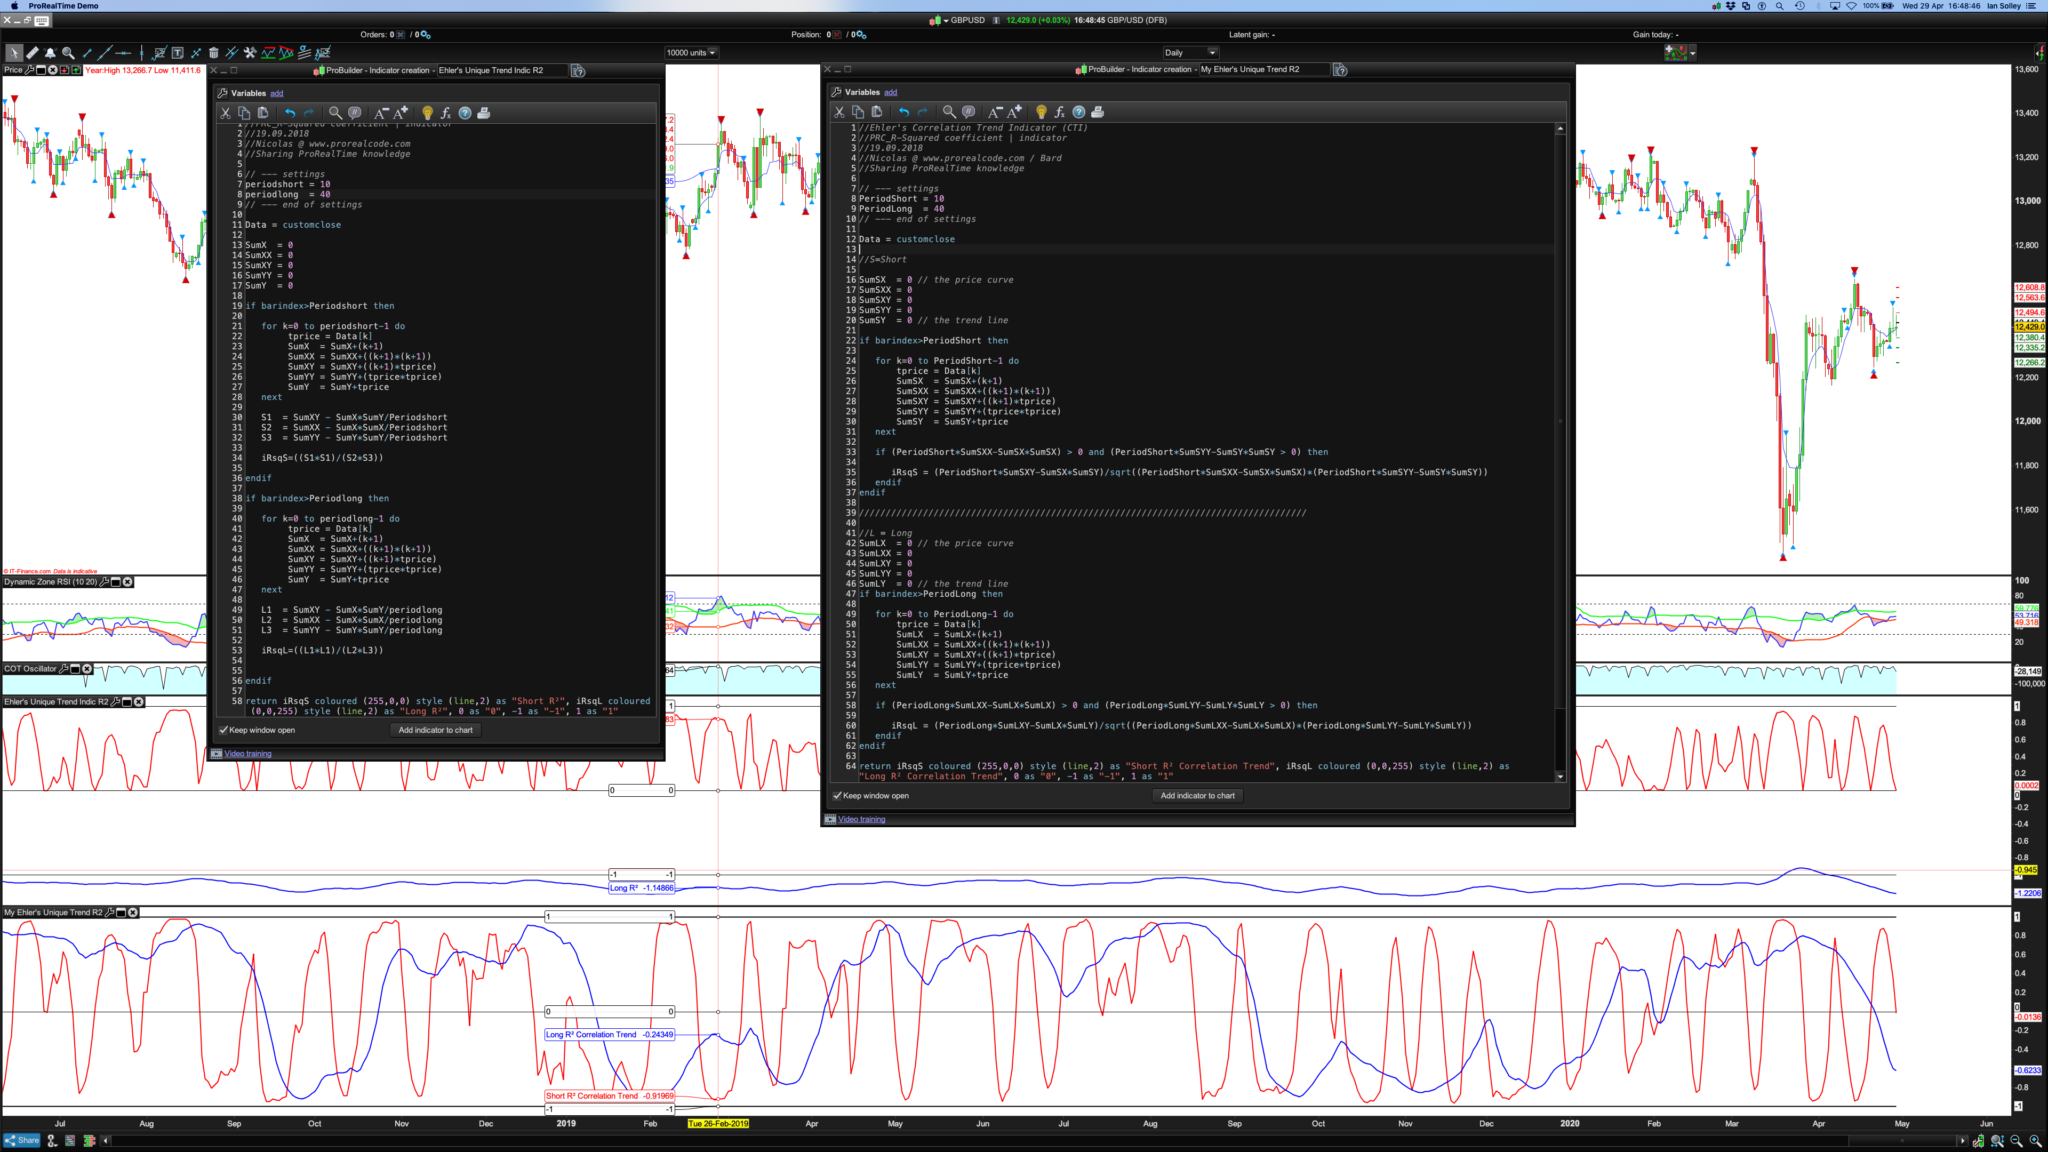
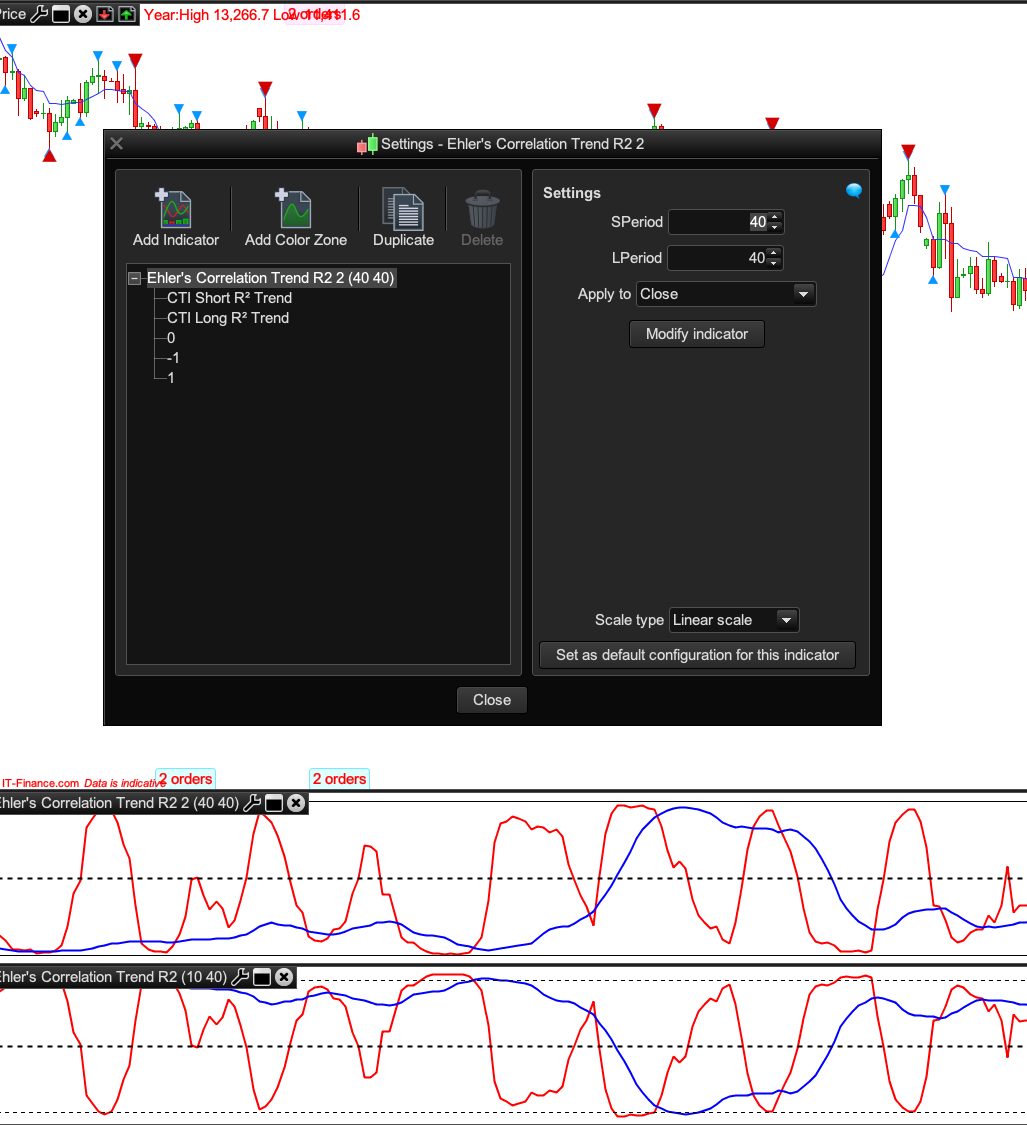
I tried first with my left hand indicator (pls see image) but couldn’t get it to scale -1 to 1 in the top indicator.
So I built another (right hand side indicator and bottom chart using Ehler’s version of R2) and eventually got my Long R2 to stop flatlining along the zero axis by having to make a distinction between the two groups of SumsX’s, SumXY’s etc. I relabelled all the SumX’s, SumXX’s etc by changing them to SumLX (L for Long) and SumY to SumSY etc. Phew.
So… is Ehler’s R2 mathematics equations doing the exact same thing as PRC’s R2?
If it’s correct, maybe it’s one for the library?
Cheers,
//Ehler's Correlation Trend Indicator (CTI)
//PRC_R-Squared coefficient | indicator
//19.09.2018
//Nicolas @ www.prorealcode.com / Bard
//Sharing ProRealTime knowledge

// --- settings
//SPeriod = 10 //Add in Variables
//LPeriod  = 40 //Add in Variables
// --- end of settings

Data = customclose

////////////////////////////////////////////////////////////////////////////////////

//S=Short
SumSX  = 0 // the price curve
SumSXX = 0
SumSXY = 0
SumSYY = 0
SumSY  = 0 // the trend line

if barindex>SPeriod then

for k=0 to SPeriod-1 do
 tprice = Data[k]
 SumSX  = SumSX+(k+1)
 SumSXX = SumSXX+((k+1)*(k+1))
 SumSXY = SumSXY+((k+1)*tprice)
 SumSYY = SumSYY+(tprice*tprice)
 SumSY  = SumSY+tprice
next

if (SPeriod*SumSXX-SumSX*SumSX) > 0 and (SPeriod*SumSYY-SumSY*SumSY > 0) then

iRsqS = (SPeriod*SumSXY-SumSX*SumSY)/sqrt((SPeriod*SumSXX-SumSX*SumSX)*(SPeriod*SumSYY-SumSY*SumSY))
endif
endif

////////////////////////////////////////////////////////////////////////////////////

//L = Long
SumLX  = 0 // the price curve
SumLXX = 0
SumLXY = 0
SumLYY = 0
SumLY  = 0 // the trend line
if barindex>LPeriod then

for k=0 to LPeriod-1 do
 tprice = Data[k]
 SumLX  = SumLX+(k+1)
 SumLXX = SumLXX+((k+1)*(k+1))
 SumLXY = SumLXY+((k+1)*tprice)
 SumLYY = SumLYY+(tprice*tprice)
 SumLY  = SumLY+tprice
next

if (LPeriod*SumLXX-SumLX*SumLX) > 0 and (LPeriod*SumLYY-SumLY*SumLY > 0) then

iRsqL = (LPeriod*SumLXY-SumLX*SumLY)/sqrt((LPeriod*SumLXX-SumLX*SumLX)*(LPeriod*SumLYY-SumLY*SumLY))
endif
endif

return iRsqS coloured (255,0,0) style (line,2) as "Short R² Correlation Trend", iRsqL coloured (0,0,255) style (line,2) as "Long R² Correlation Trend", 0 style (dottedline,2)as "0"
BardParticipant
Master
I don’t think the SPeriod and LPeriod Variables are making any difference to the indicators red and blue R2 lines when they’re increased or decreased?
Ps// Please crop off the blue top bar in the (last, 4th) final photo if it’s used for the library and please delete this comment. Thanks
@Nicolas.
Bard – If you think that you have created an indicator worthy of going in the library then you need to click on the ‘+’ on the top bar and submit it yourself. Add images, ITF file a description and include the code in the post. This saves Nicolas a lot of work – and he is a very busy person! Please check how other library posts are formatted and this will give you an idea of what is required.
BardParticipant
Master
Thanks Vonasi, I hoped someone would give the indicator a look before adding to make sure the code is correct (it looks correct from the chart but I am not a coder)?
Here I’ve patched together the PRC R2 indicator with some of the code from John Ehler’s Correlation Trend indicator. Both codes are available, Ehler’s at the very top of this thread and PRC R2 via a url link. Does mine look correct and can you fix the period variable not having any impact on the red or blue line (you can only change the period via the code in the indicator)? Cheers.
Does mine look correct?
You’ll have to wait for Nicolas the TradeStation to PRT guru to confirm that you have replicated the code correctly and then submit it to the library.
Thanks for the work done Bard. Without diggin too much into your code, I think that there might be some differences, but I can’t spot them.
Here is the 1:1 conversion from the Tradestation code you shared:
length=20

Sx = 0
Sy = 0
Sxx = 0
Sxy = 0
Syy = 0

data=customclose

for count = 0 to Length-1 do
X = Data[count] // the price curve
Y = -count // the trend line
Sx = Sx + X
Sy = Sy + Y
Sxx = Sxx + X*X
Sxy = Sxy + X*Y
Syy = Syy + Y*Y
next
if(Length*Sxx-Sx*Sx > 0 and Length*Syy-Sy*Sy > 0) then
cti= (Length*Sxy-Sx*Sy)/sqrt((Length*Sxx-Sx*Sx)*(Length*Syy-Sy*Sy))
endif

return cti
BardParticipant
Master
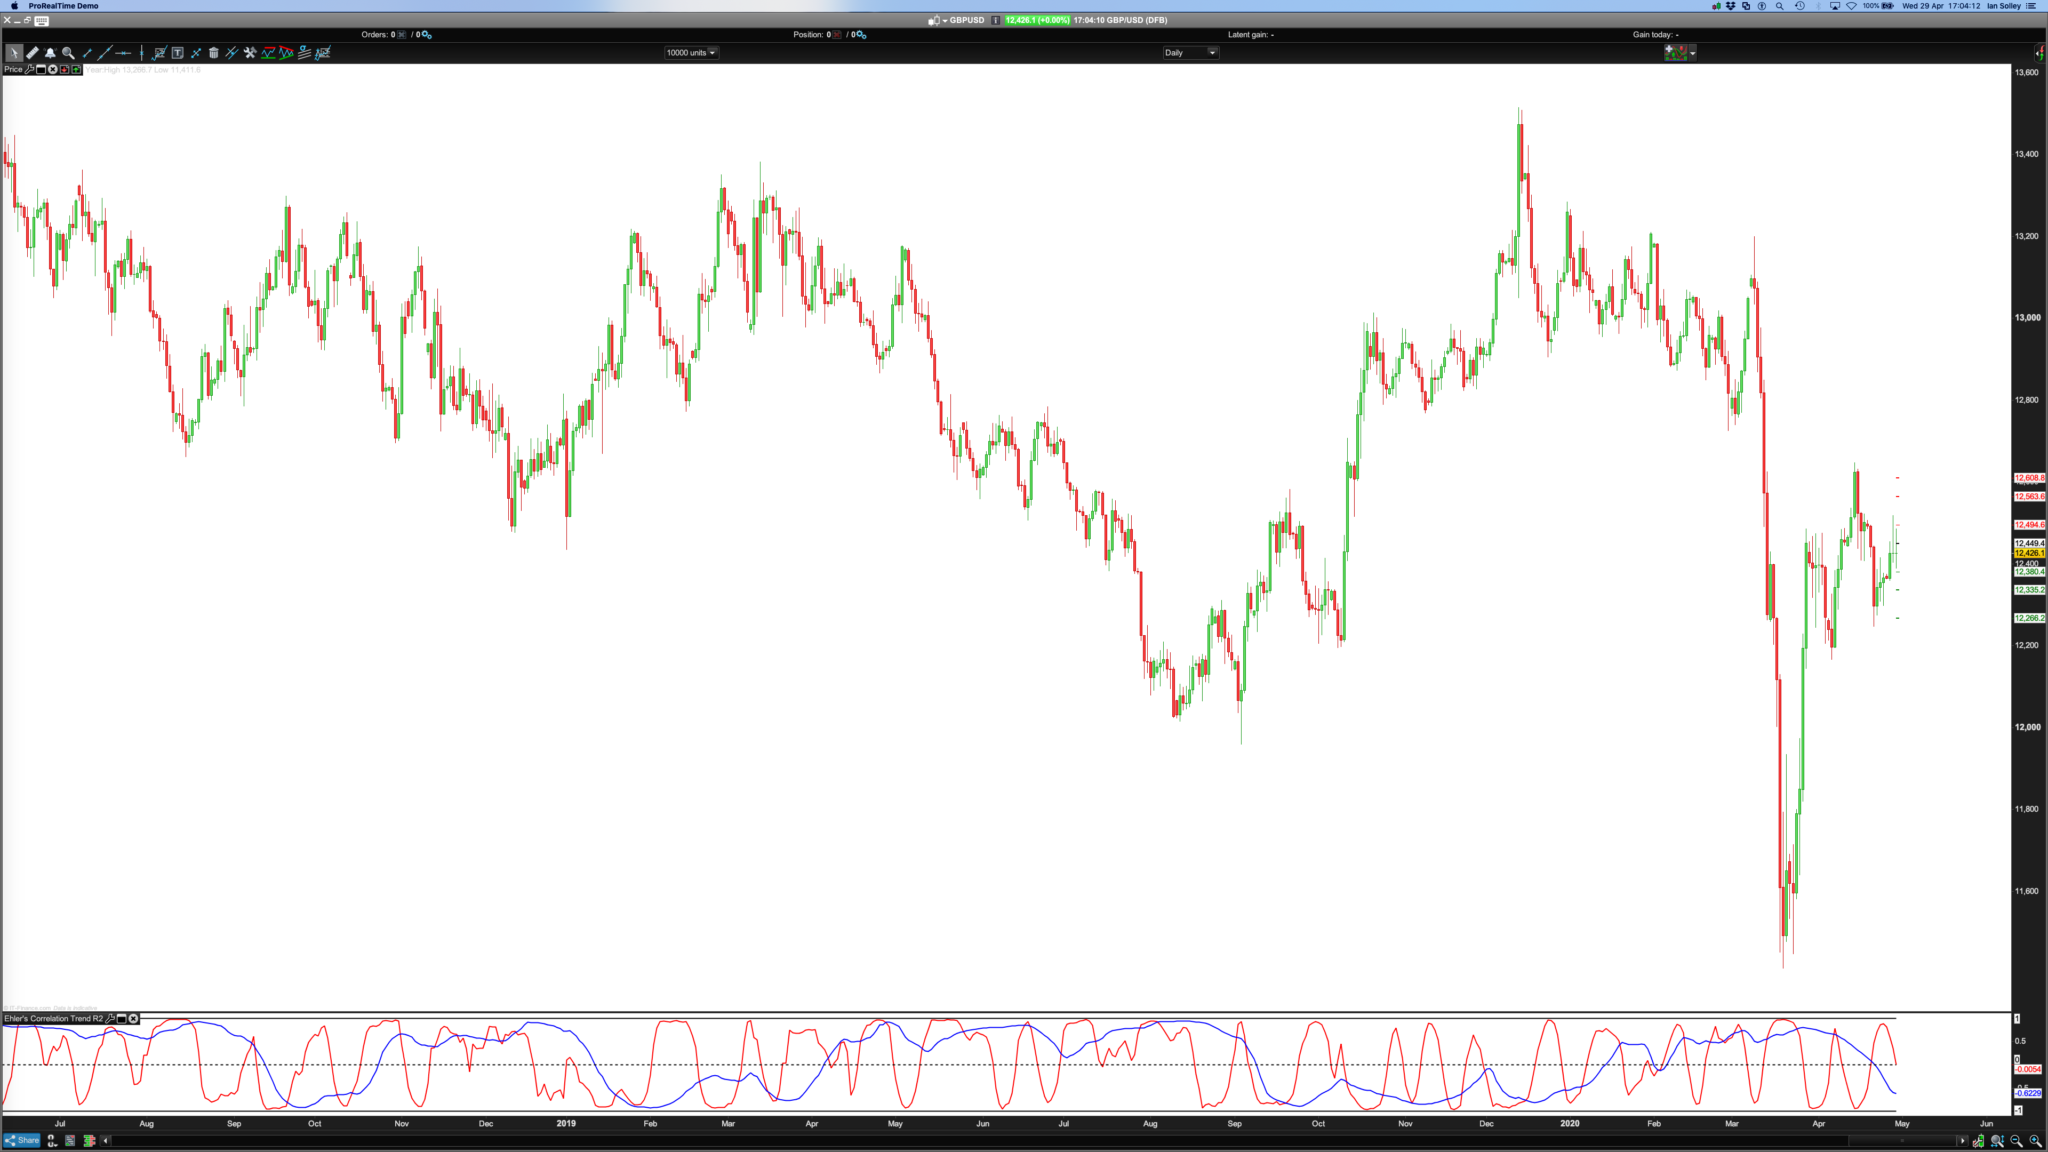
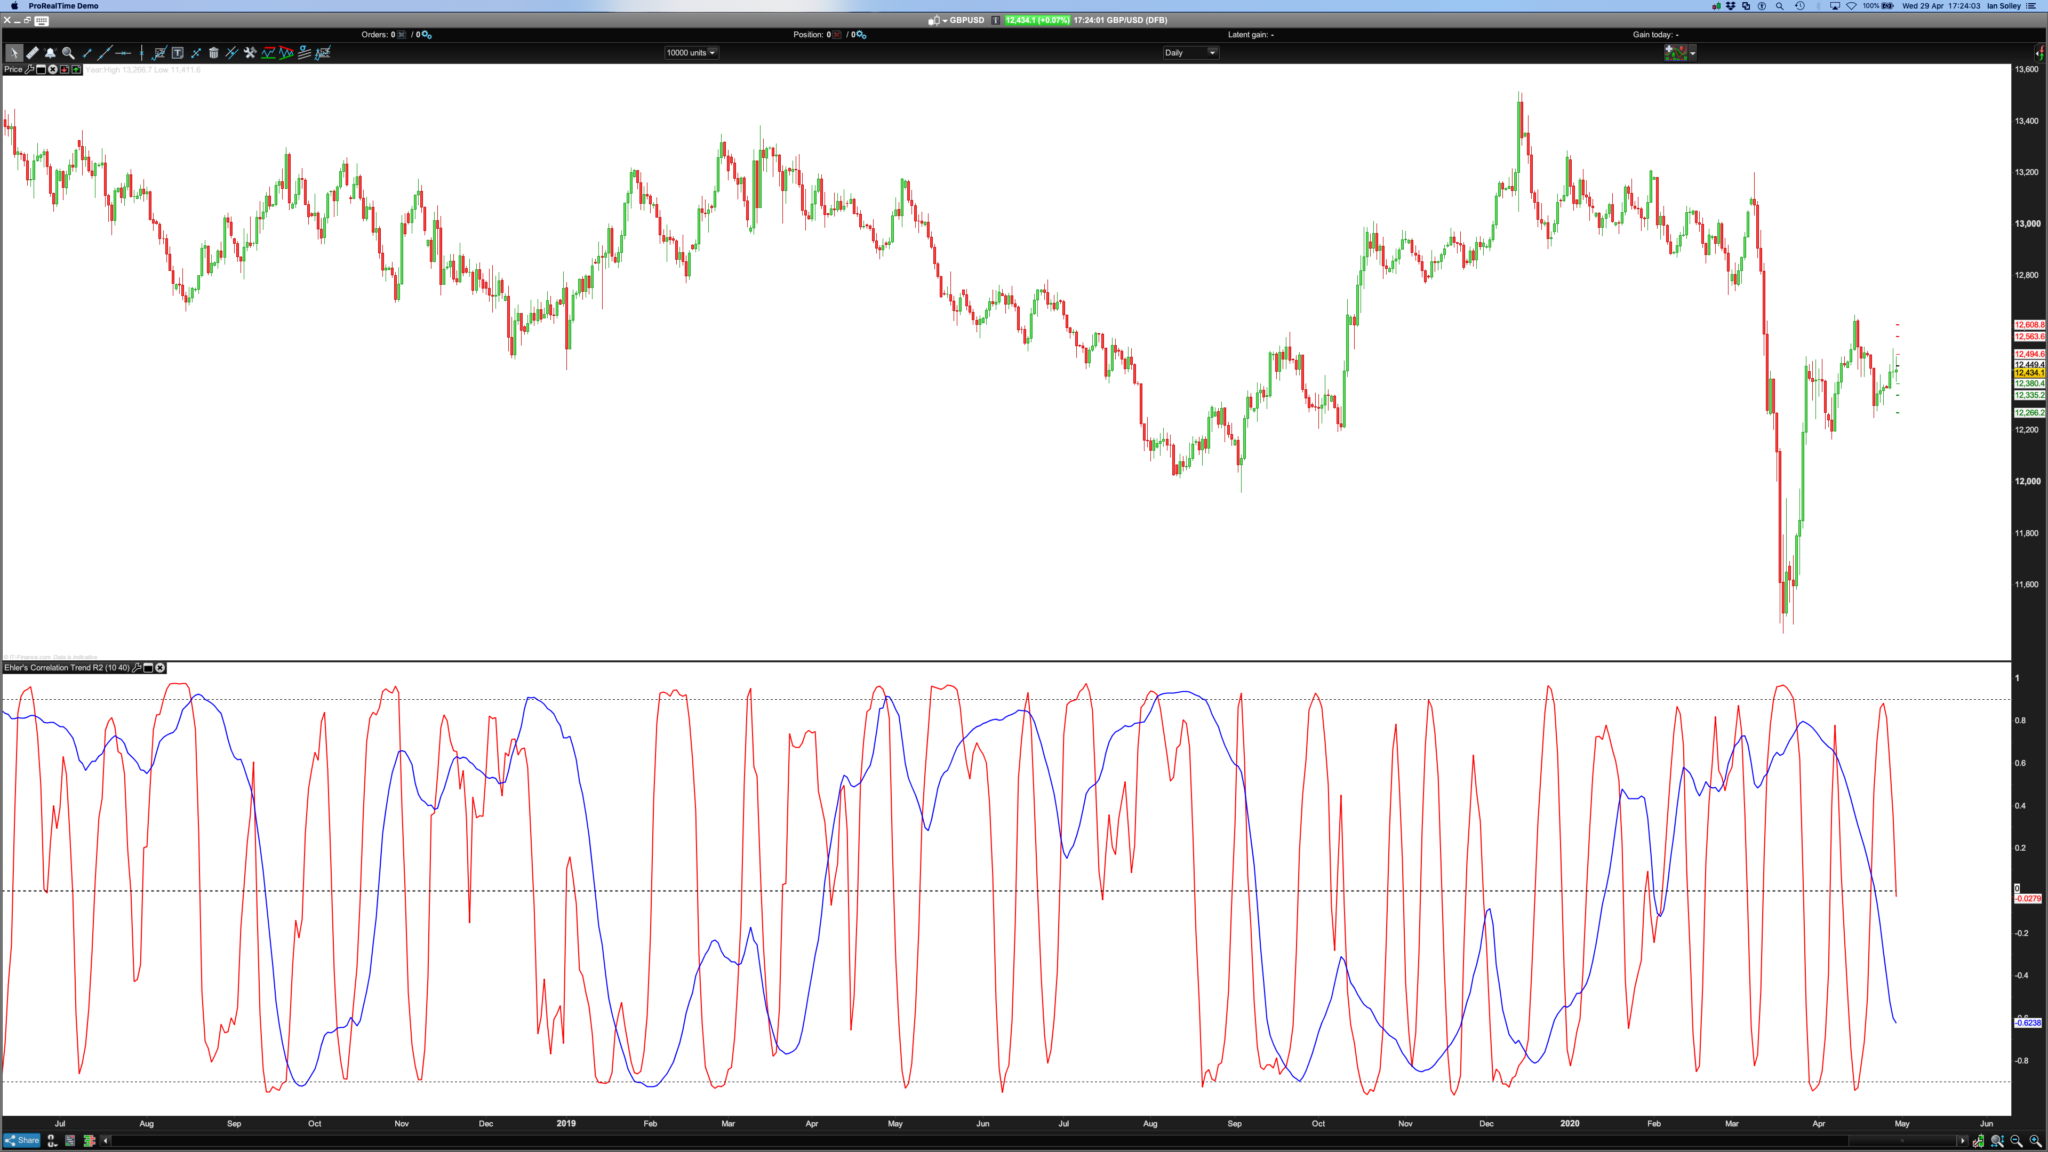
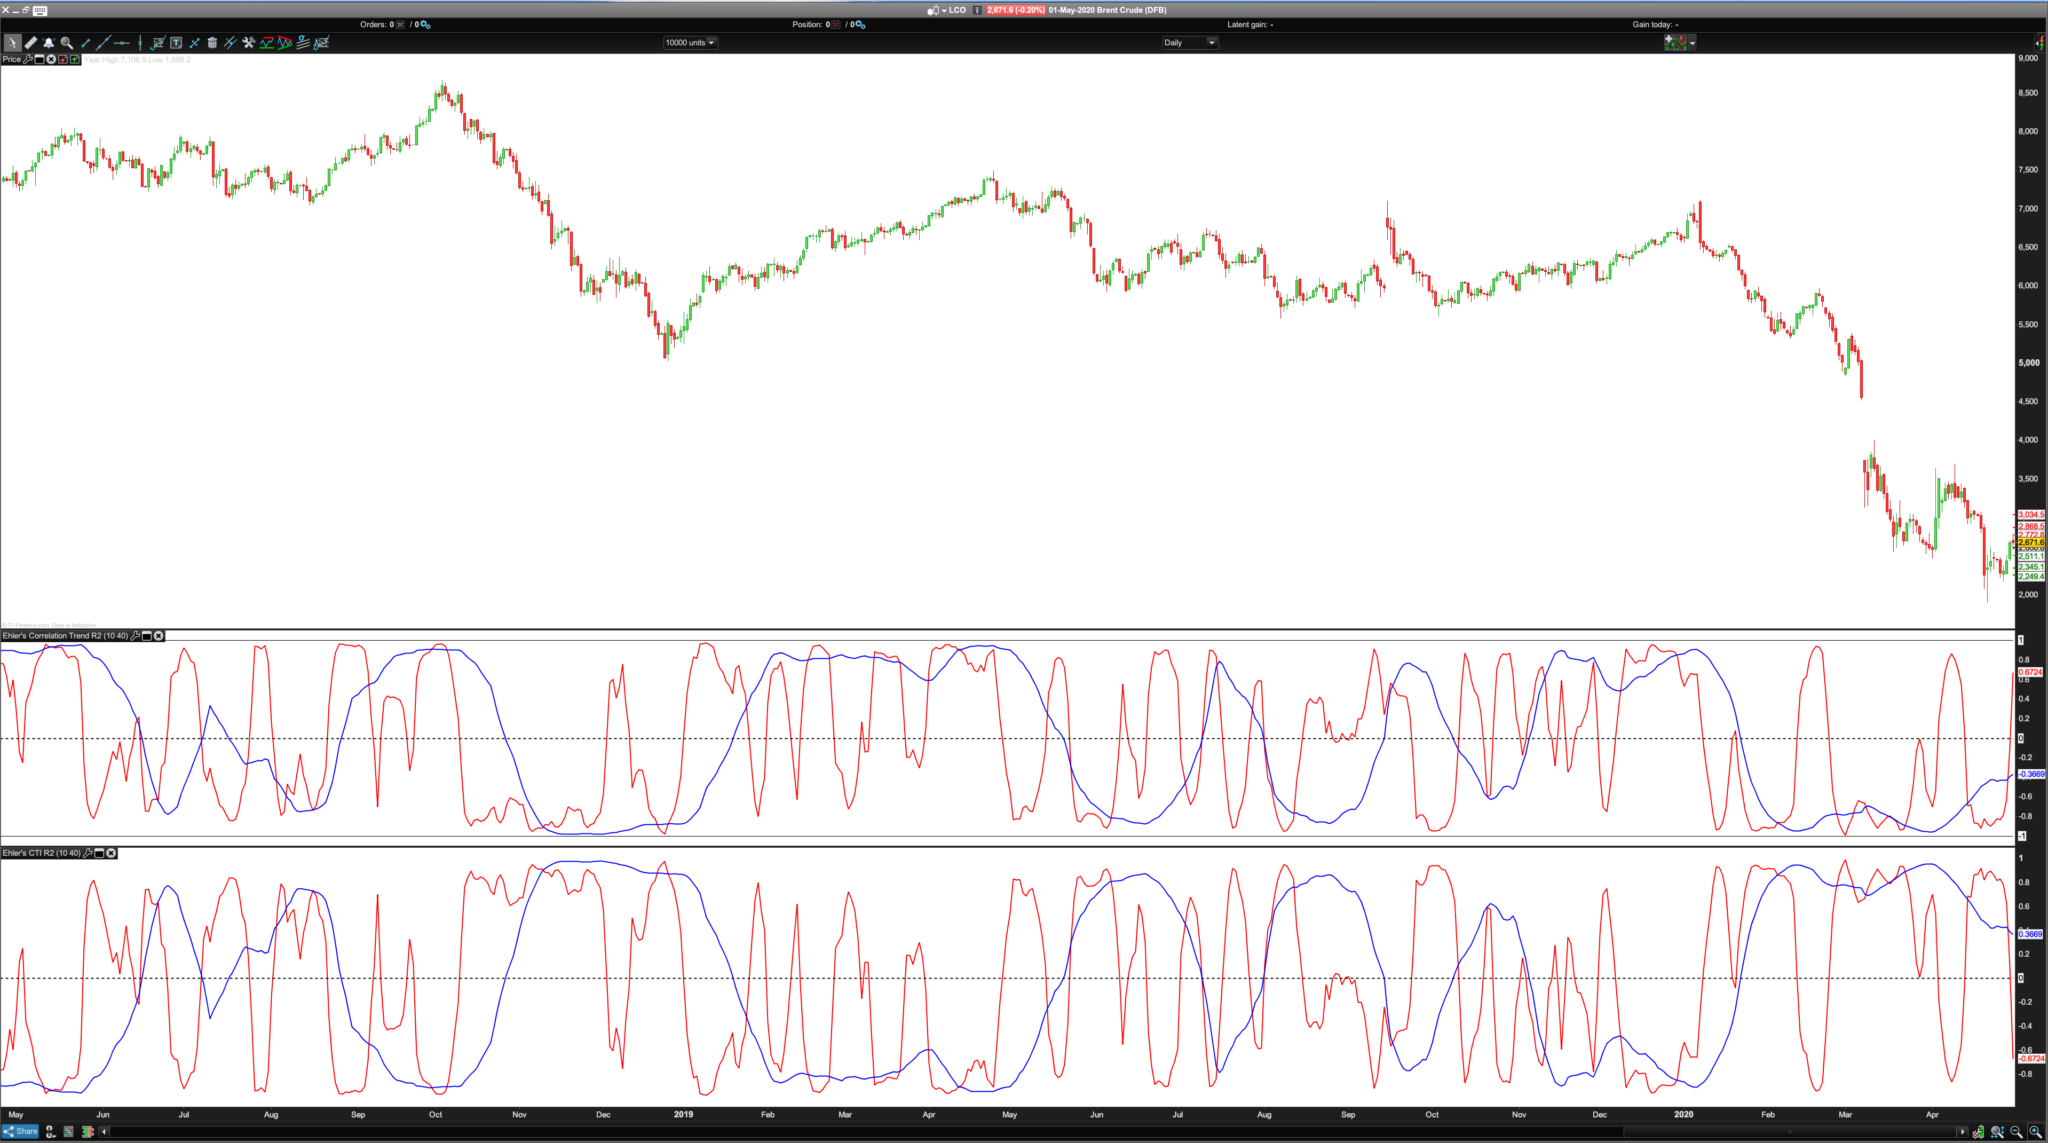
That’s great Nicolas, not sure it’s the right way up!? I thought maybe mine (short name, bottom indicator) was the inverse when on the £/$, when the R2 reading was high there was no trend but now on Brent Crude I think mine looks right (bottom) and yours is inverse. What do you think? Pls see second screenshot and ignore first screenshot.
What change to the equation would flip them to the “correct” way as in your code, because I thought I altered the PRC R2 code accurately?
I’ve added a long = 40 and short period =10 in variables for easy control.
Nearly there! Cheers,
BardParticipant
Master
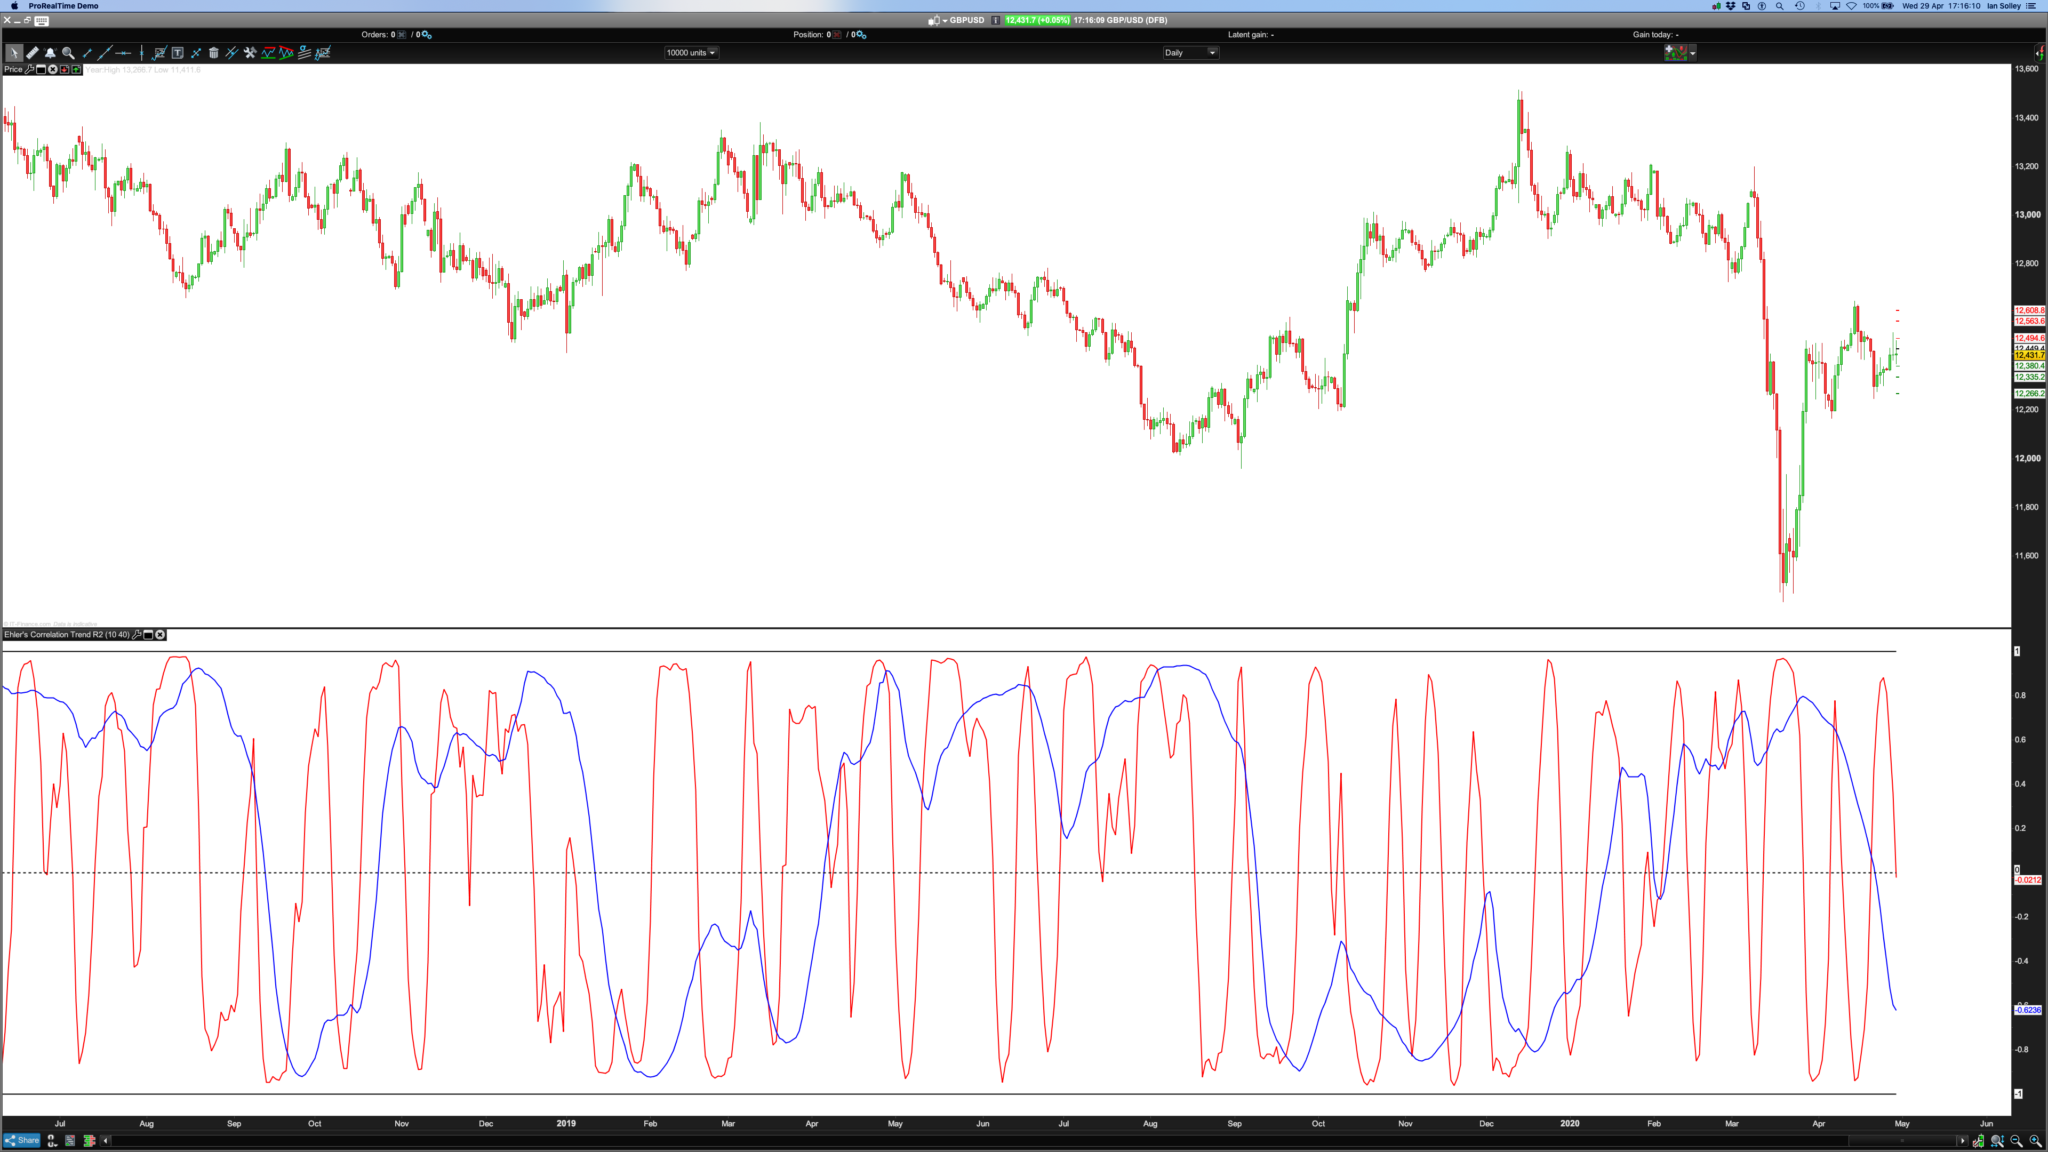
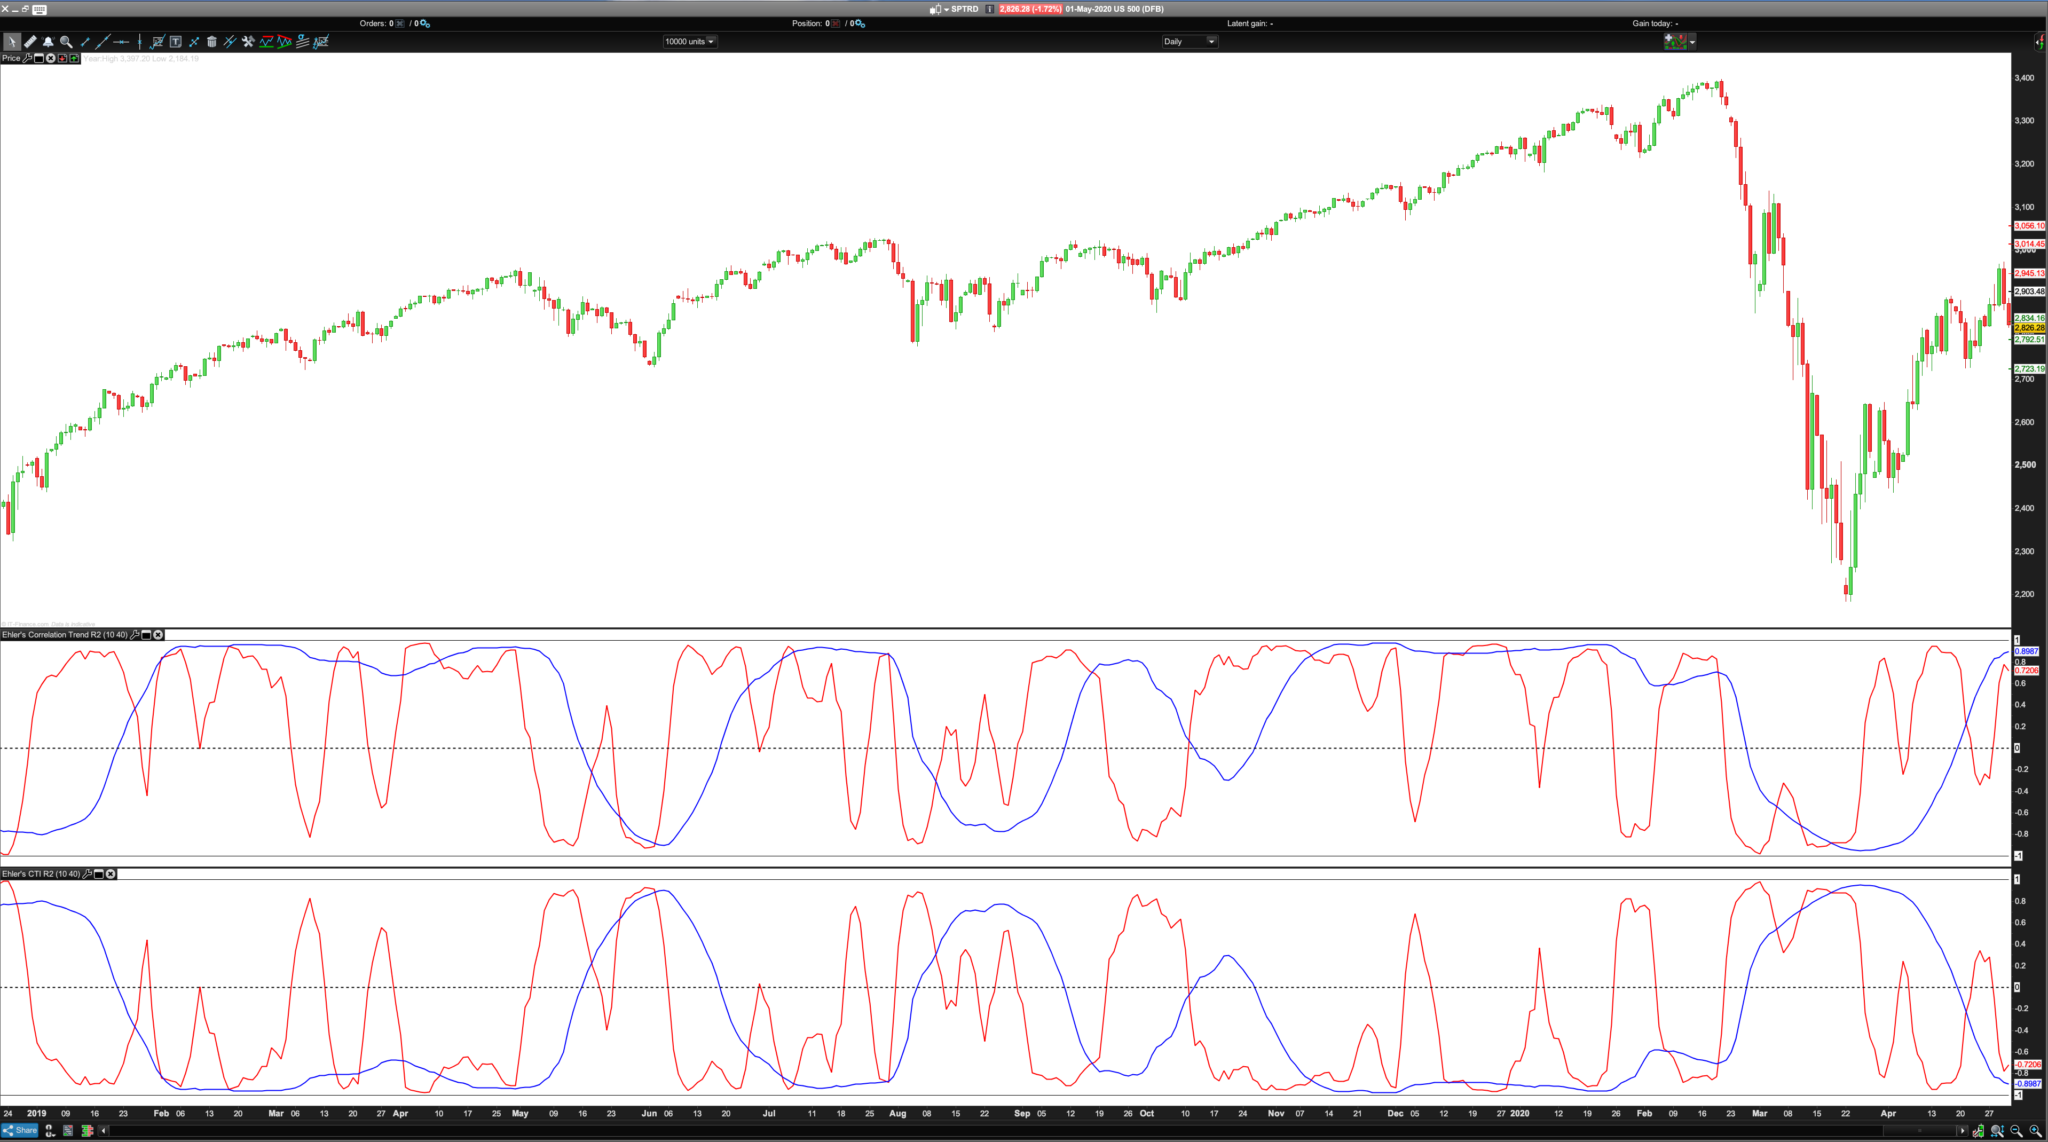
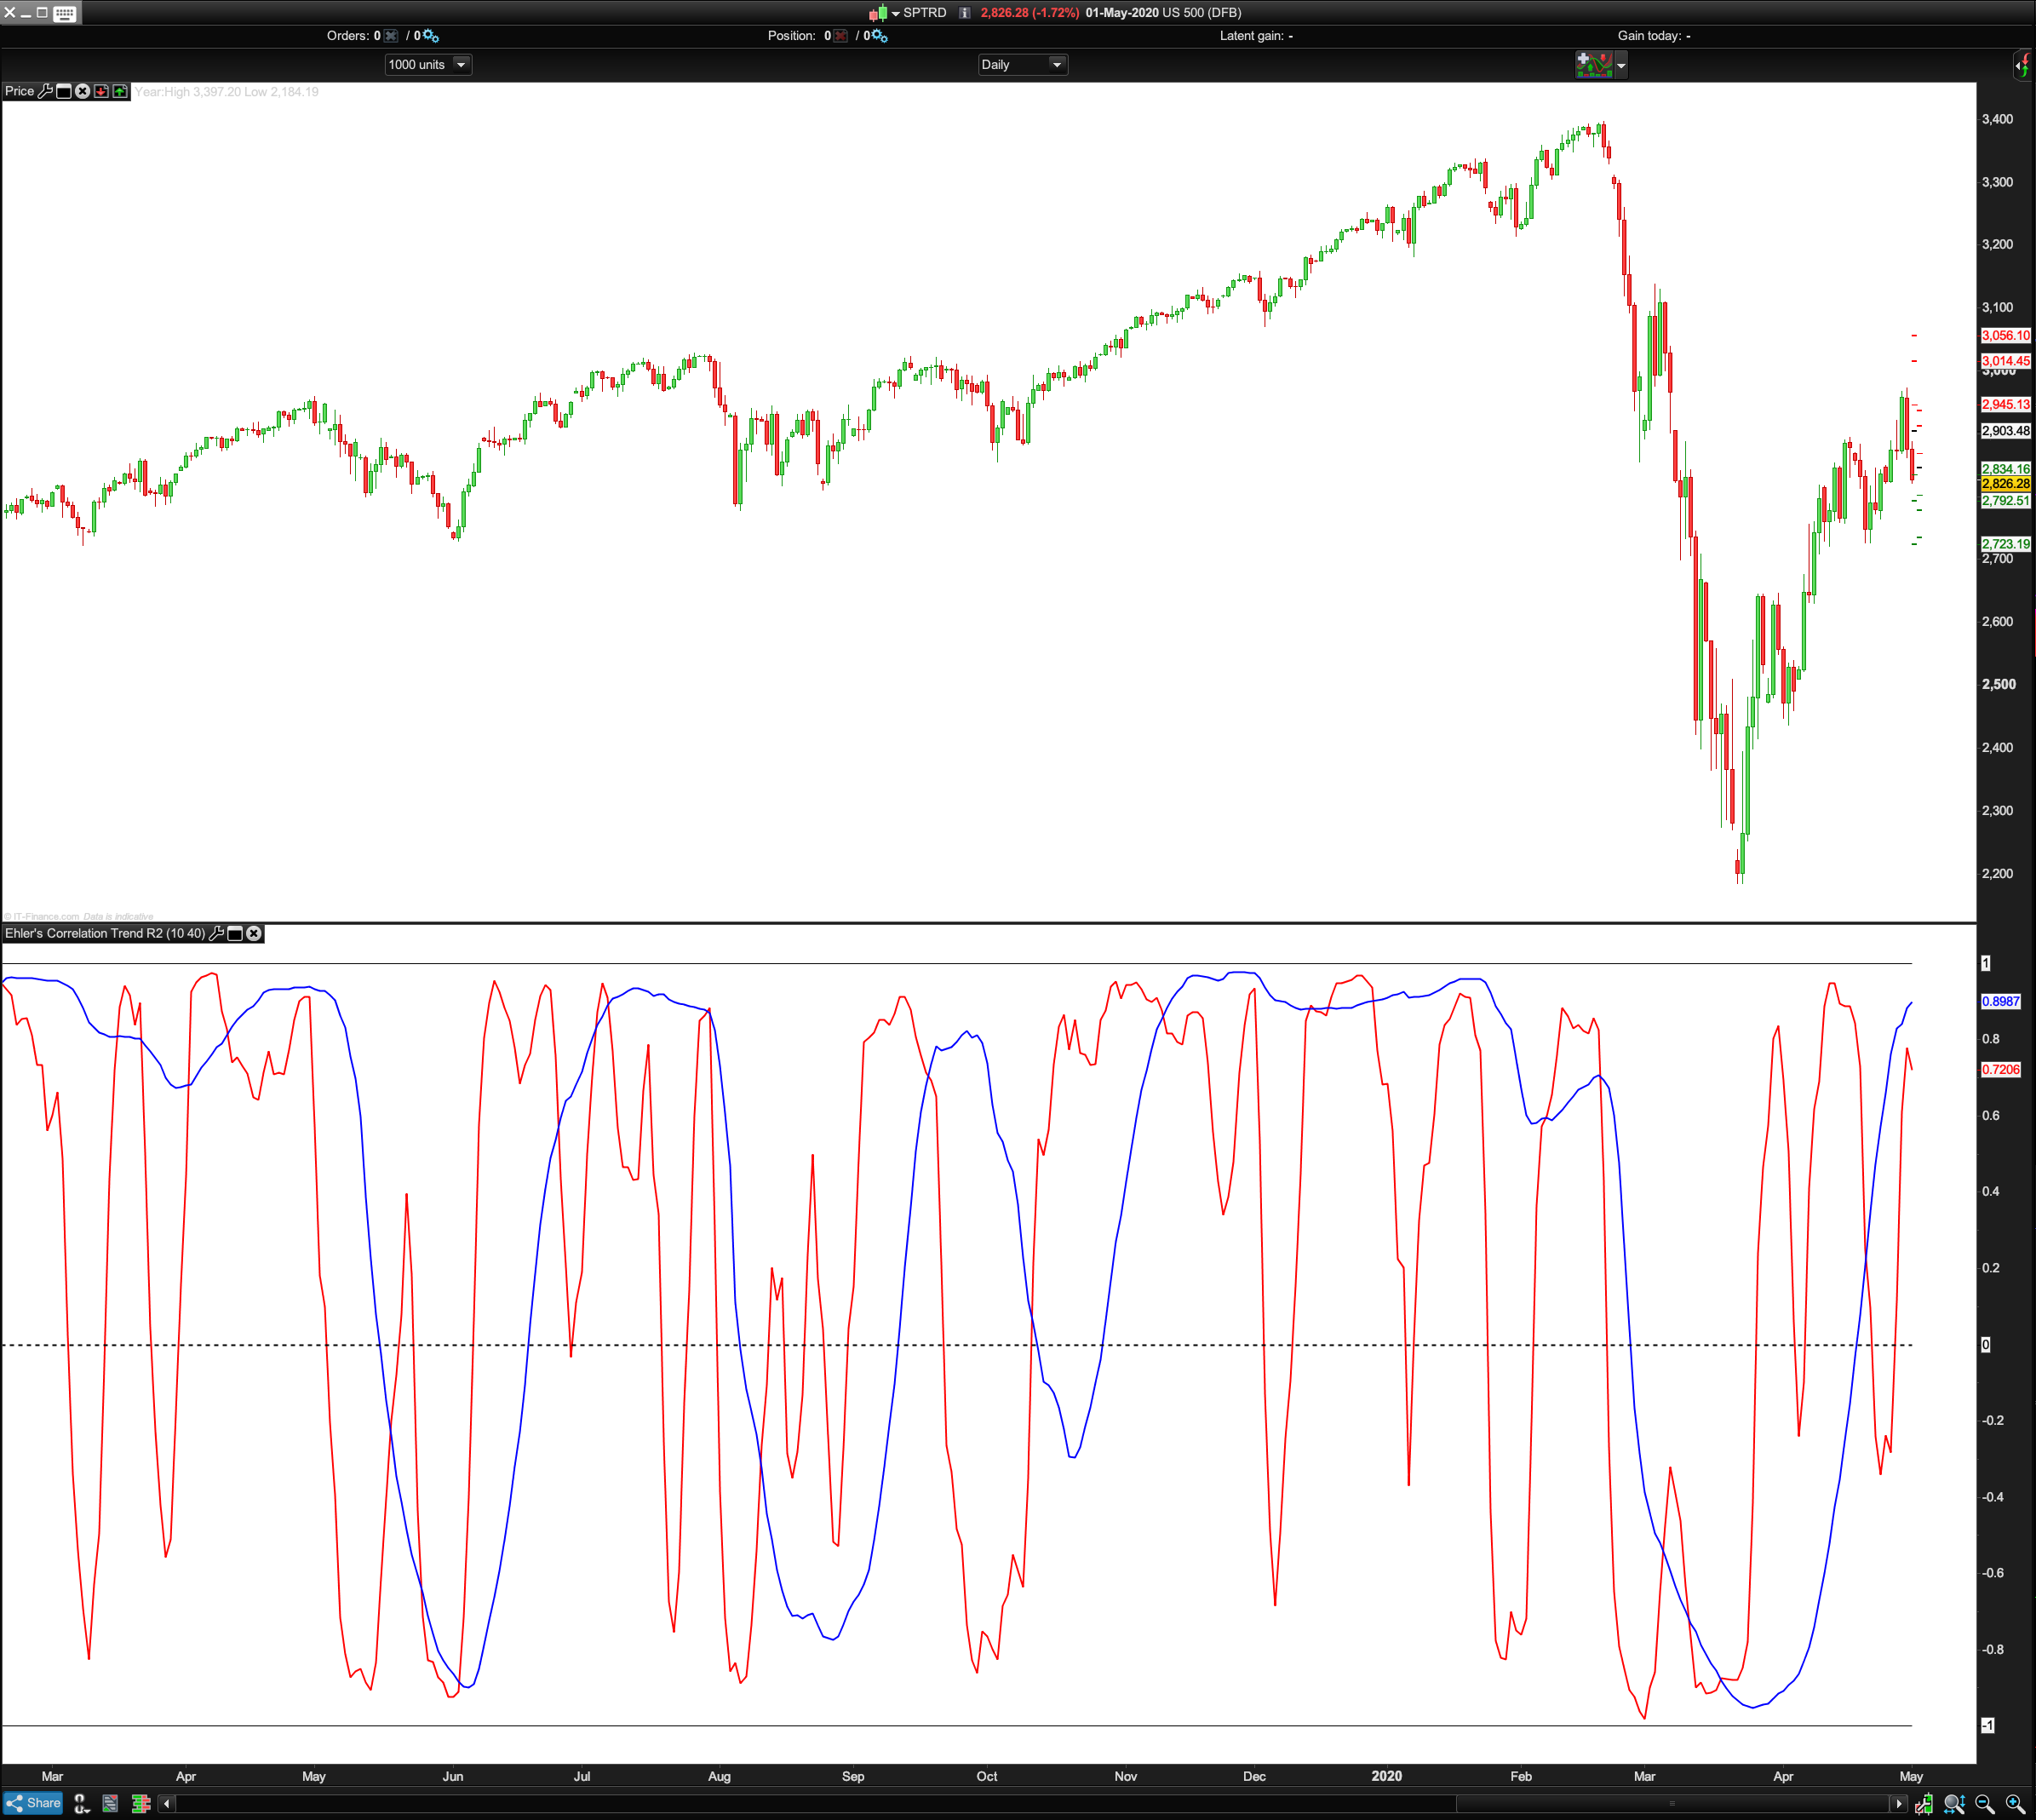
And S&P 500: Now it clearly looks like yours is the right way round (how could it not be), judging from the blue 40 day trend correlation from Nov 2019 onwards on the S&P 500 But then note how mine seems to correctly represent the crash on the far right and yours doesn’t, both you 10 and 40 period CTI’s are low and “non trending.”
This is slightly confusing to me why this is happening when the trends are
so clearly seen in the candlesticks? (Your code top, mine bottom).
This indicator is not giving you the trend direction, but the fact that the price is similar or not to a straight line (a linear regression), calculated over a given period.
BardParticipant
Master
I appreciate that Nicolas, but the cases where the market is clearly trending in one direction or another with little noise don’t
always seem to be reflected in the CTI?
For example in the S&P 500 above, your top CTI 40 day blue indicator picks up those two stable long uptrends (beginning and end of the chart) because the straight line correlation is strong yet completely misses the albeit only slightly less straight lined Covid19 market plunge, whereas my incorrect inverse (bottom) blue CTI picks it up. What is wrong with my equation, it was copied from PRT’s R2?
Then at the start of that market rout, my 10 day red CTI picks up the 7 day straight line plunge perfectly but yours doesn’t?
It’s the behaviour of your red line that first confused me. It completely misses the start of one of the biggest market plunges in history and that near perfect 7 day “linear” plunge!? How come?
Cheers,
BardParticipant
Master
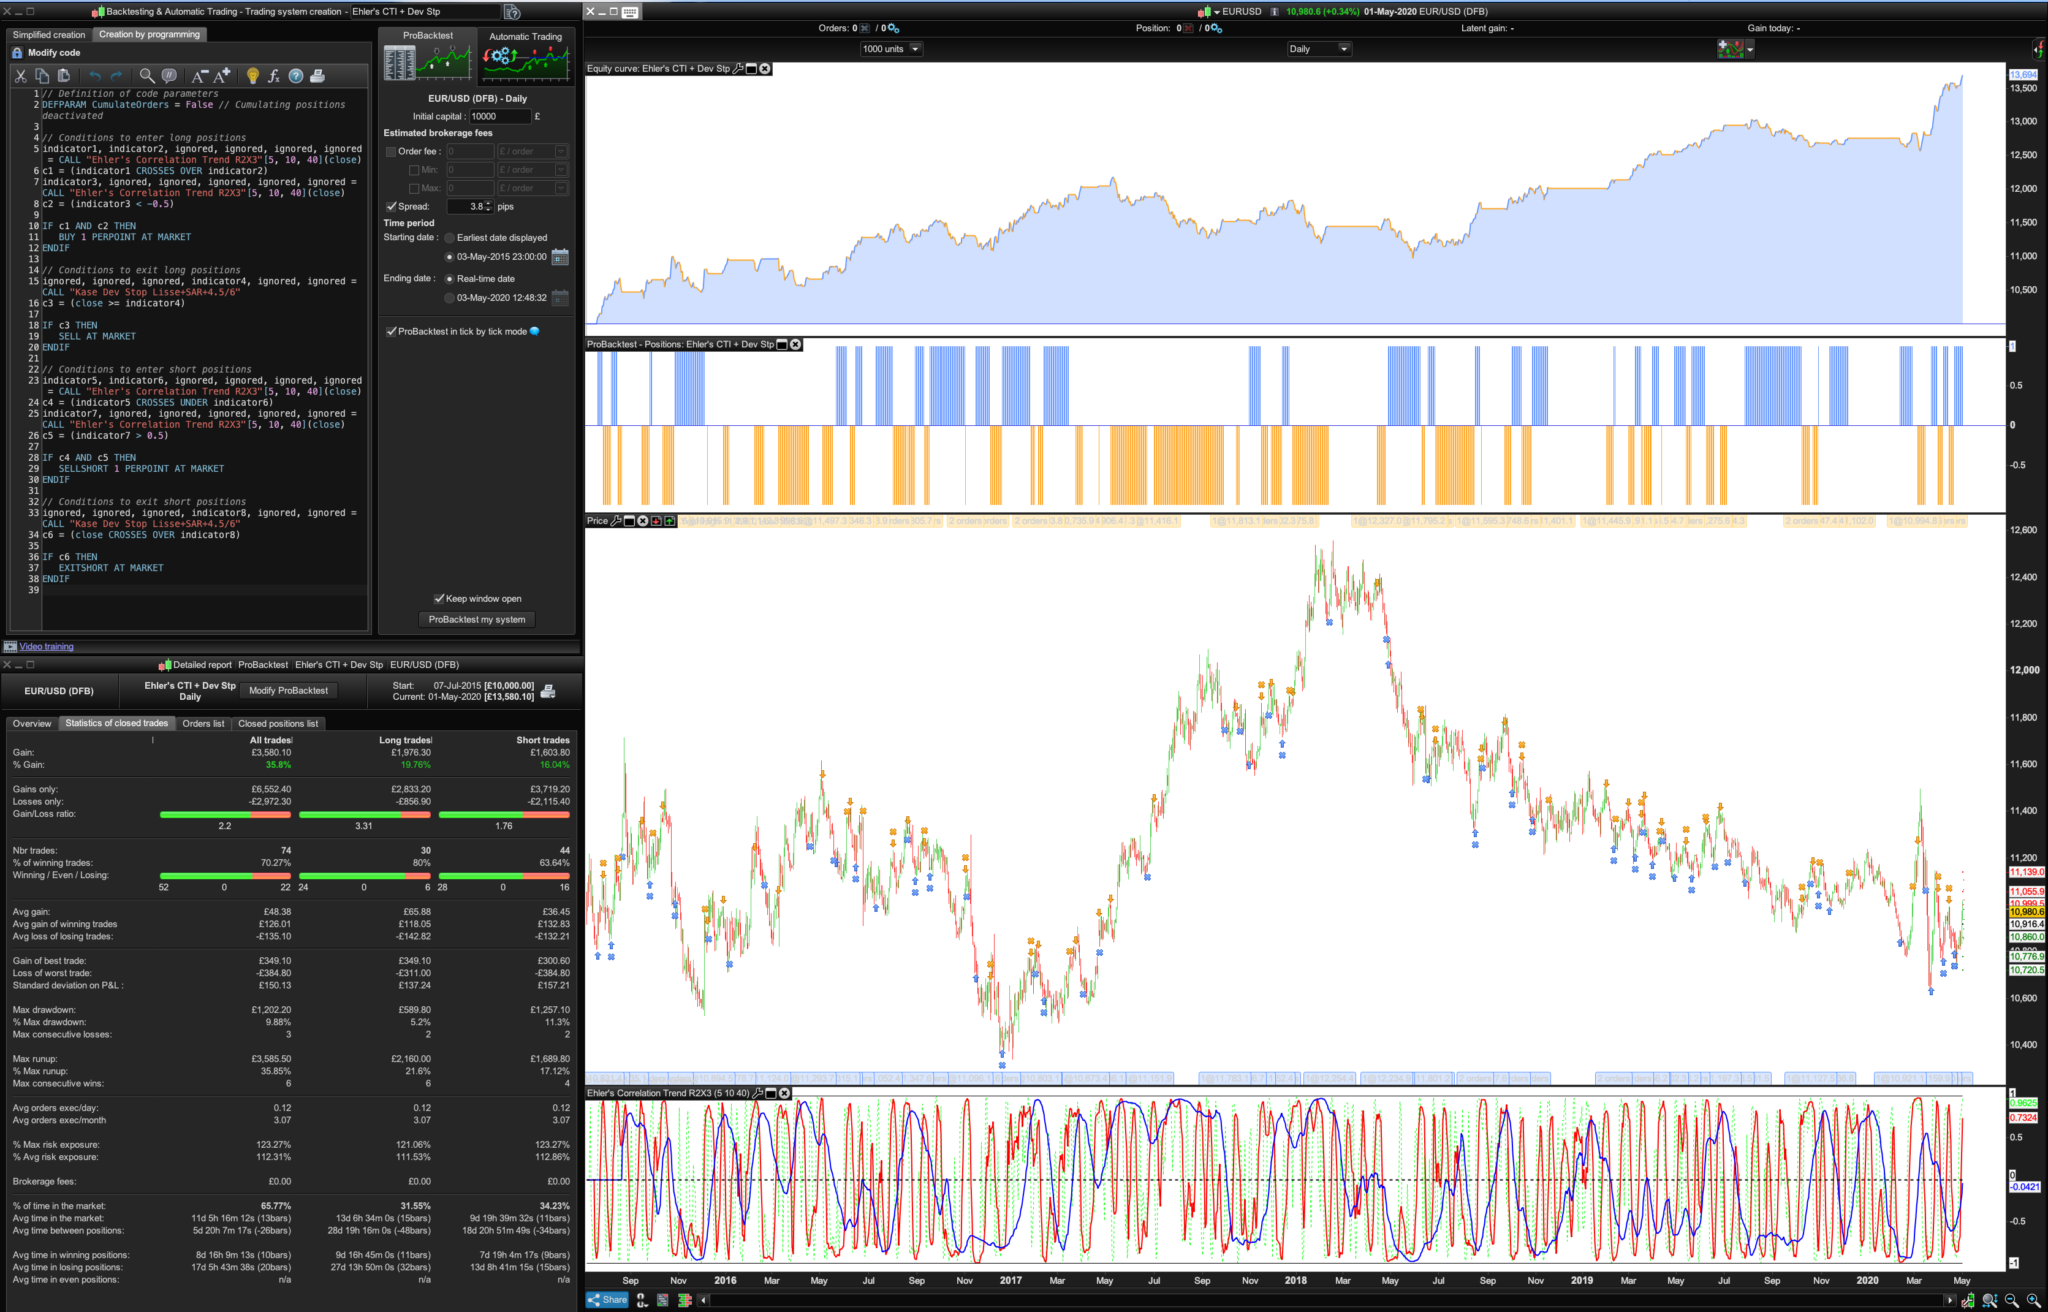
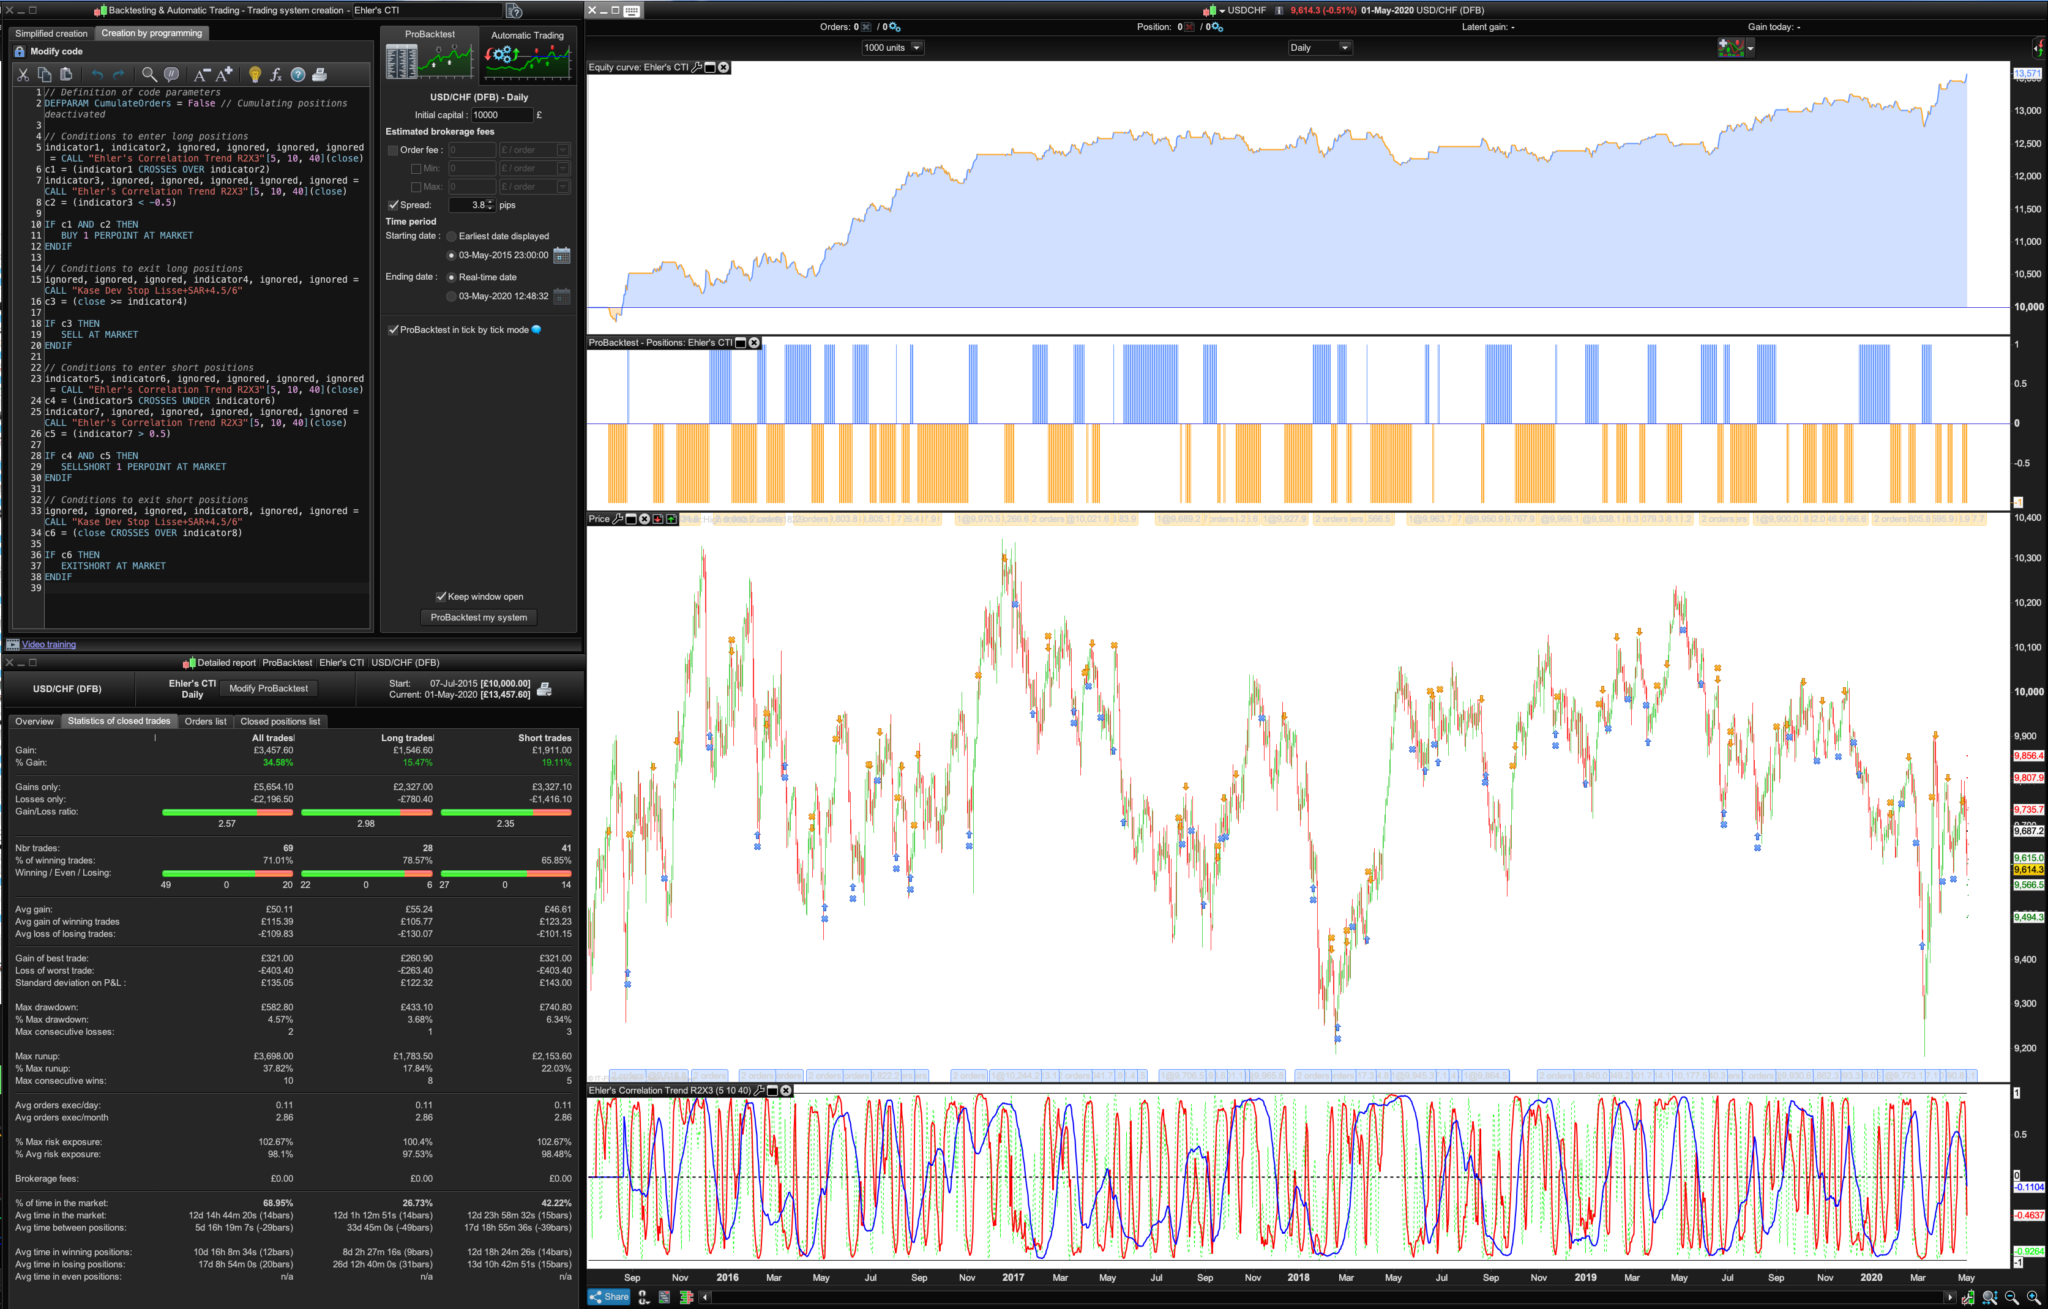
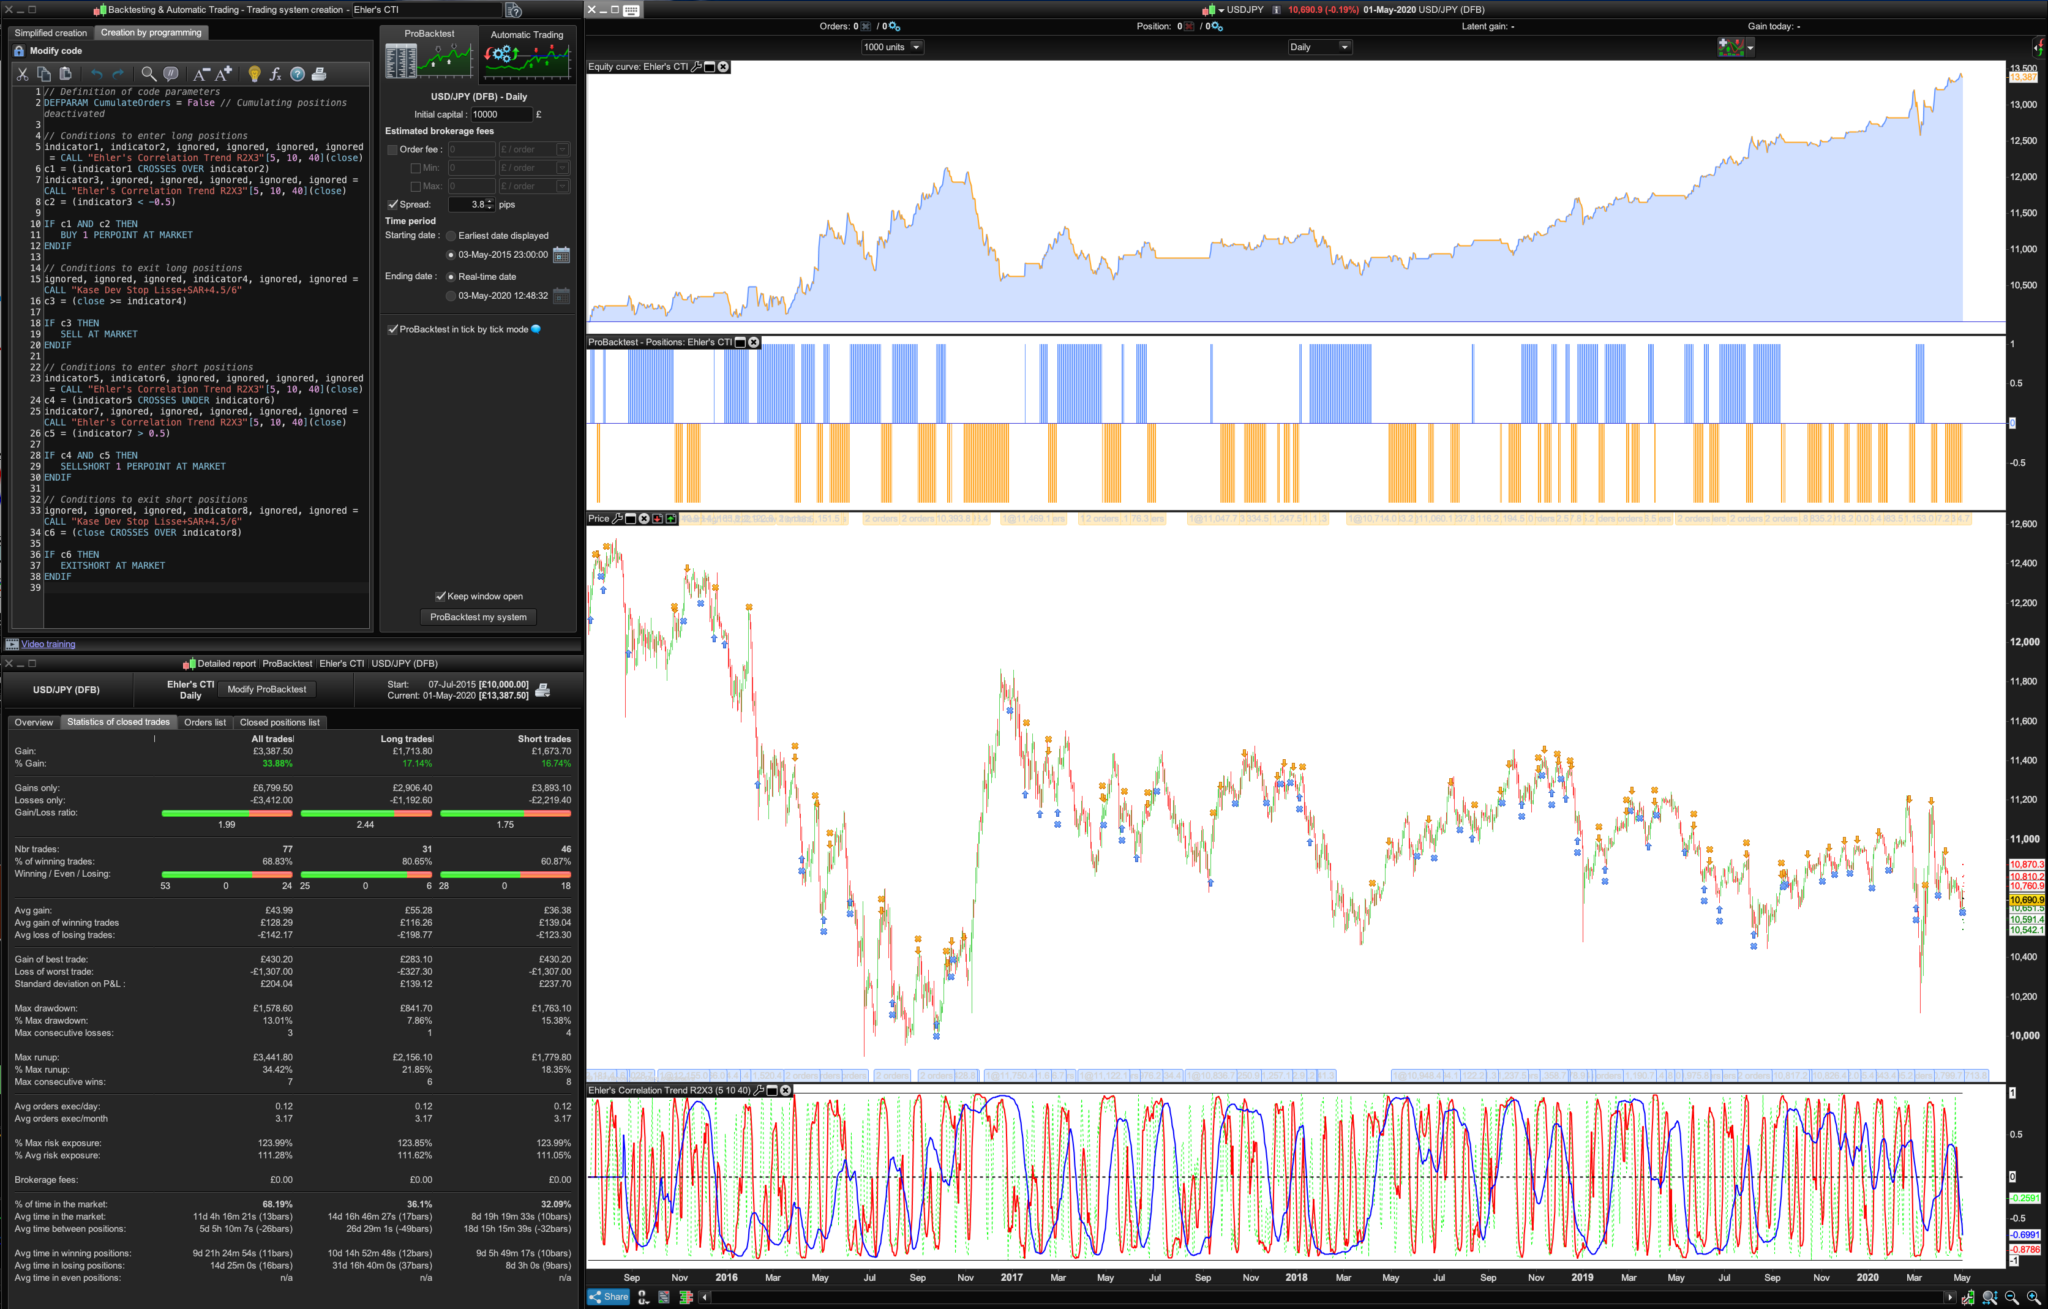
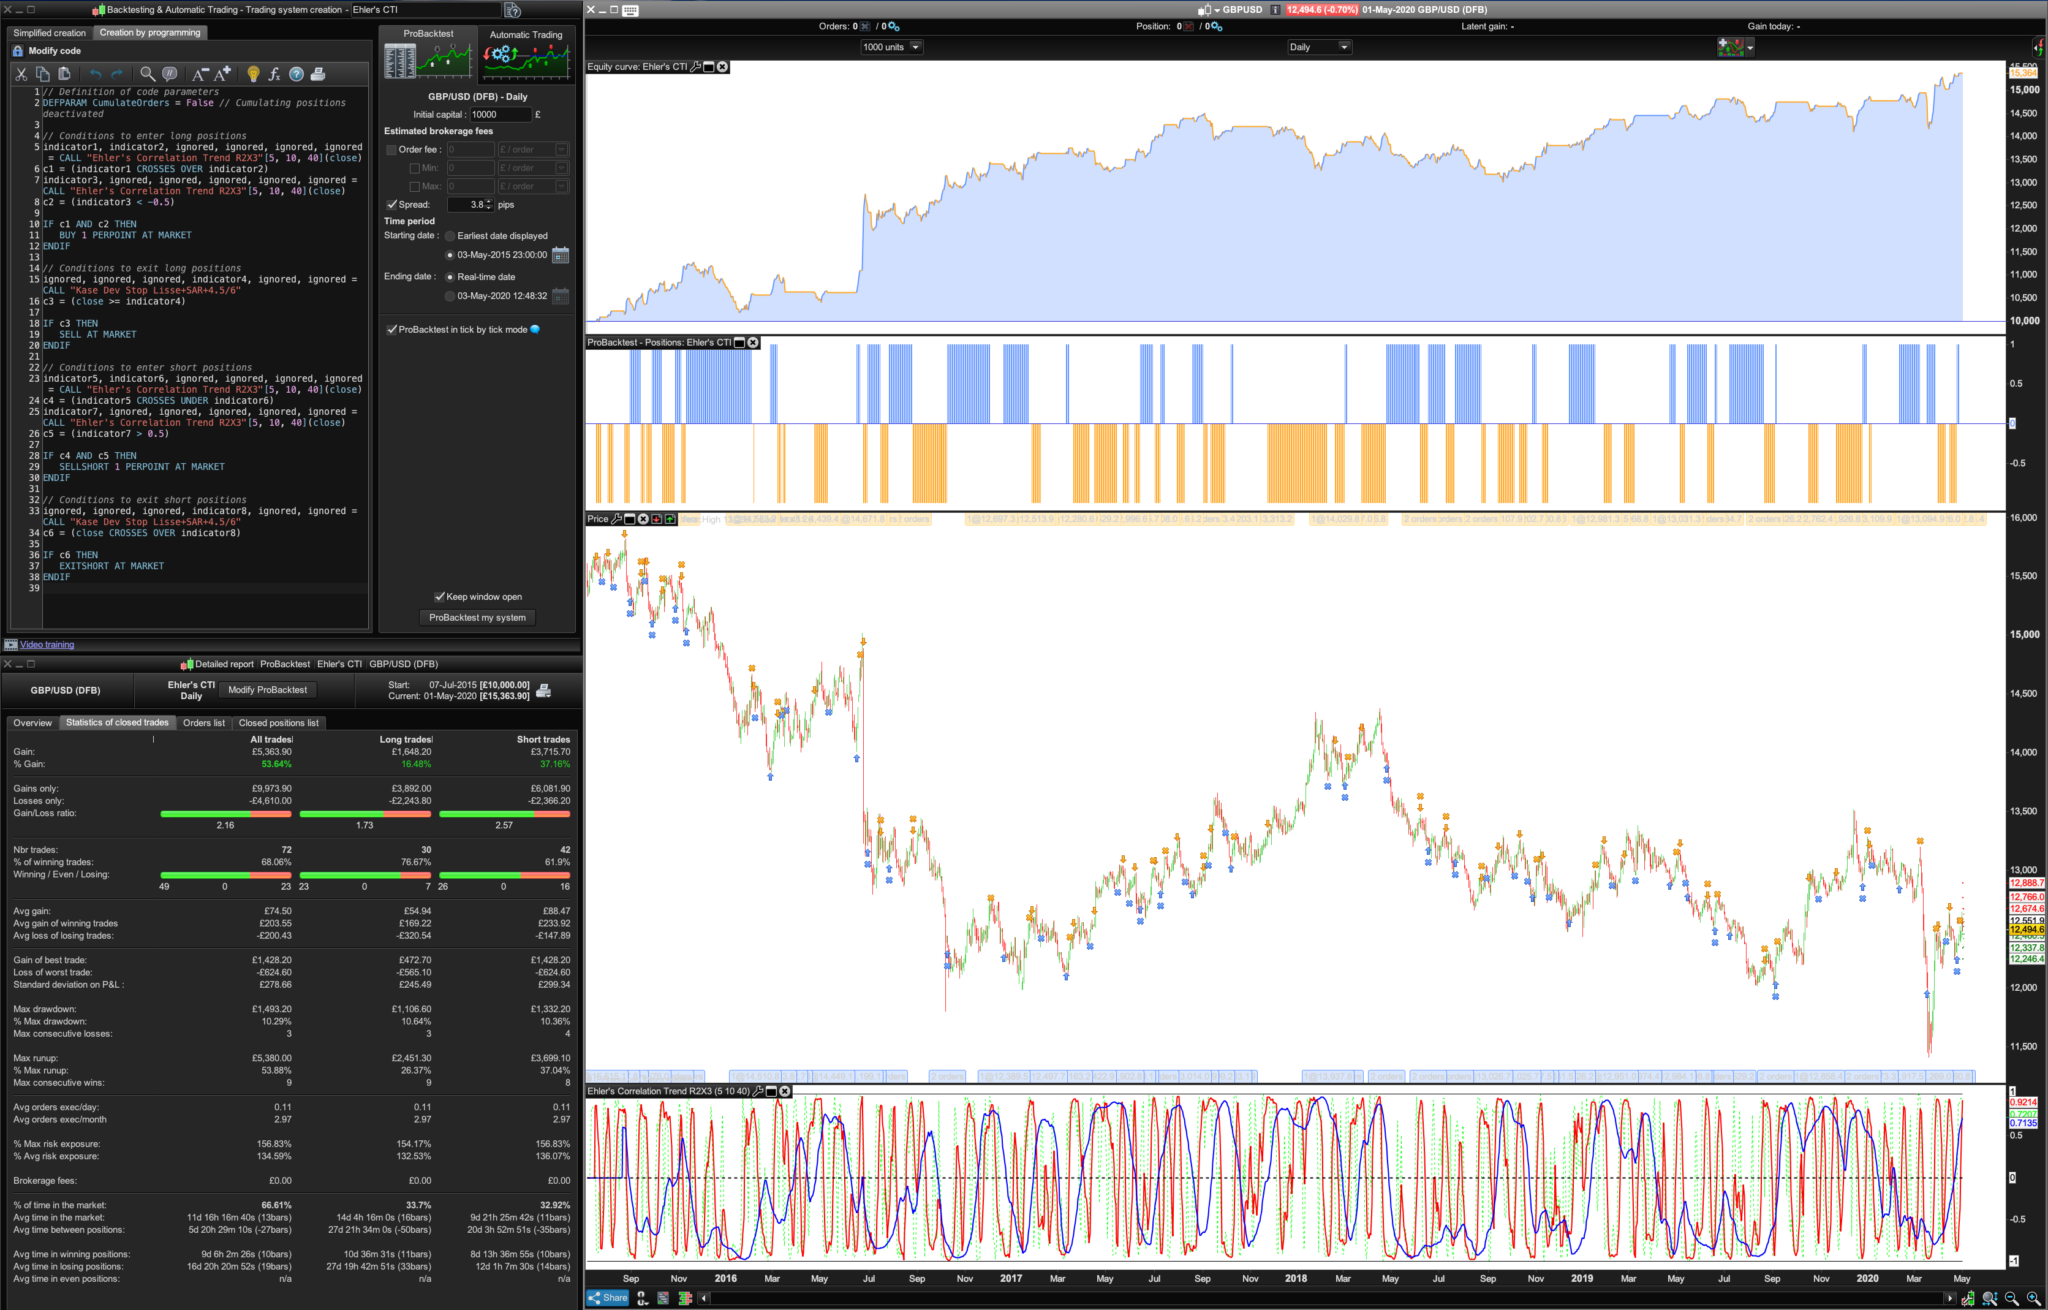
I put a 5 day CTI in there (along with the 10 and 40 period) to see if it would forecast the market rout, it didn’t but guess what? I spotted something that does suggest a strong link with trend direction and an exploitable relation: The cross of the 5 and 10 day CTI when it was below the -0.5 level or for shorts above the 0.5 level. Quite consistent! Pls see pics.
Please try this on the major currencies like the €/$, $/CHF, $/Yen, £/$ and AUD/$ for the last 5 years with a 3.8 spread:
Be interesting to see what Machine Learning does with those 0.5 thresholds or CTI periods?
“Ehler’s CTI + Dev Stop”
// Definition of code parameters
DEFPARAM CumulateOrders = False // Cumulating positions deactivated

// Conditions to enter long positions
indicator1, indicator2, ignored, ignored, ignored, ignored = CALL "Ehler's Correlation Trend R2X3"[5, 10, 40](close)
c1 = (indicator1 CROSSES OVER indicator2)
indicator3, ignored, ignored, ignored, ignored, ignored = CALL "Ehler's Correlation Trend R2X3"[5, 10, 40](close)
c2 = (indicator3 < -0.5)

IF c1 AND c2 THEN
BUY 1 PERPOINT AT MARKET
ENDIF

// Conditions to exit long positions
ignored, ignored, ignored, indicator4, ignored, ignored = CALL "Kase Dev Stop Lisse+SAR+4.5/6"
c3 = (close >= indicator4)

IF c3 THEN
SELL AT MARKET
ENDIF

// Conditions to enter short positions
indicator5, indicator6, ignored, ignored, ignored, ignored = CALL "Ehler's Correlation Trend R2X3"[5, 10, 40](close)
c4 = (indicator5 CROSSES UNDER indicator6)
indicator7, ignored, ignored, ignored, ignored, ignored = CALL "Ehler's Correlation Trend R2X3"[5, 10, 40](close)
c5 = (indicator7 > 0.5)

IF c4 AND c5 THEN
SELLSHORT 1 PERPOINT AT MARKET
ENDIF

// Conditions to exit short positions
ignored, ignored, ignored, indicator8, ignored, ignored = CALL "Kase Dev Stop Lisse+SAR+4.5/6"
c6 = (close CROSSES OVER indicator8)

IF c6 THEN
EXITSHORT AT MARKET
ENDIF
BardParticipant
Master
Here’s the Ehler’s CTI + Dev Stop System itf, easier than posting this as I hope it will include the Kase Dev Stop SAR version I used.
Also here is the Double Ehler’s CTI, I’ll add it to the library when I get more time today:
//Ehler's Correlation Trend Indicator (CTI)
//PRC_R-Squared coefficient | indicator
//19.09.2018
//Updated to double Ehler's R2 03/05/2020
//Nicolas @ www.prorealcode.com
//Sharing ProRealTime knowledge

// --- settings
//LPeriod     =40 //Add in Variables
//SPeriod     =10 //Add in Variables
// --- end of settings

//LPeriod=40
//SPeriod=10

///////////////////////////////////////////////////////////////////////////////////////////////////

//Short
SumSx = 0 // the price curve
SumSy = 0
SumSxx = 0
SumSxy = 0
SumSyy = 0 // the trend line

data=customclose

for count = 0 to SPeriod-1 do
X = Data[count] // the price curve
Y = -count // the trend line
SumSx = SumSx + X
SumSy = SumSy + Y
SumSxx = SumSxx + X*X
SumSxy = SumSxy + X*Y
SumSyy = SumSyy + Y*Y
next

if(SPeriod*SumSxx-SumSx*SumSx > 0 and SPeriod*SumSyy-SumSy*SumSy > 0) then
CTIShort = (SPeriod*SumSxy-SumSx*SumSy)/Sqrt((SPeriod*SumSxx-SumSx*SumSx)*(SPeriod*SumSyy-SumSy*SumSy))
endif

///////////////////////////////////////////////////////////////////////////////////////////////////

//Long
SumLx = 0
SumLy = 0
SumLxx = 0
SumLxy = 0
SumLyy = 0

for count = 0 to LPeriod-1 do
X = Data[count] // the price curve
Y = -count // the trend line
SumLx = SumLx + X
SumLy = SumLy + Y
SumLxx = SumLxx + X*X
SumLxy = SumLxy + X*Y
SumLyy = SumLyy + Y*Y
next

if(LPeriod*SumLxx-SumLx*SumLx > 0 and LPeriod*SumLyy-SumLy*SumLy > 0) then
CTILong = (LPeriod*SumLxy-SumLx*SumLy)/Sqrt((LPeriod*SumLxx-SumLx*SumLx)*(LPeriod*SumLyy-SumLy*SumLy))
endif

return CTIShort coloured (255,0,0) style (line,2) as "CTI Short R² Trend", CTILong coloured (0,0,255) style (line,2) as "CTI Long R² Trend", 0 style (dottedline,2)as "0", -1 as "-1", 1 as "1"
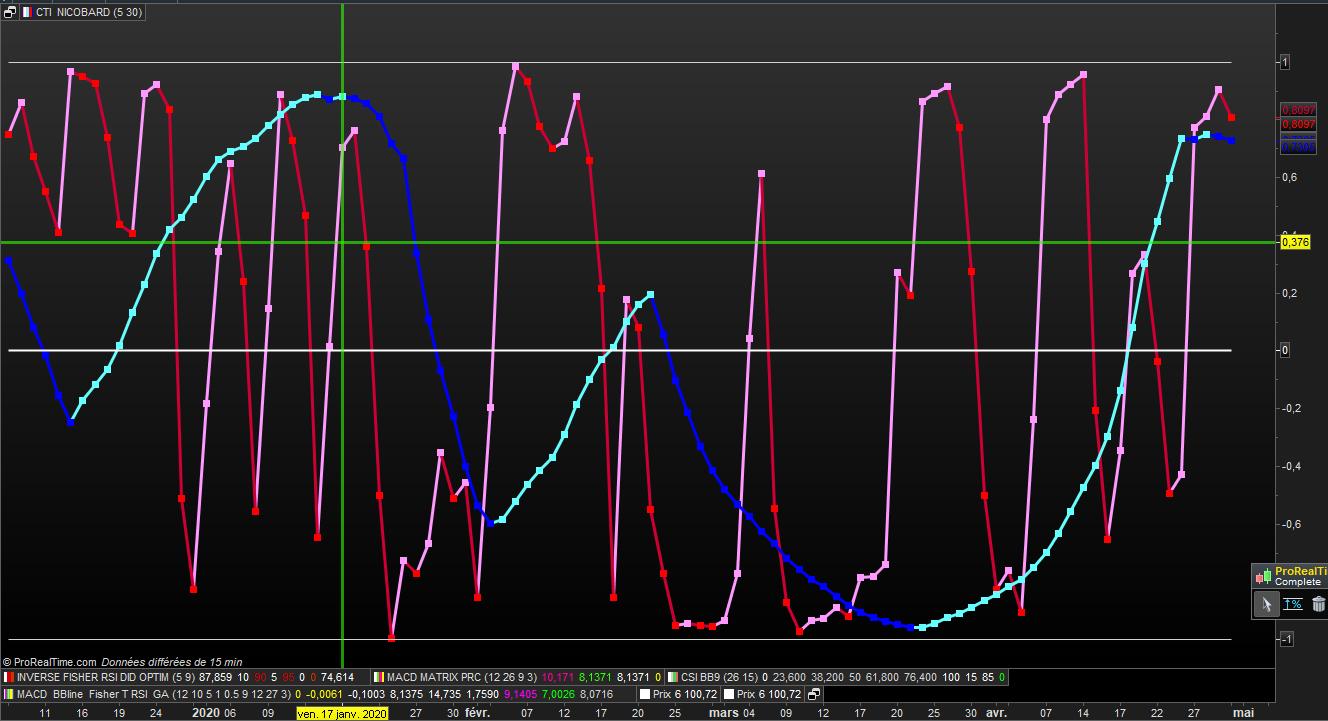
Hola Nico and Bard,
Can we have the same index with scale from 0 to 100 for apairing with others index ?
I use 5 and 30
attached graph of Cac40
// CTI NICO d'après BARD adapté par DID 02.05.2020

//Ehler's Correlation Trend Indicator (CTI) //PRC_R-Squared coefficient | indicator
//19.09.2018 //Nicolas @ www.prorealcode.com / Bard //Sharing ProRealTime knowledge

// --- settings
//SPeriod length   = 10   perso = 5//Add in Variables
//LPeriod lengthL  = 40   perso = 30 //Add in Variables
// --- end of settings

defparam calculateonlastbars = 100
// SHORT

Sx = 0
Sy = 0
Sxx = 0
Sxy = 0
Syy = 0

data=customclose

for count = 0 to Length -1 do
X = Data[count] // the price curve
Y = -count // the trend line
Sx = Sx + X
Sy = Sy + Y
Sxx = Sxx + X*X
Sxy = Sxy + X*Y
Syy = Syy + Y*Y
next
if(Length*Sxx-Sx*Sx > 0 and Length*Syy-Sy*Sy > 0) then
ctiS= (Length*Sxy-Sx*Sy)/sqrt((Length*Sxx-Sx*Sx)*(Length*Syy-Sy*Sy))
endif
//////////////////////////////////////////////////////////////

// LONG
Sx = 0
Sy = 0
Sxx = 0
Sxy = 0
Syy = 0

data=customclose

for count = 0 to LengthL -1 do
X = Data[count] // the price curve
Y = -count // the trend line
Sx = Sx + X
Sy = Sy + Y
Sxx = Sxx + X*X
Sxy = Sxy + X*Y
Syy = Syy + Y*Y
next
if(LengthL*Sxx-Sx*Sx > 0 and LengthL*Syy-Sy*Sy > 0) then
ctiL= (LengthL*Sxy-Sx*Sy)/sqrt((LengthL*Sxx-Sx*Sx)*(LengthL*Syy-Sy*Sy))
endif
//////////////////////////////////////////////////////////////
return ctiS  style (line,3) as " ctiS " , ctiS  style (point,5) as " ctiS " , ctiL   style (line,3)as " criL " ,ctiL   style (point,5)as " criL " , 0 as " zero " , 1 as " UN " , -1 as " MOINS UN "