Just asking before ranting (which I do anyway) :
Maybe ProRealTime provided a user guide somewhere for how to go about with the Optimization Result window ?
There seems so much all-over-wrong with it, that I start to wonder whether I need elaboration on how to use it.
And of course I am the only one with this more than severe issue, am I right ?
Anyway, without this user guide I can’t do anything anymore. So or provide this guide please, or revert to the June 22 version instantly (without please).
PS: It may happen that I can find out myself. In that case I will post the “how to” in this topic.
Main – or most important issue – is that I can’t find a way to show results in the Statistics form. This is so much noticeable that there has to be a way. And since the Result window now shows the results per (expandable) backtest version (per date / time) I really can imagine that I just don’t know the how-to.
And I really can’t be the only one ?
🙂
Dear Peter,
Following your request, please note that there is a guide in the back test manual page 30 but it doesn’t correspond to what the platform offers in terms of results.
But we are reworking the manuals so in a few weeks we will have a current help on this section.
https://www.prorealtime.com/en/help-manual/create-trading-systems
Regards
Victor from ProRealTime
Hello Victor,
I meant to ask for a possible new guide on the new means of showing Backtest Results.
I think it is obvious that I asked for something of which I know it does not exist. Just nothing works regarding backtesting / observing the results in the July 25 version (brought to me this morning).
How can it be that program versions are released that don’t work properly or for which there is no manual? Testing on customers didn’t work for car manufacturers either.
I thought it was my PRT that was broken. Restarted it a few times, but it didn’t get any better.
Guess it’s a new feature having a list with all your different backtest iterations and then see the combined result? What’s the reasoning behind that or is there somewhere I can turn it off?
Detailed Report doesn’t always get updated either. When Detailed Report doesn’t get updated, PRT has to be restarted, not just close down the report and reopen it from the chart window.
Guess it’s a new feature having a list with all your different backtest iterations and then see the combined result?
The Combined Result was already there for reasons (and at moments) I could never find. In the situation as of now it does not make sense at all (especially not if we see that the Max DrawDown is totalized).
The crux is in the different results one can now sustain, and to which you can revert or just revisit for comparison. I like it more than very much. 🙂
But not at all without the Statistics window. ;-(
Combined Result I remember from before if you were doing several markets, but now it makes zero sense. If I update a variable, why would I want to see their combined results?
If I get a Detailed Report on run #1 and then re-run optimizer (run #2), the Detailed Report does not get updated, even though some details like Max Run-Up/Down gets updated. You have to click on the chart and Detailed Report for every run (figured out how to do it without restarting). Extremely frustrating.
You have to click on the chart and Detailed Report for every run (figured out how to do it without restarting). Extremely frustrating.
Yes, and that does not even work for me because I already *have* a Statistics Report on-screen (as this is in Live). So what happens is that that one reloads with the contents which was already there (from Live trades). So no, a mess s a mess.
PS: It may happen that I can find out myself. In that case I will post the “how to” in this topic.
Whether intentional or something which always worked already :
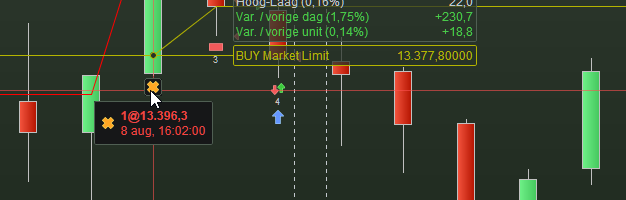
Click on a label like the yellow cross you see below, et voilá. A Statistics window will open with the Orderlist tab active (the clicked order on the top of the list).
You can click on any Result line of the Optimization Report window, which will show the Order labels for that result (obviously) in the chart; at clicking an Order label a new Statistics window will open showing the result of the now active backtest result. If the Statistics window for that result already was open, no new window will open (good).
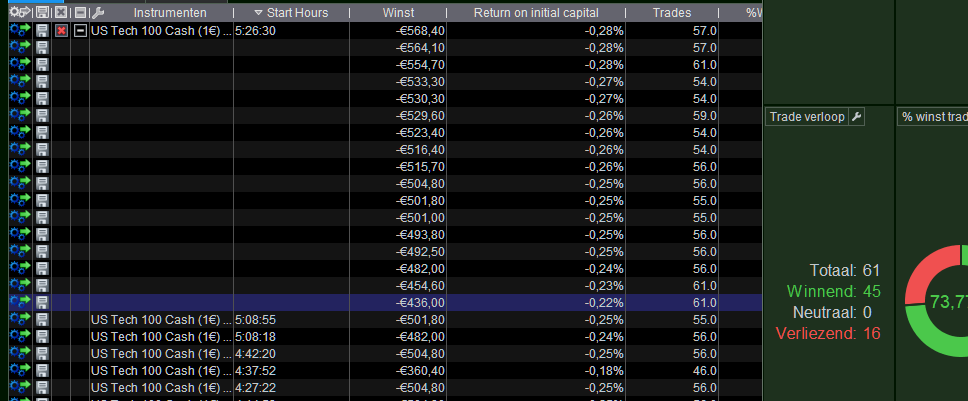
The nice (no great) thing of this is that when you’d have an Optimization result because of different parameter values you can click each of the results for the same procedure as described above and each result will have opened its own Statistics window which stays on screen. See 2nd attachment where I clicked the last line (now blue) in that result list of the one backtest(-run).
Hello Peter,
We have identified the problem you reported and our technical team is currently working on a correction, which will be implemented as soon as possible.
Please note that depending on the complexity of the needed correction, it may take up to several weeks for the problem to be fixed.
Victor from ProRealTime
The optimizer workflow we see now, is that how it’s going to be from now on?
All,
This issue has been resolved. It will be for you resolved as well, if you restart the platform and find a version from August 10.
Whether intentional or something which always worked already : Click on a label like the yellow cross you see below, et voilá. A Statistics window will open with the Orderlist tab active (the clicked order on the top of the list). You can click on any Result line of the Optimization Report window, which will show the Order labels for that result (obviously) in the chart; at clicking an Order label a new Statistics window will open showing the result of the now active backtest result. If the Statistics window for that result already was open, no new window will open (good). The nice (no great) thing of this is that when you’d have an Optimization result because of different parameter values you can click each of the results for the same procedure as described above and each result will have opened its own Statistics window which stays on screen. See 2nd attachment where I clicked the last line (now blue) in that result list of the one backtest(-run).
We have identified the problem you reported and our technical team is currently working on a correction, which will be implemented as soon as possible.
Victor, with your great help the original issue has thus been resolved *and* already put to production. But what I talk about in the quote from my text above, has now vanished. And it is such a great feature !
I genuinely hope that the rollback to the original working has been a quick and dirty one, and that clicking on the labels per my description is a feature which will return. Or just don’t overwrite the Statistics form – and open a new one instead – when a result line is clicked ?
I understand that for every common use the old means *had* to be restored (otherwise it would be too un-intuitive), but hope the combination of both means can be implemented !
Thanks !!
Peter