V July 25 what a mess : Backtest Results are all over the place

Forums ProRealTime English forum ProRealTime platform support V July 25 what a mess : Backtest Results are all over the place

Viewing 15 posts - 1 through 15 (of 18 total)
  • #201294

    I call this V July 25, although we’re on August 31 by now, but it is about the new means of “Multi” presentation of Optimization Results.
    N.b.: I waited with reporting this, watching for at least one other to report the same – but No; nobody.

    <hr />

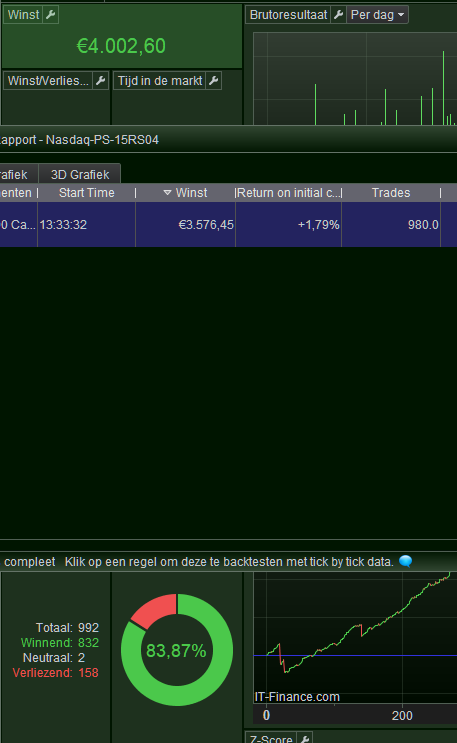
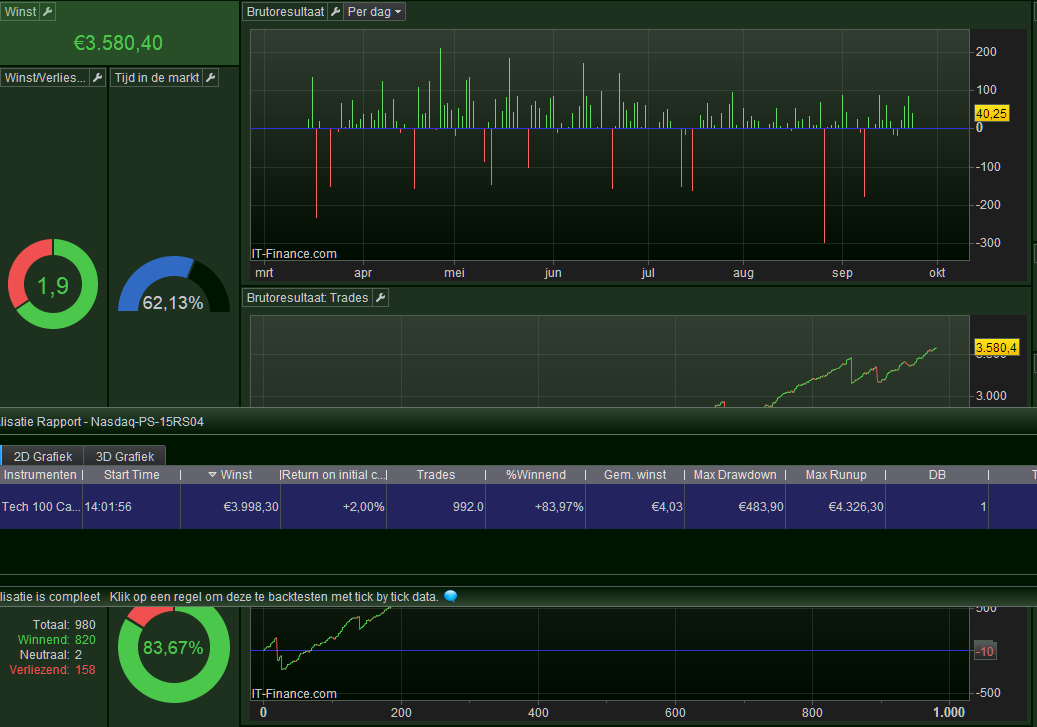
    I have several examples, but this is a most clear one because easy to follow. All examples are similar : the selected line in the Optimization Results does not show the result of *that* but of something else. Usually it can not be seen where the result comes from, which makes the result quite wrong and randomly wrong. All ‘n all this is unworkable …

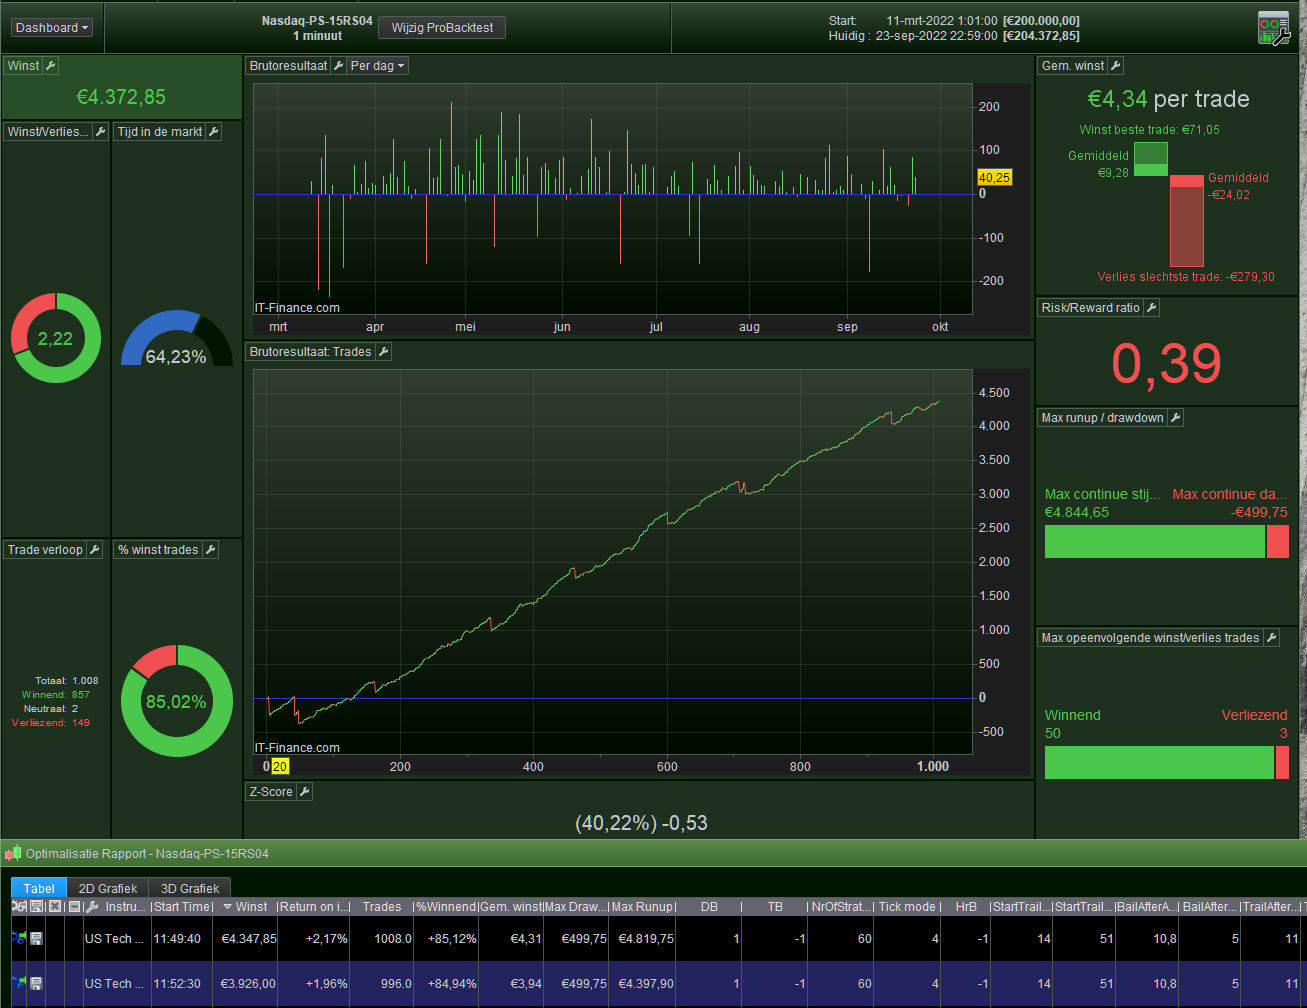
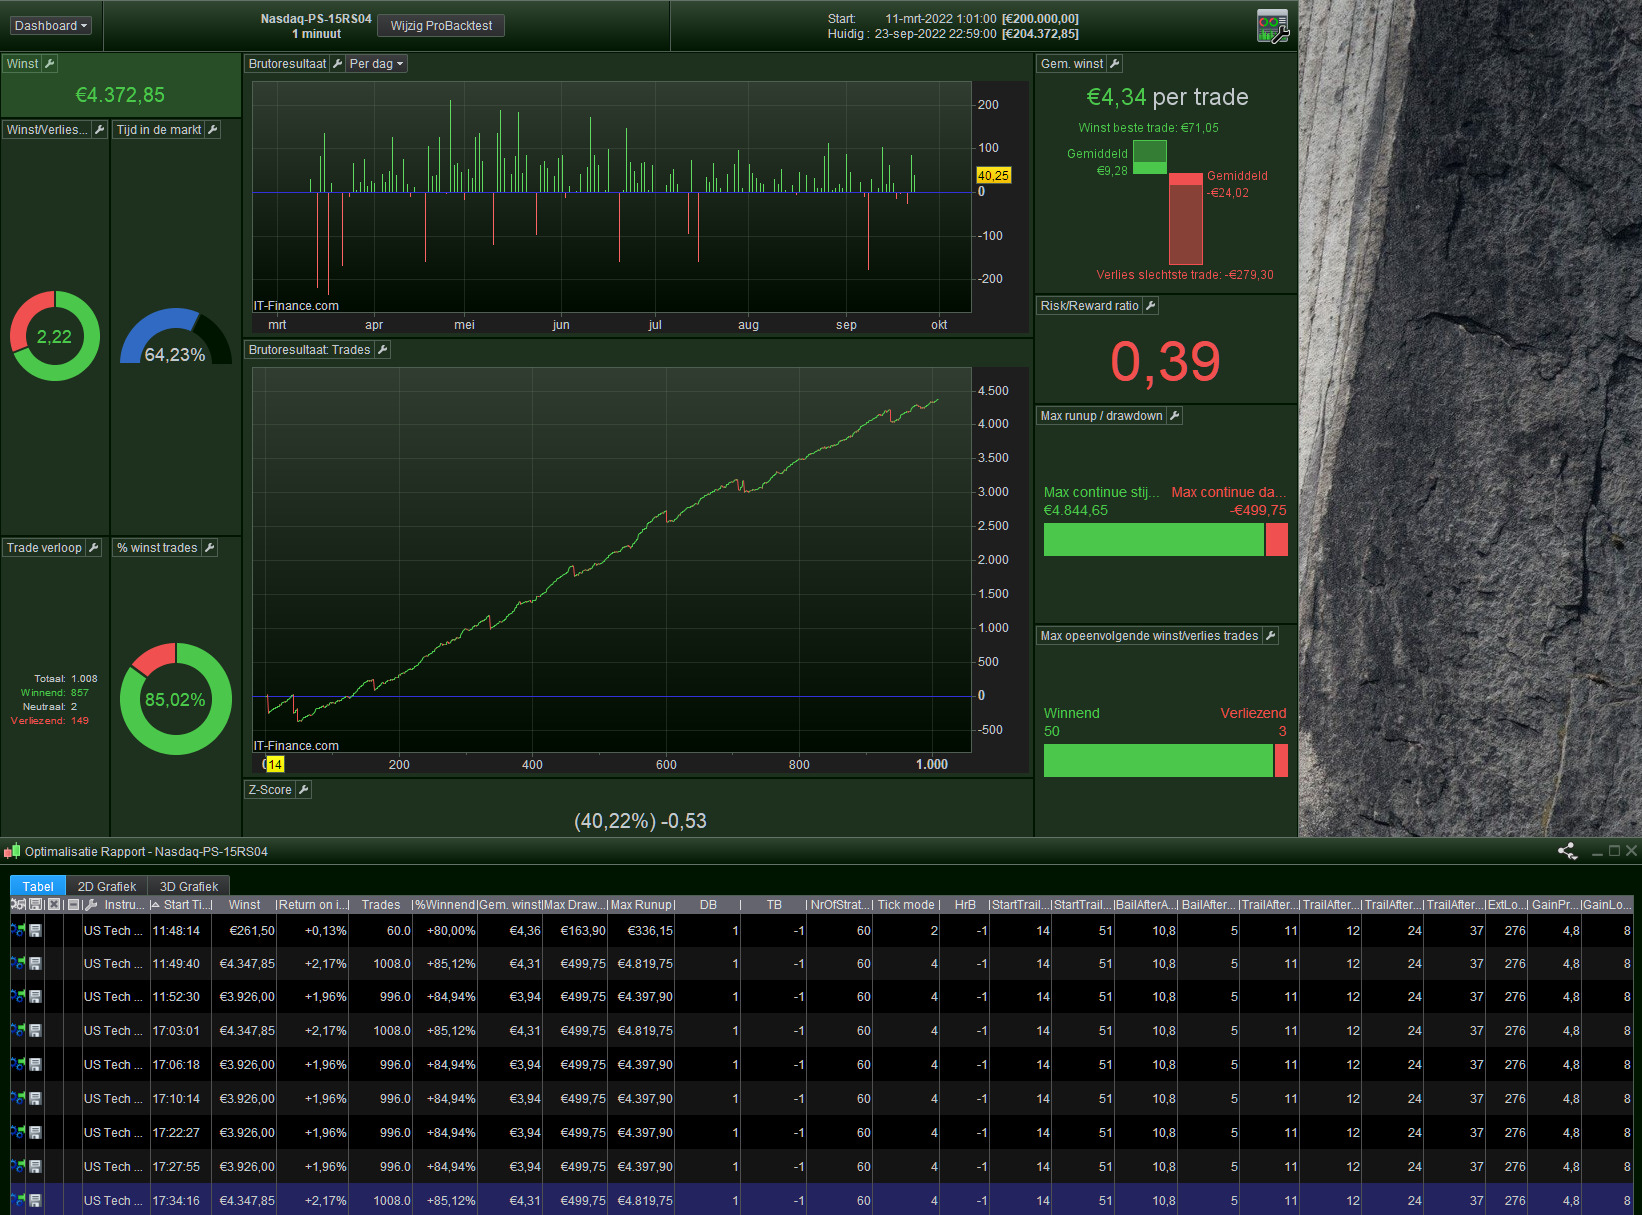
    The first attachment shows the result of the selected line, which is the blue line. This comes from an explicit backtest.
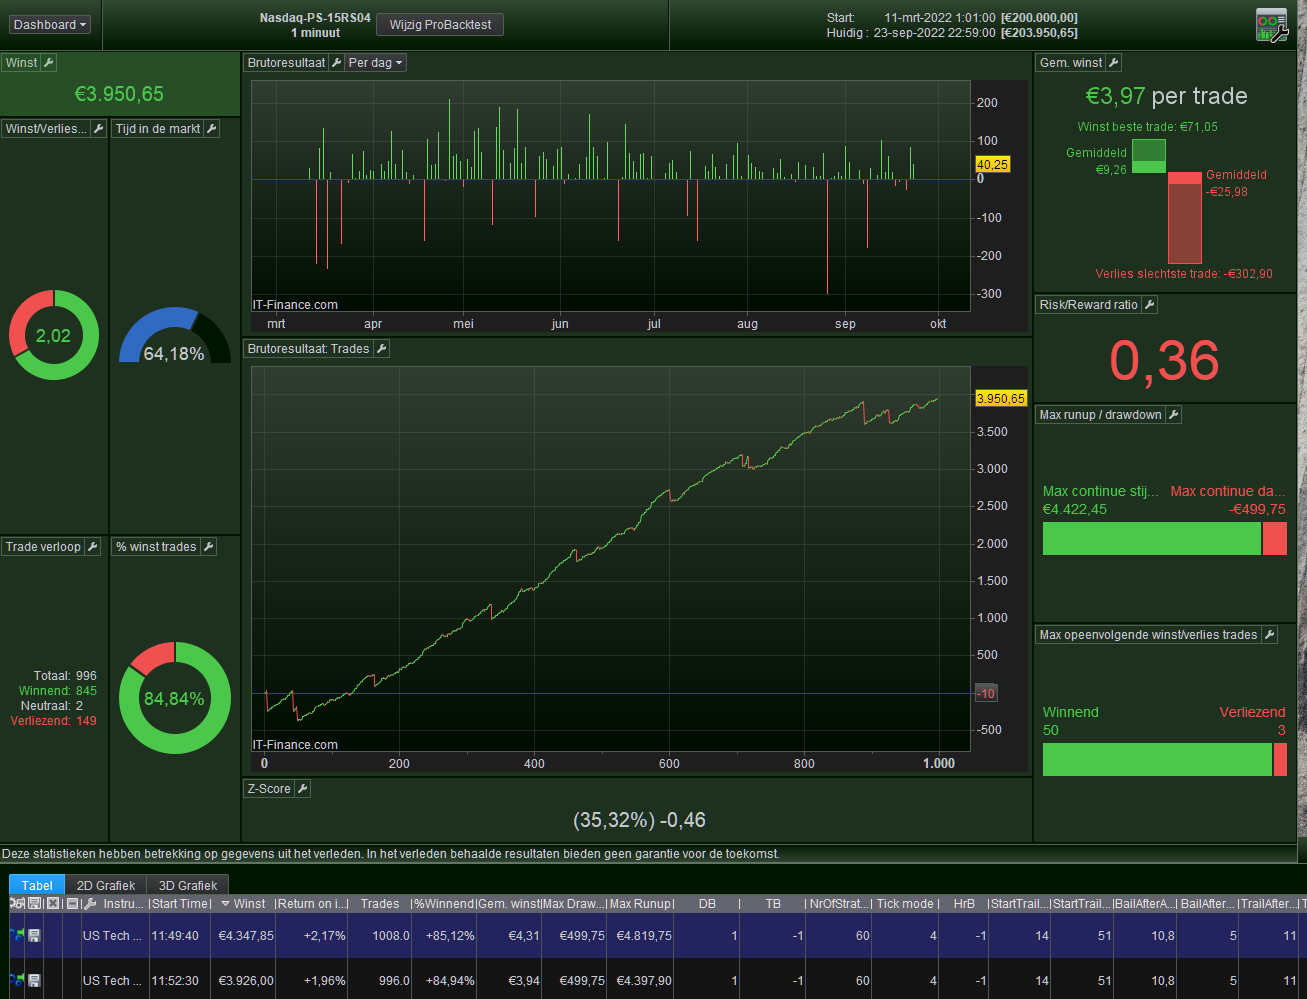
    Side note : watch the number of trades, which is usually *the* means to find the real results in the appropriate statistics form (match with one of the result lines). Thus – and then wrongly – what shows in the first attachment are 1008 trades, which clearly does belong to the first line, and not the second which I selected. But promise in advance : would I click the first line then a statistics form with 996 trades will show. So let’s do that …

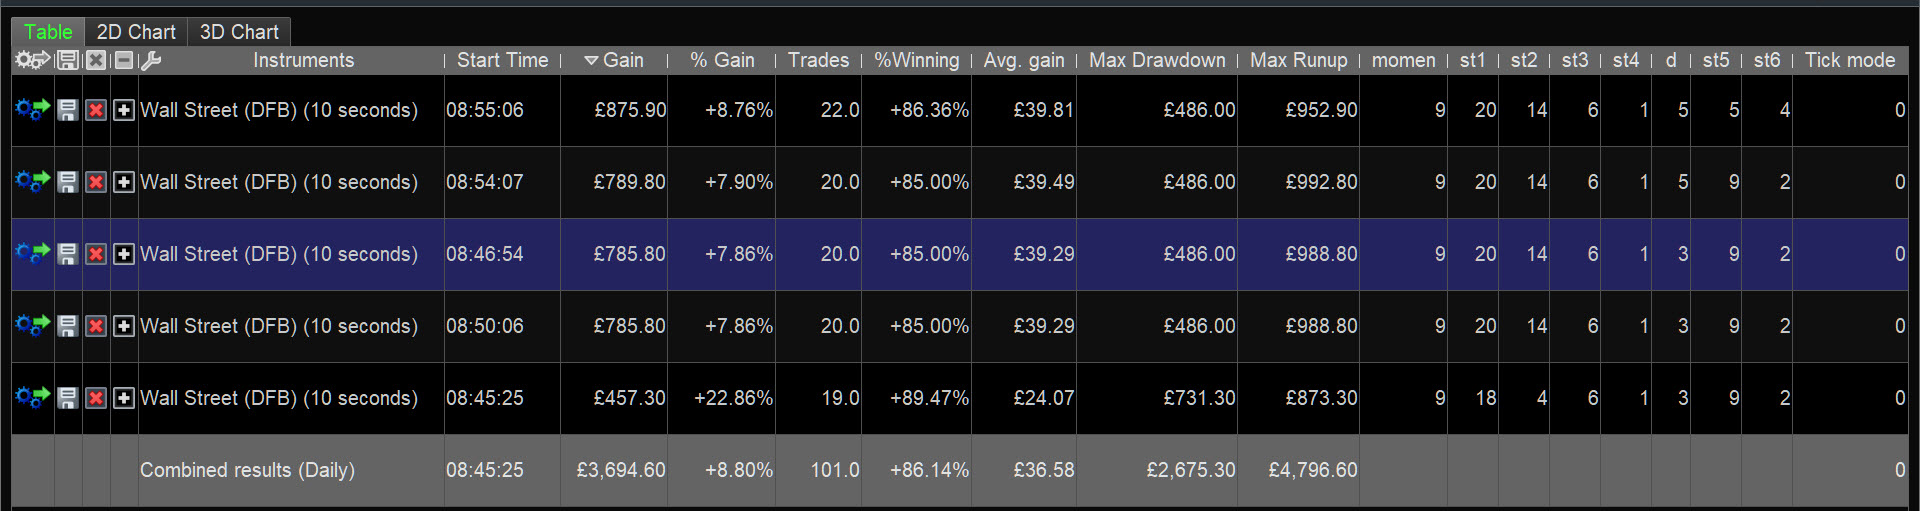
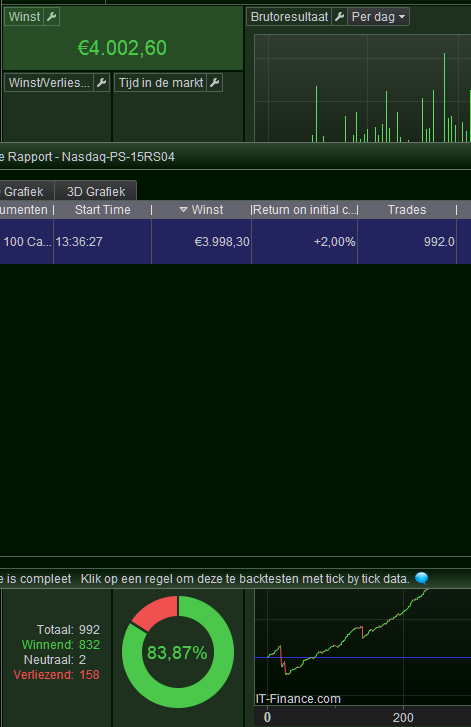
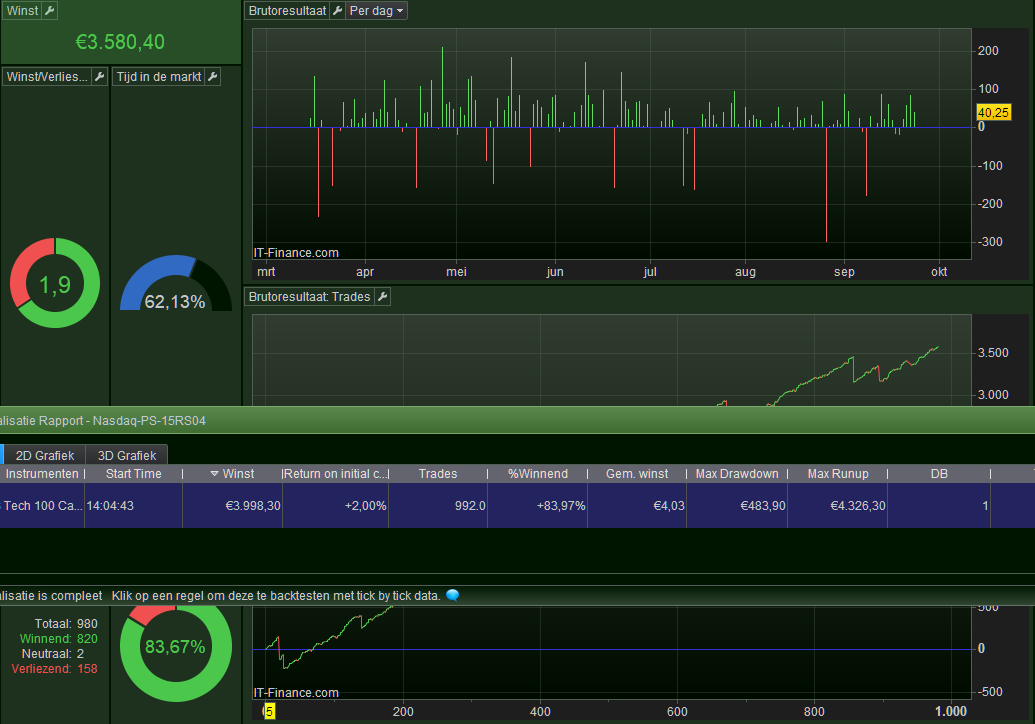
    After a bit of waiting, now the 2nd attachment shows.
    Big fun, because this belongs to the 2nd line – the one selected with the story above.

    —————-

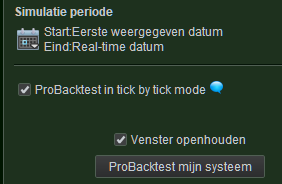
    This is only half or even less than half of the story, because both result lines should be the very same to begin with. I can tell you : in this super simple case the first line shown is the one which was automatically performed when the chart was changed from the default 10K to 200K and the 2nd line is the result of an explicit backtest (via the Editor window) and to be clear : with “In tick by tock mode” active (which is not related anyway, but still saying because it looks related surely).

    <hr />

    I by now experienced 100+ of these situations during a normal backtest session, where at some stage the statistics start to show too optimistically or the other way around : that something which had been too pessimistic so far, now starts to show more real results. In other words, I have no clue what the truth is, except for the observation that at some stage things “knack” and wont restore to normal. When then PRT is restarted, it boots up with the knacked result, and so I feel like having wasted several hours before the restart. It seriously is a big mess.

    I think I can recognize that things start to change when I move a varying Parameter to fixed, which somehow fixates error or good, but which I can’t restore to any previous situation by means of activating the fixed value to the same varying again. The result just won’t be the same any more, whatever I do, including the restart of PRT.
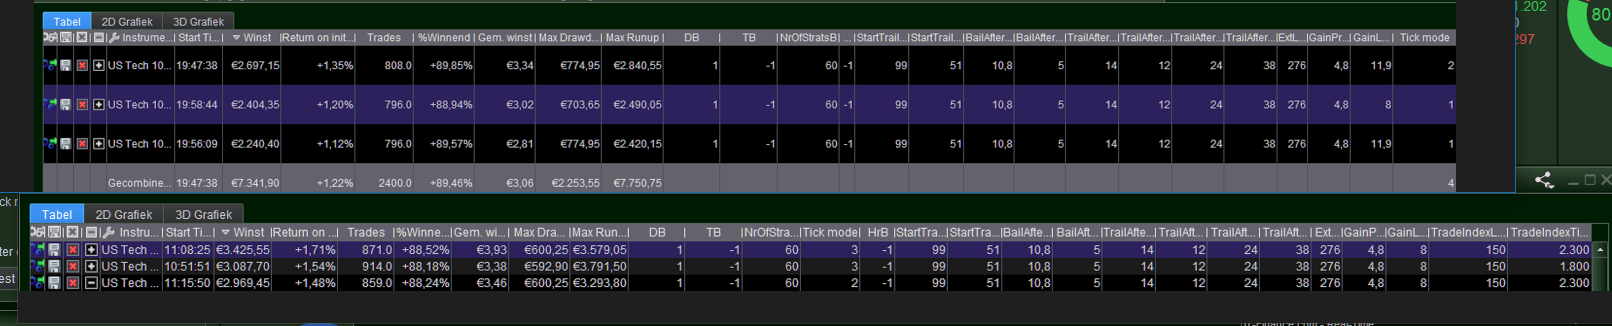
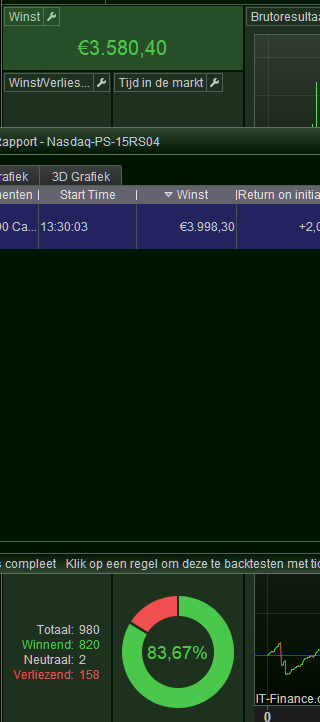
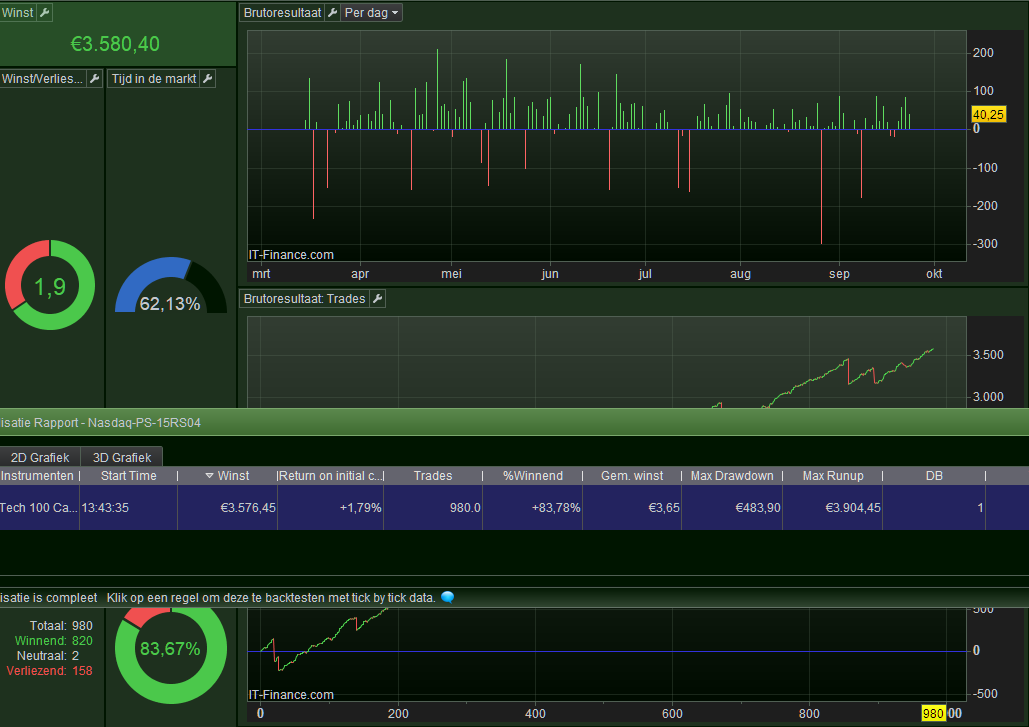
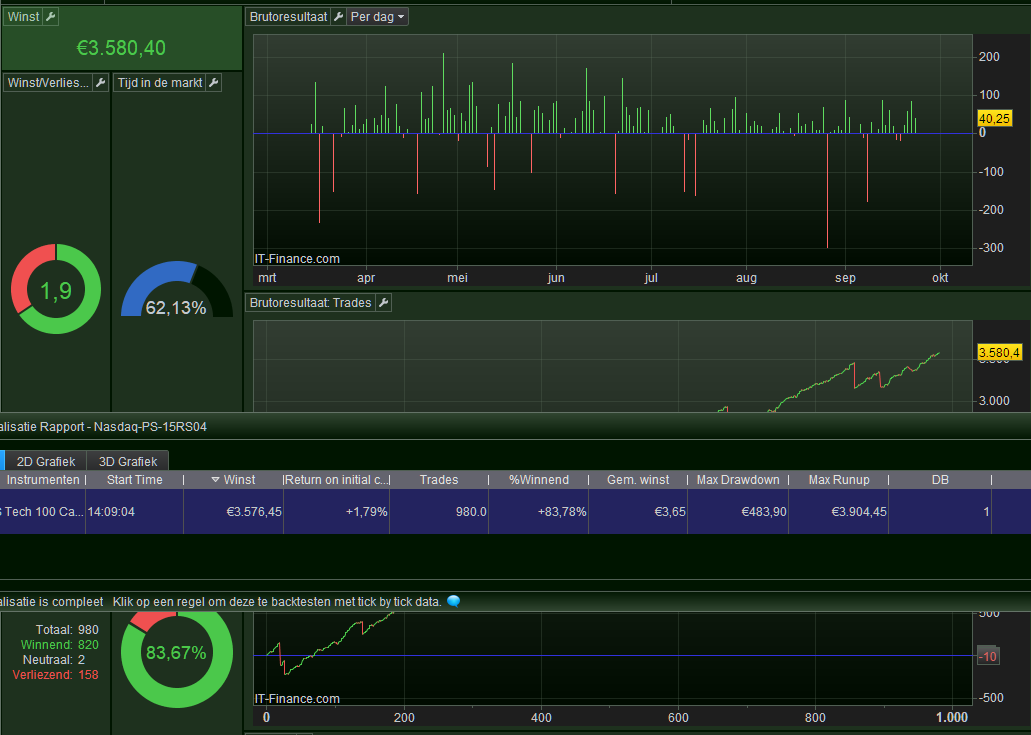
    In the third attachment you see an example of two of these situations occurring. In this case the right-most varying parameter “causes” a vary different situation in a first attempt vs a third attempt, the first optimization line consisting of the very same parameter values for all the parameters compared to the third line. But the number of trades and the profit (“winst”) are not equal at all. And so I can’t tell whether even one of the lines is correct (as they could both be wrong).
    So look for the 11,9 (and all else) being equal in line 1 and line 3 for the first example, and the 2300 (and all else) being equal in line 1 and 3 for the second example.

    Notice that the “+” sign (4th column) in the 2nd attachment relates to optimization results over varying parameters, but that the expanded content never leads to “seeing through” what the system does for real or what it does wrongly. This is contrary to the 1st attachment where things are obviously swapped, while at the first result in there (1st attachment) the 2nd result is not even there, thus it is *not* a matter of “things are swapped”. It just goes wrong all together and everywhere, and I can’t see the sense in anything.

    <hr />

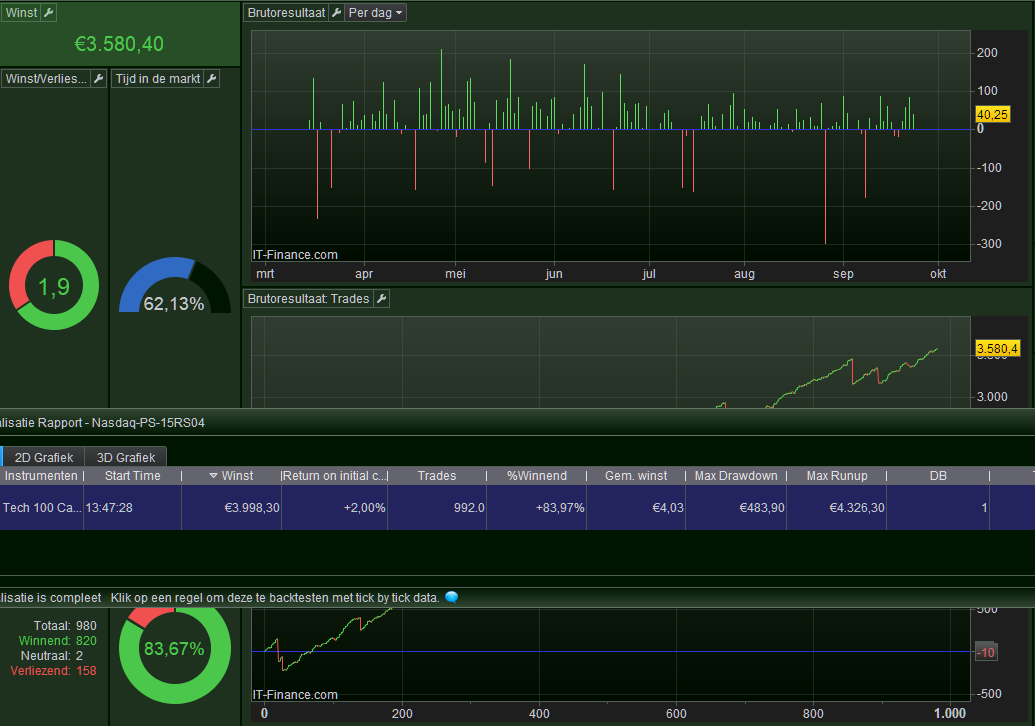
    A hint for others – or possible help – could be that the results in both 1st and 2nd attachments (1st and 2nd example) mighty much look like anomalies in the area of tick by tick mode – especially the 2nd example (people might recognize the erroneous situation in such smooth curves). However, no 0 bar trades (or more than one in-bar trade) occur anywhere and the tick by tick mode situations (max 2 and 3 respectively) are too low anyway for the influence of often dozens of trades of difference between two situations which should be the same. And otherwise I explicitly created the curves like this.  The curve from the 2nd example just does not comply towards the end, so it could be there where things go wrong and that *that* is the wrong curve (and the other one the correct one).

    If nobody has ideas, I will use this topic to link to in a ticket from PRT Support (starting with a Technical Report).
    Thanks …

    #201307

    Nice … after creating the text below (something like 15 minutes) I appeared to be logged out. I saved the text in advance of posting, but the attachments have gone.
    I am not going to do all again, and only the mentioned 2nd attachment I recreated (is now the first) and the mentioned 4th attachment I re-created now in attachment 2.


    So without doing anything half of the day, I just re-ran the last backtest from this morning. This is the version you see at 17:03:01. (edit : see in the 2nd attachment).  It shows the high gain/result, but the statistics shows the low gain/result (you will trust me).

    Then I copied the code from another saved source into the editor (really the same), run a backtest of that (PRT Strategy name remains the same), I run the backtest and the result you see on 17:06:18. It is the low result again, but clicking on the line shows the high result. Of course you will trust me. Because :

    I then do ctrl-z in the Editor (this restores the original code which is the same anyway), and the result of that you see on 17:10:14. This is the low result again. And now : wonder oh wonder, clicking that result line shows the statistics form consistently.

    Next, doing ctrl-y in the Editor (forwards to the previous code again), a. shows the same result in the result window (the lower gain) and b. it also shows that consistently in the statistics form. This is virtually the situation that I am suddenly stuck in the “lower gain” result, not knowing whether it is good or bad.
    And all the time I changed no-thing.

    Then I noticed that the end of the code contains an empty line, vs no empty line in the other version. So I removed that line (line 1542, see 2nd attachment – edit : 1st attachment) and the result list shows the low gain, but now the statistics form shows the high gain again (see 3rd attachment – edit : attachment got lost). I then manually added that empty line again (thus no ctrl-whatever or copy code) and … the result now shows the high gain and

    AND ???

    Both the result list and the statistics form show the high gain (see 4th attachment – edit : now 2nd).

    Summarized : this isolated situation fairly much shows that things are quite bananas in there. Now please notice that the very same happens when parameters are changed and the results *will* be different but still sauced by this happening. You thus never know whether the change of a parameter (or the descending gain in the result list for that matter), does what it supposes to do. All what this “mess” apparently requires is the handing over of a different (a changed) code. I think I proved that with the ctrl-z, ctrl-y, ctrl-z examples, but also by explicitly removing and adding an empty line.
    Nothing of this happened prior to the July 25 version, although I must be careful with that conclusion, because today we can *see* it (in the multi result list) while previously you’d needed to maintain screen copies or something.

    #201310

    In the end it is just doing what it likes;

    Each time prior to a backtest I now remove the results window.
    I click on Probacktest (btw, see below attachment for that) and it seems to cycle through all the result-window and statistics form possibilities (which are 4 for the example at hand (see previous posts)). So if we’d have result A and B and statistics form A and B then it does this (I checked this one time only) :

    A with B
    B with B
    B with A
    A with A

    So for 50% of times it is consistent, but there are still two results (A and B).

    #201333

    If I click any of the rows shown in attached, my Detailed Report shows the same result as in the Table. (To use on example … Gain of 457.30 in the Table gives me Gain of 457.30 in the Detailed Report.)

    My equity curve also changes, but also shows and takes account of the open trade at the end of the equity curve.

    You don’t get above (correct action etc) so how is above different from what you are doing?

    #201336

    Thank you GraHal. Yeah, if I only knew that. That’s why I waited quite long before reporting it. So I am alone on this one.

    #201337

    Are you using the same number of bars for all your optimisations in your Tables you show in OP?

    If for example, you optimise on 10K bars and then change to 100K bars then you will get a different result in the Detailed Report (and equity curve) than the result you just clicked on in the optimisation Table.

    #201338

    The example started out with going from 10K to 200K bars, but in the end (latest post) this appeared not related at all because subsequently pressing “backtest” (after removing the result window each time) already gives different results. The A-A, A-B, B-A, B-B thing.
    So in this A-B example (post), I never click anything because there is a. one result only and b. the result window is not there in advance. Thus, the Statistics form is now shown automatically, in 4 different (result) versions.

    🙁

    #201342

    I now remove the results window.

    Another way of saying above is … I now remove the results table … yes?

    I am just tryng to understand and simulate what you are doing?

    #201343

    Correct.

    #201344

    A. Restart PRT.
    B. Select 200K bars (nothing ran automatically).
    C. Select Strategy in Editor.

    1. Start Backtest. Make Screenshot when done and remove result list.
    2. Start Backtest. Make Screenshot when done and remove result list.
    3. Start Backtest. Make Screenshot when done and remove result list.
    4. Start Backtest. Make Screenshot when done (and remove result list).

    Hereafter I will repeat the whole procedure (with more consistent screenshots).

    #201349

    A. Restart PRT.
    B. Select 200K bars (nothing ran automatically).
    C. Select Strategy in Editor.

    1. Start Backtest. Make Screenshot when done and remove result list.
    2. Start Backtest. Make Screenshot when done and remove result list.
    3. Start Backtest. Make Screenshot when done and remove result list.
    4. Start Backtest. Make Screenshot when done and remove result list.


    #201354


    5. Start Backtest. Make Screenshot when done and remove result list.
    6. Start Backtest. Make Screenshot when done and remove result list.
    7. Start Backtest. Make Screenshot when done and remove result list. This one probably failed because the “wait window” for building the Statistic was pressed away because of typing elsewhere (triggering the Stop button). The list should be actual.
    8. Start Backtest. Make Screenshot when done and remove result list.

    Ad 7.:
    You see the idiocy of it, because caused by an anomaly elsewhere I need to redo the backtest, and at doing that the result will be different. See List in #8 vs List in #7.


    #201359

    So there are always two different results in the List (A and B) and there are always two different results in the Statistic (A and B).
    Whether A is shown correlated to itself (A) – the same for B, looks like 50% chance (but I did not really count).

    If one of A or B is correct, there’s 50% chance that this shows in the Statistic. For the List the same.

    What can I do with this ? nothing. I don’t know whether A or B (or neither) is correct.

    #201360

    Are you making the pont that you have to do above in order to be able to achieve meaningful results?

    Have you got an Algo (pick one from the Library?) that we can both do the same actions on and so then we can compare results directly?

    #201361

    Talking to self :

    So I copied the Strategy and on the left is the original, the copy on the right.
    The left shows the low gain results, the right the high gain results (I just backtested the copy until it would show the high gain in the Statistic).

    At the mouse, things start to drift. So a trade starting at August 25, 21:21 is exited at 21:50 for the High, while the low continues and exits at August 26, 0:11.
    The difference in Gain at that point will be marginal, but because of the async in trade entries, all will be different from there on (and a first additional loss of 302.90 is occurring soon).
    At a glance I can see that from of the beginning of September the trades (and gains) are synchronized again, but the damage is mainly done in the 2211 bar trade you see in the left (August 29, 03:30).

    So there is probably only one trade-exit situation which “varies” per backtest, which is funest in itself. How this varies both the result list and the Statistic independently ? must be a very special bug.

Viewing 15 posts - 1 through 15 (of 18 total)

Create your free account now and post your request to benefit from the help of the community
Register or Login