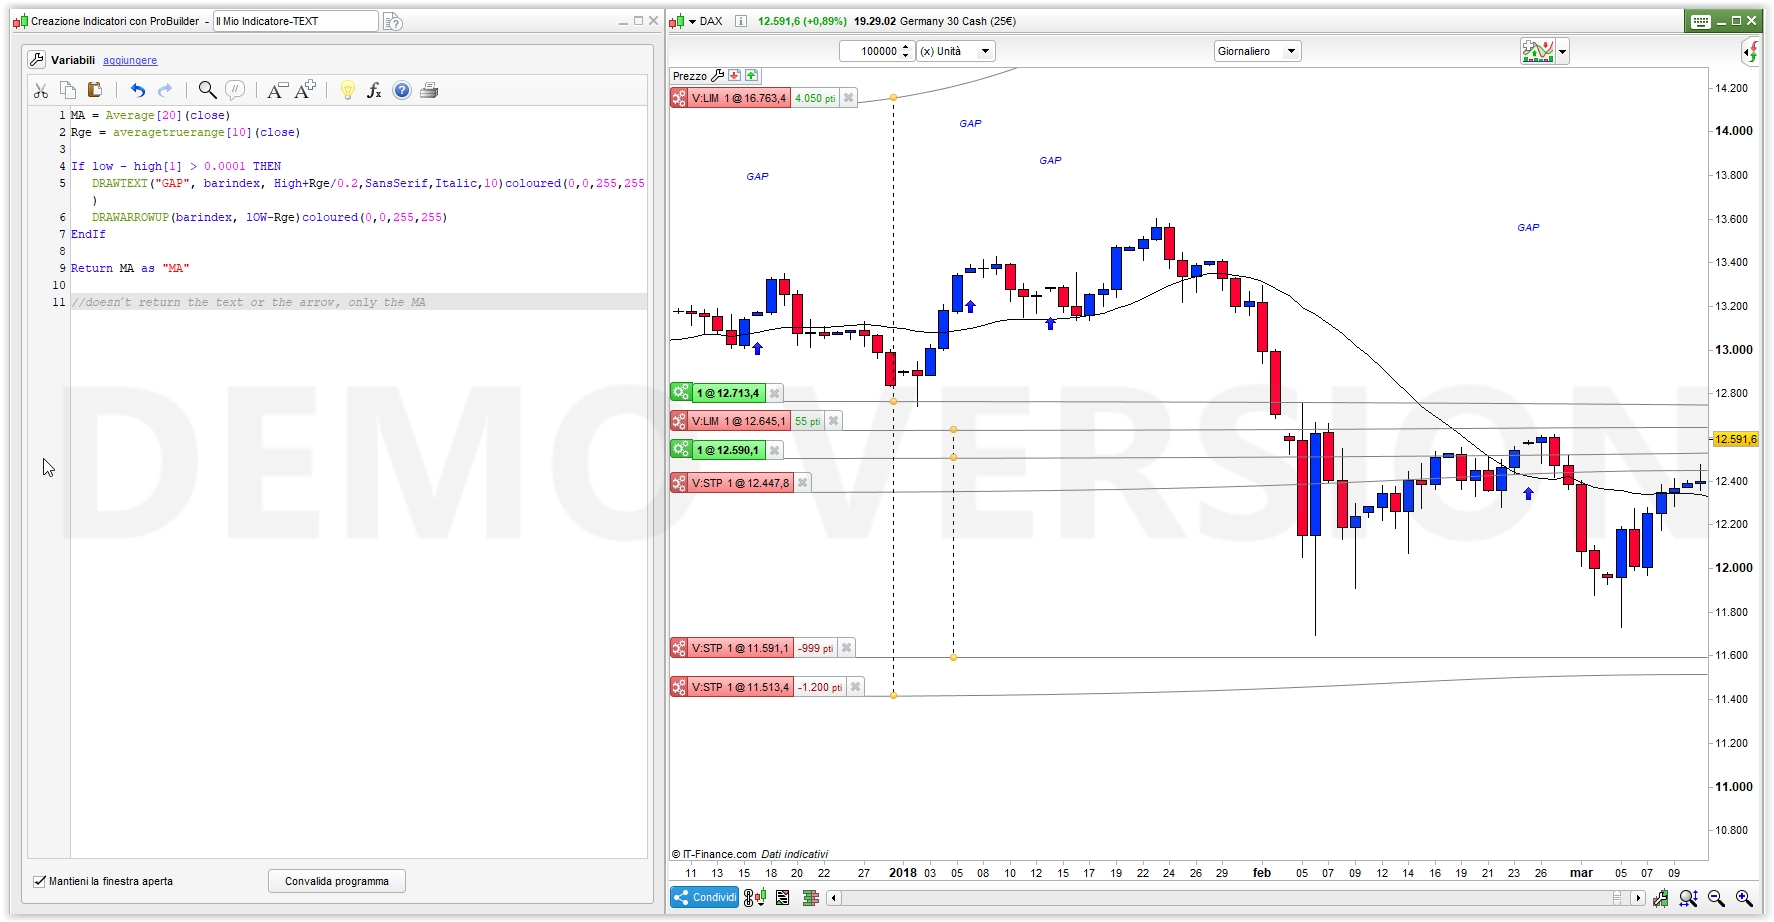
Interesting, here is the full code set showing no text or arrows;
Defparam calculateonlastbars = 800
//Variables:
//Periods = 21
//Deviations = 1.618
//RSITopThreshold = 95
//RSIBottomThreshold = 5
//RSIPeriod = 2
//ADXPeriod = 14
//ADXVal = 20
//MAPeriod = 20
// ELSASTIC WEIGHTED MOVING AVERAGE
PRICE = LOG(customclose)
alpha = 2/(PERIODS+1)
// EWMA (EMA)
if barindex < PERIODS then
EWMA = AVERAGE[3](PRICE)
else
EWMA = alpha * PRICE + (1-alpha)*EWMA
endif
// ELASTIC WEIGHTED STANDARD DEVIATION (ESD)
error = PRICE - EWMA
dev = SQUARE(error)
if barindex < PERIODS+1 then
var = dev
else
var = alpha * dev + (1-alpha) * var
endif
ESD = SQRT(var)
//ZeroLag Data
//lag = ROUND((period-1)/2)
//data = (close + (close-close[lag]))
//ZLEMA = exponentialaverage[period](data)
//BolUp = ZLEMA+STD[period]*dev
//BolDn = ZLEMA-STD[period]*dev
// BANDS
UB = EXP(EWMA + (DEVIATIONS*ESD))
BB = EXP(EWMA - (DEVIATIONS*ESD))
MID = EXP(EWMA)
RSI2 = RSI[RSIPeriod](close)
BollR = UB-BB
BRSI = BB + (BollR*(RSI2*0.01))
BRSIT = BB + (BollR*(RSITopThreshold*0.01))
BRSIB = BB + (BollR*(RSIBottomThreshold*0.01))
//Dev Scaled MA
if barindex < MAPeriod then
DSMA = AVERAGE[3](PRICE)
ElsIf barindex > MAPeriod Then
//Smooth with a Super Smoother
a1 = exp(-1.414*3.14159 / (.5*MAPeriod))
b1 = 2*a1*Cos(1.414*180 / (.5*MAPeriod))
c2 = b1
c3 = -a1*a1
c1 = 1 - c2 - c3
//Produce Nominal zero mean with zeros in the transfer response
//at DC and Nyquist with no spectral distortion
//Nominally whitens the spectrum because of 6 dB per octave
//rolloff
Zeros = Close - Close[2]
//SuperSmoother Filter
Filt = c1*(Zeros + Zeros[1]) / 2 + c2*Filt[1] + c3*Filt[2]
//Compute Standard Deviation
RMS = 0
For count = 0 to MAPeriod - 1 do
RMS = RMS + Filt[count]*Filt[count]
next
RMS = SqRt(RMS / MAPeriod)
//Rescale Filt in terms of Standard Deviations
ScaledFilt = Filt / RMS
alpha1 = Abs(ScaledFilt)*5 / MAPeriod
DSMA = alpha1*Close + (1 - alpha1)*DSMA[1]
endif
//KASE Deviation Stoploss Bands
n = 30
periodFast = 9
periodSlow = 21
DTR = max(max(High - Low[2], abs(High - Close[2])),max(abs(Low - Close[2]),(abs(Low - Close[2]))))
avg = average[n](DTR)
st = std[n](DTR)
maFast = average[periodFast,1](close)
maSlow = average[periodSlow,1](close)
if maFast<maSlow then
WarningLine = typicalprice+avg
Dev1 = typicalprice+avg + st
Dev2 = typicalprice+avg + 2.2*st
Dev3 = typicalprice+avg + 3.6*st
else
WarningLine = typicalprice-avg
Dev1 = typicalprice-avg - st
Dev2 = typicalprice-avg - 2.2*st
Dev3 = typicalprice-avg - 3.6*st
endif
//RSI Divergence
MinBarRange = 3
Rge = averagetruerange[10](close)
MyRSI = rsi[RsiPeriod](Close)
ONCE ShiftText = 3
RsiMax = MyRSI < MyRSI[1] and MyRSI[1] > MyRSI[2] and MyRSI[1] > RSITopThreshold
RsiMin = MyRSI > MyRSI[1] and MyRSI[1] < MyRSI[2] and MyRSI[1] < RSIBottomThreshold
if RsiMax then
RSIMax1 = MyRSI[1]
High1 = High[1]
for I = MinBarRange to 80
if RsiMax[I] then
RSIMax2 = MyRSI[I + 1]
High2 = High[I + 1]
If High1 > High2 and RSIMax1 < RSIMax2 then
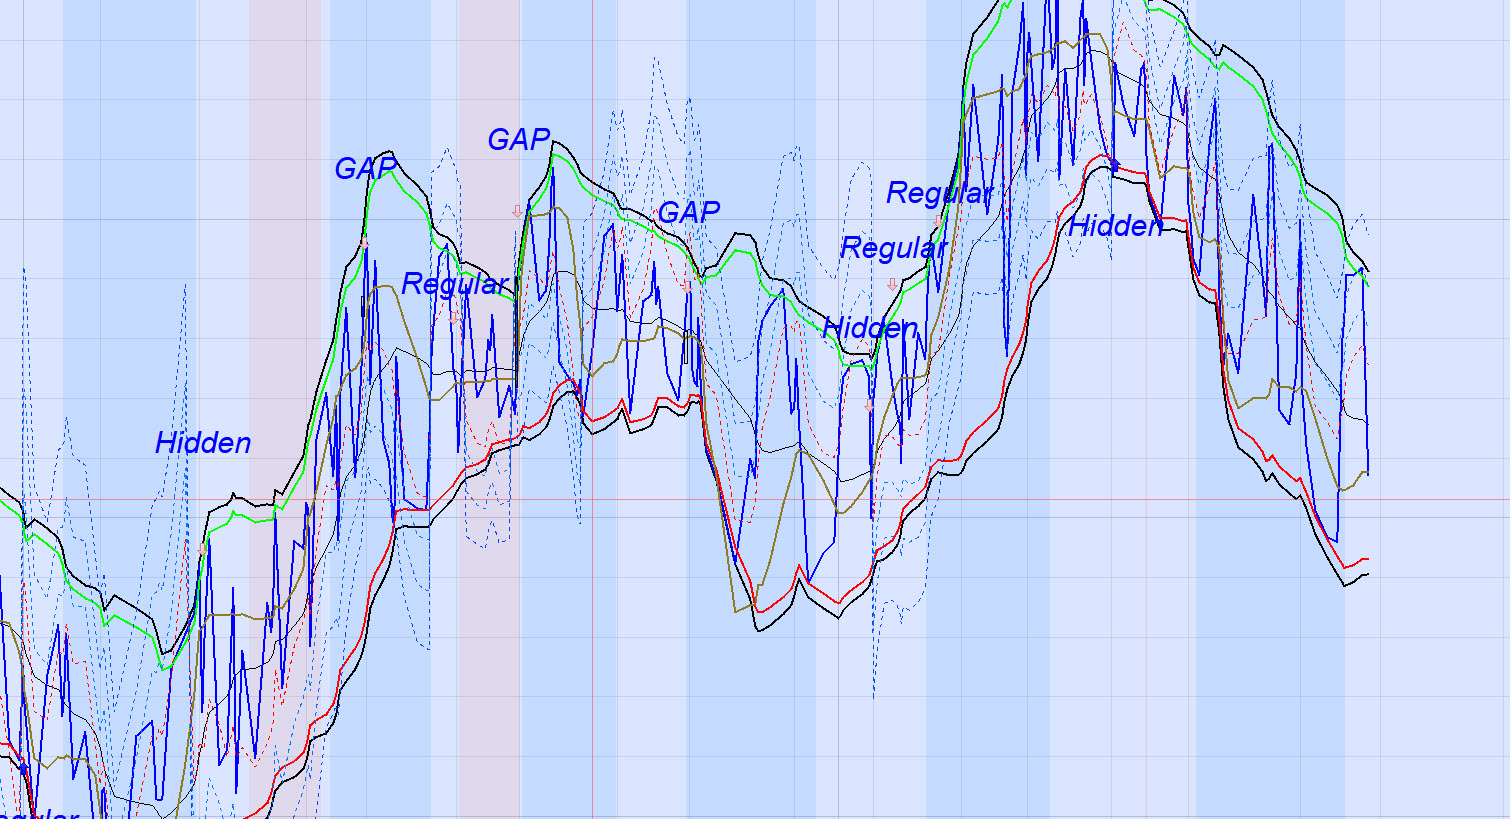
DRAWARROWDOWN(barindex, High + Rge / ShiftText)coloured(255,192,203,255)
DRAWTEXT("Regular", barindex, High + Rge / ShiftText / 0.3,SansSerif,Italic,10)coloured(0,0,255,255)
elsif High1 < High2 and RSIMax1 > RSIMax2 then
DRAWARROWDOWN(barindex, High + Rge / ShiftText)coloured(255,192,203,255)
DRAWTEXT("Hidden", barindex, High + Rge / ShiftText / 0.2,SansSerif,Italic,10)coloured(0,0,255,255)
endif
break
endif
next
endif
if RsiMin then
RSIMin1 = MyRSI[1]
Low1 = Low[1]
for I = MinBarRange to 80
if RSIMin[I] then
RSIMin2 = MyRSI[I + 1]
Low2 = Low[I + 1]
If Low1 < Low2 and RSIMin1 > RSIMin2 then
DRAWARROWUP(barindex, lOW - Rge / ShiftText)coloured(0,0,255,255)
DRAWTEXT("Regular", barindex, lOW - Rge / ShiftText / 0.3,SansSerif,Italic,10)coloured(0,0,255,255)
elsif Low1 > Low2 and RSIMin1 < RSIMin2 then
DRAWARROWUP(barindex, lOW - Rge / ShiftText)coloured(0,0,255,255)
DRAWTEXT("Hidden", barindex, lOW - Rge / ShiftText / 0.2,SansSerif,Italic,10)coloured(0,0,255,255)
endif
break
endif
next
endif
If low - high[1] > 0.0001 THEN
DRAWRECTANGLE(barindex[1],close[1],barindex,low) COLOURED(0,0,0,255)
DRAWARROWDOWN(barindex, High + Rge / ShiftText)coloured(255,192,203,255)
DRAWTEXT("GAP", barindex, High + Rge / ShiftText / 0.2,SansSerif,Italic,10)coloured(0,0,255,255)
ElsIf low[1] - high > 0.0001 THEN
DRAWRECTANGLE(barindex[1],close[1],barindex,high) COLOURED(0,0,0,255)
DRAWARROWUP(barindex, lOW - Rge / ShiftText)coloured(0,0,255,255)
DRAWTEXT("GAP", barindex, lOW - Rge / ShiftText / 0.3,SansSerif,Italic,10)coloured(0,0,255,255)
ENDIF
//ADX ActiveTrend Indicator
//If hour < 9 or hour > 17 Then
//BACKGROUNDCOLOR(0,0,0,0)
If ADX[ADXPeriod] > ADXR[ADXPeriod] and ADX > ADXVal Then
BACKGROUNDCOLOR(0,127,255,25)
ElsIf ADX[ADXPeriod] < ADXR[ADXPeriod] and ADX <= ADXVal Then
BACKGROUNDCOLOR(255,99,71,25)
EndIf
RETURN MID as "EWMA(EMA)", UB style(line,2) as "+ESD", BB style(line,2) as "-ESD", BRSI coloured(0,0,255) style(line,2) as "RSI2", BRSIT coloured(0,255,0) style(line,2) as "95", BRSIB coloured(255,0,0) style(line,2) as "5", DSMA coloured(142,123,38) style(line,2) AS "Dev MA", Warningline coloured(255,0,0) style(dottedline,1) as "WarningLine", Dev1 coloured(2, 118, 253) style(dottedline,1) as "DevStop1", Dev2 coloured(20, 100, 244) style(dottedline,1) as "DevStop2", Dev3 coloured(1, 71, 250) style(dottedline,1) as "DevStop3"