Hello,
I wish to have a Trend indicator based on “higher high (HH) / higher low (HL) and lower low (LL) / lower high (LH)” system.
The rules would be the following :
- Trend UP (+1) : HH and HL alternating
- Trend Down (-1) : LH and LL alternating
- Neutral State (0) : when both are mixing up.
I guess that “Fractal ZigZag” would be a great help as I’m also considering to implement this in a ProBuilder strat besides my manual trading.
As per Nicolas comment this zigzag suits well for automatic purposes .
Fractals ZigZag
Yet I can’t figure out how to make that rule check
I would greatly appreciate your help on this matter as it overpasses my PRT knowledges . Thanks for any hint ot help on this.
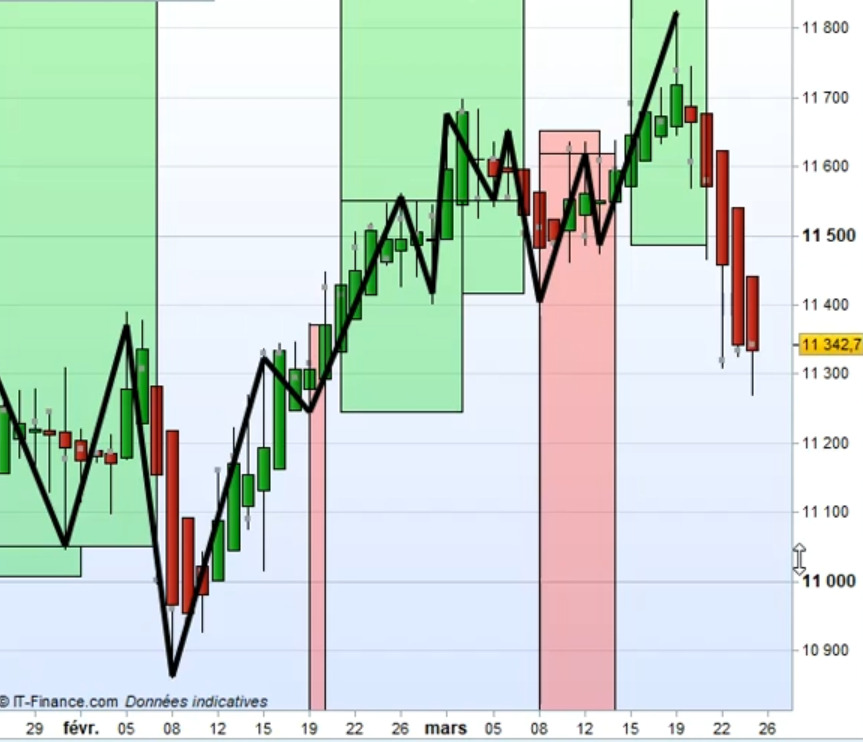
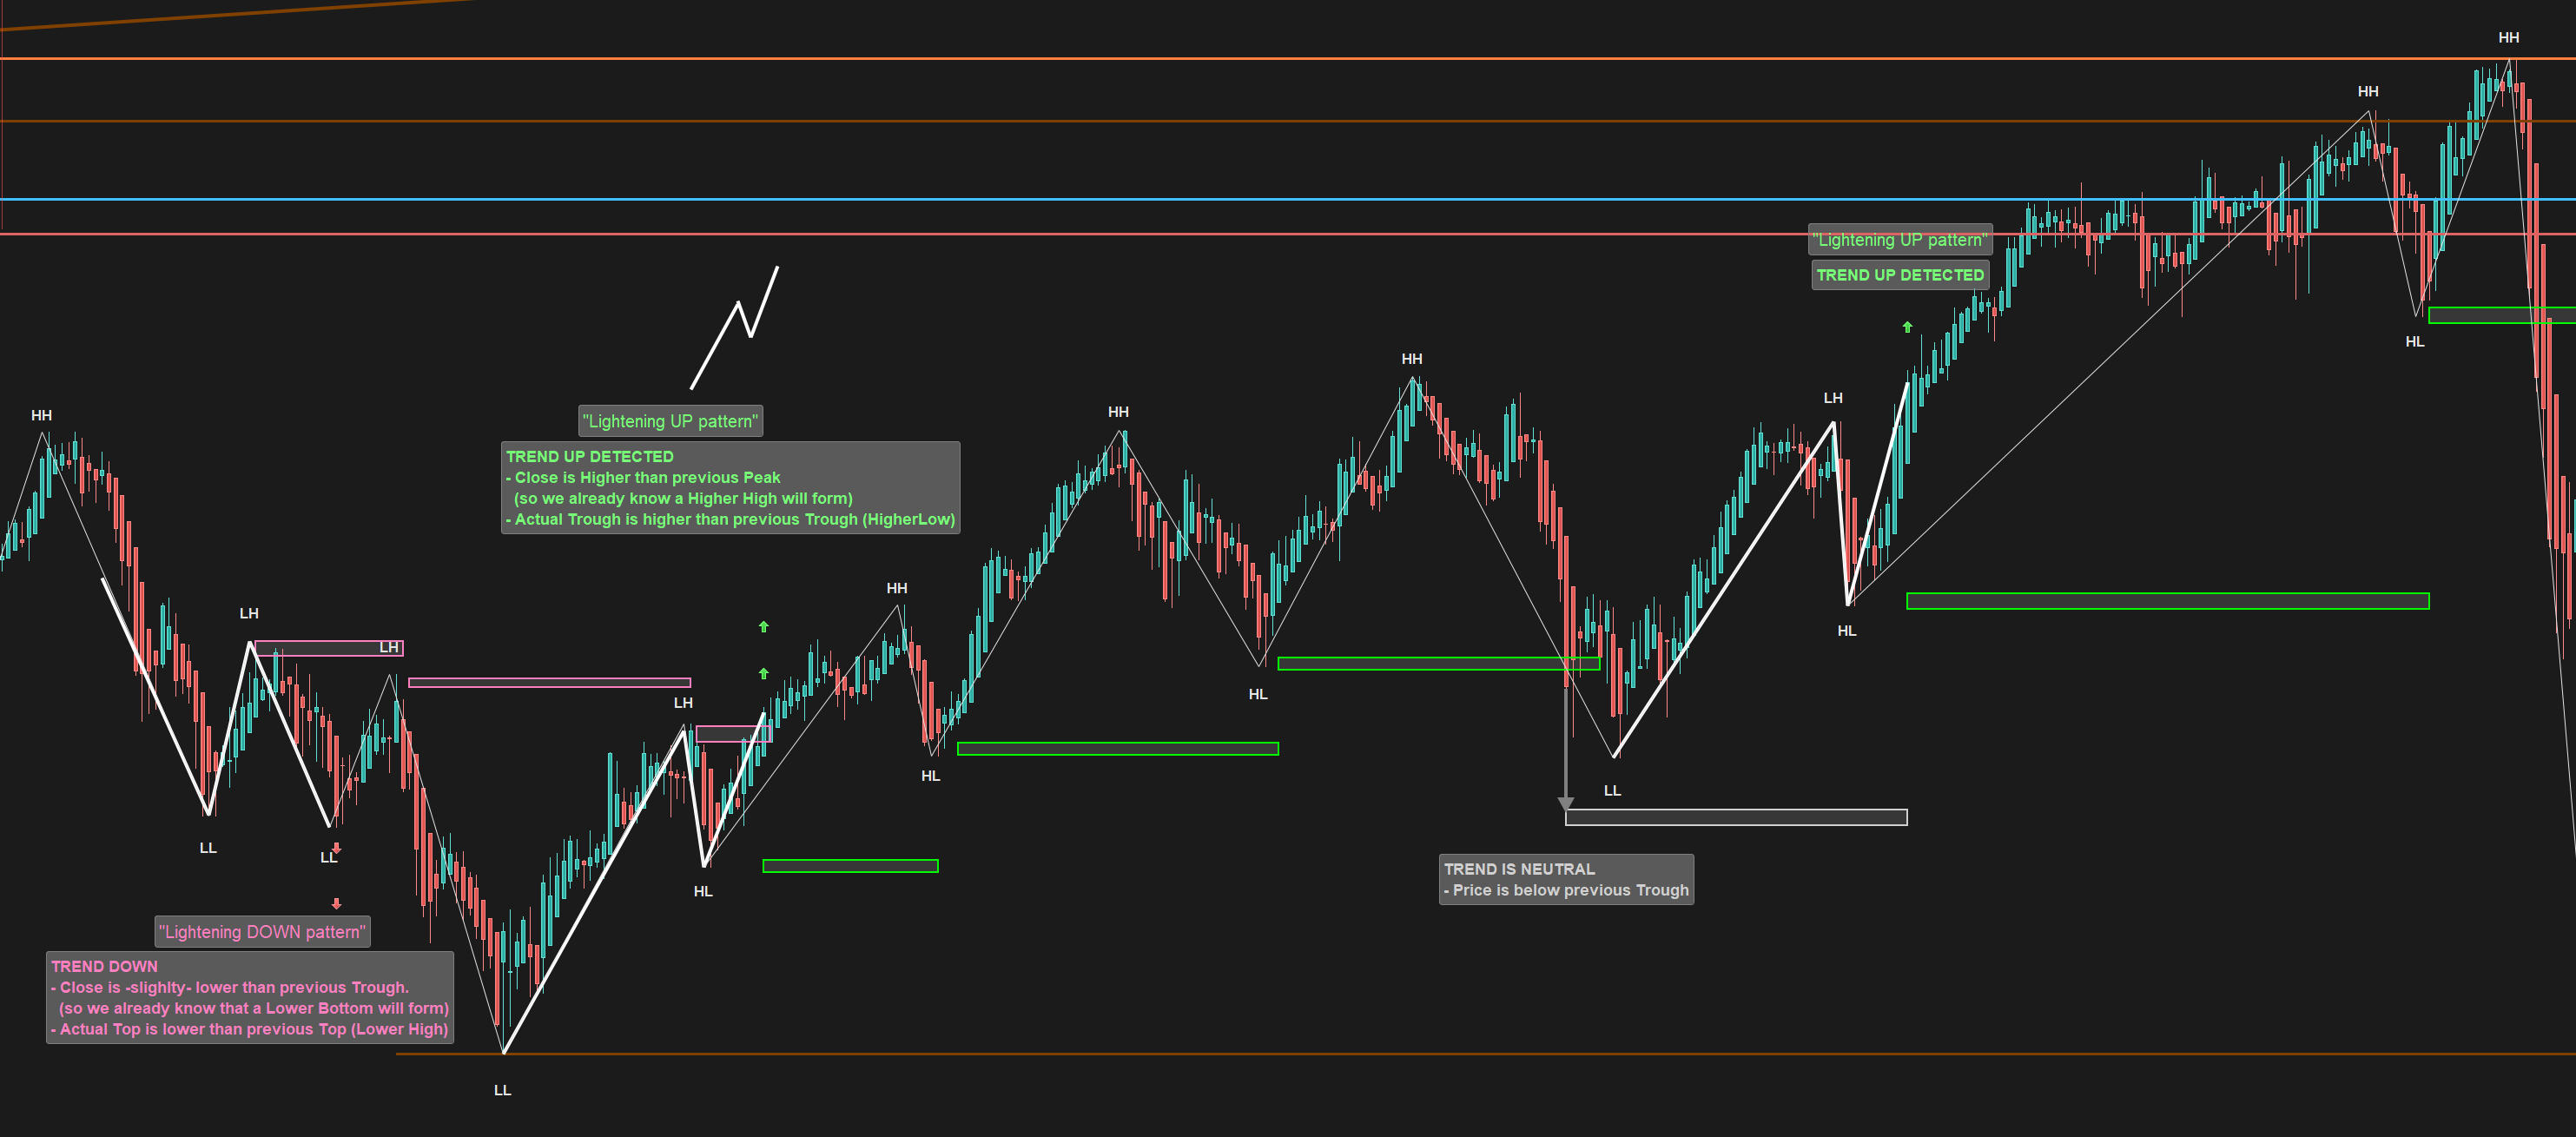
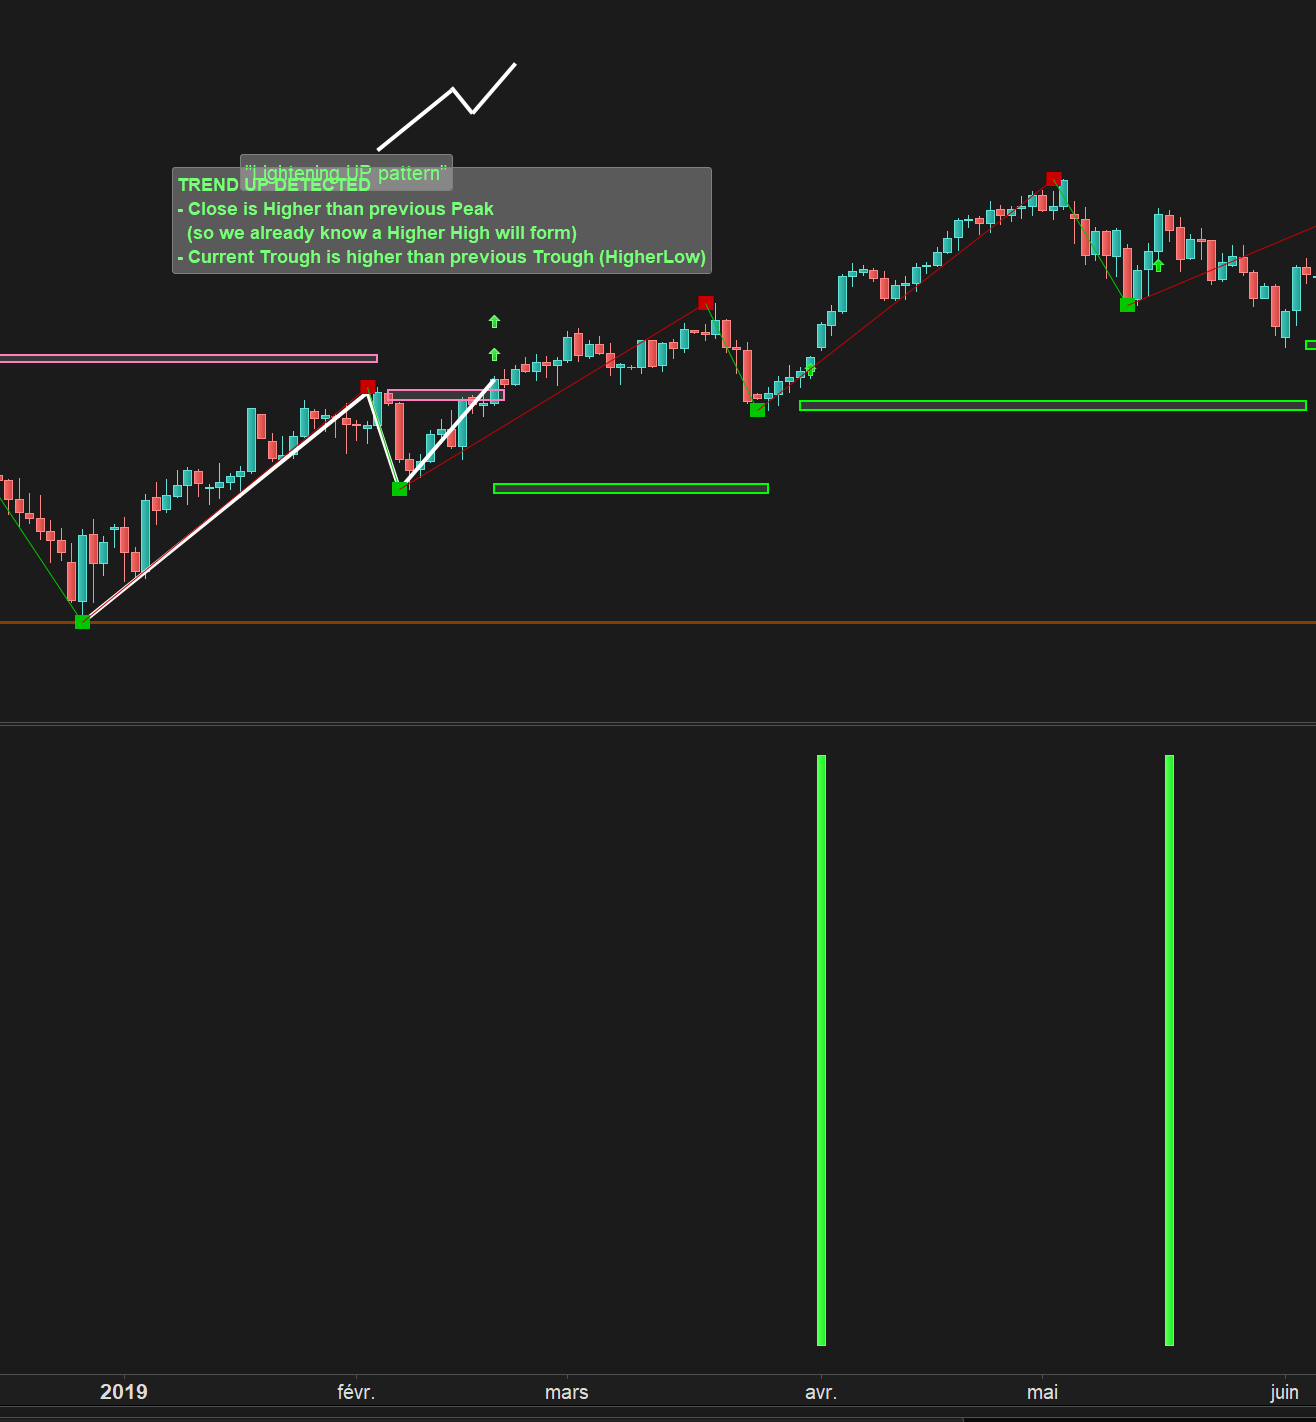
Illustration picture attached. The goal is only to have a barchart indicator (1/0/-1), boxes are just a visual help not mandatory.
Hello,
- Sorry for not posting any code snipet but at this point I’m really struggling and all are failing to achieve what I want…
- Please find the below picture on Dax Cash Daily View so it can be easier to understand.
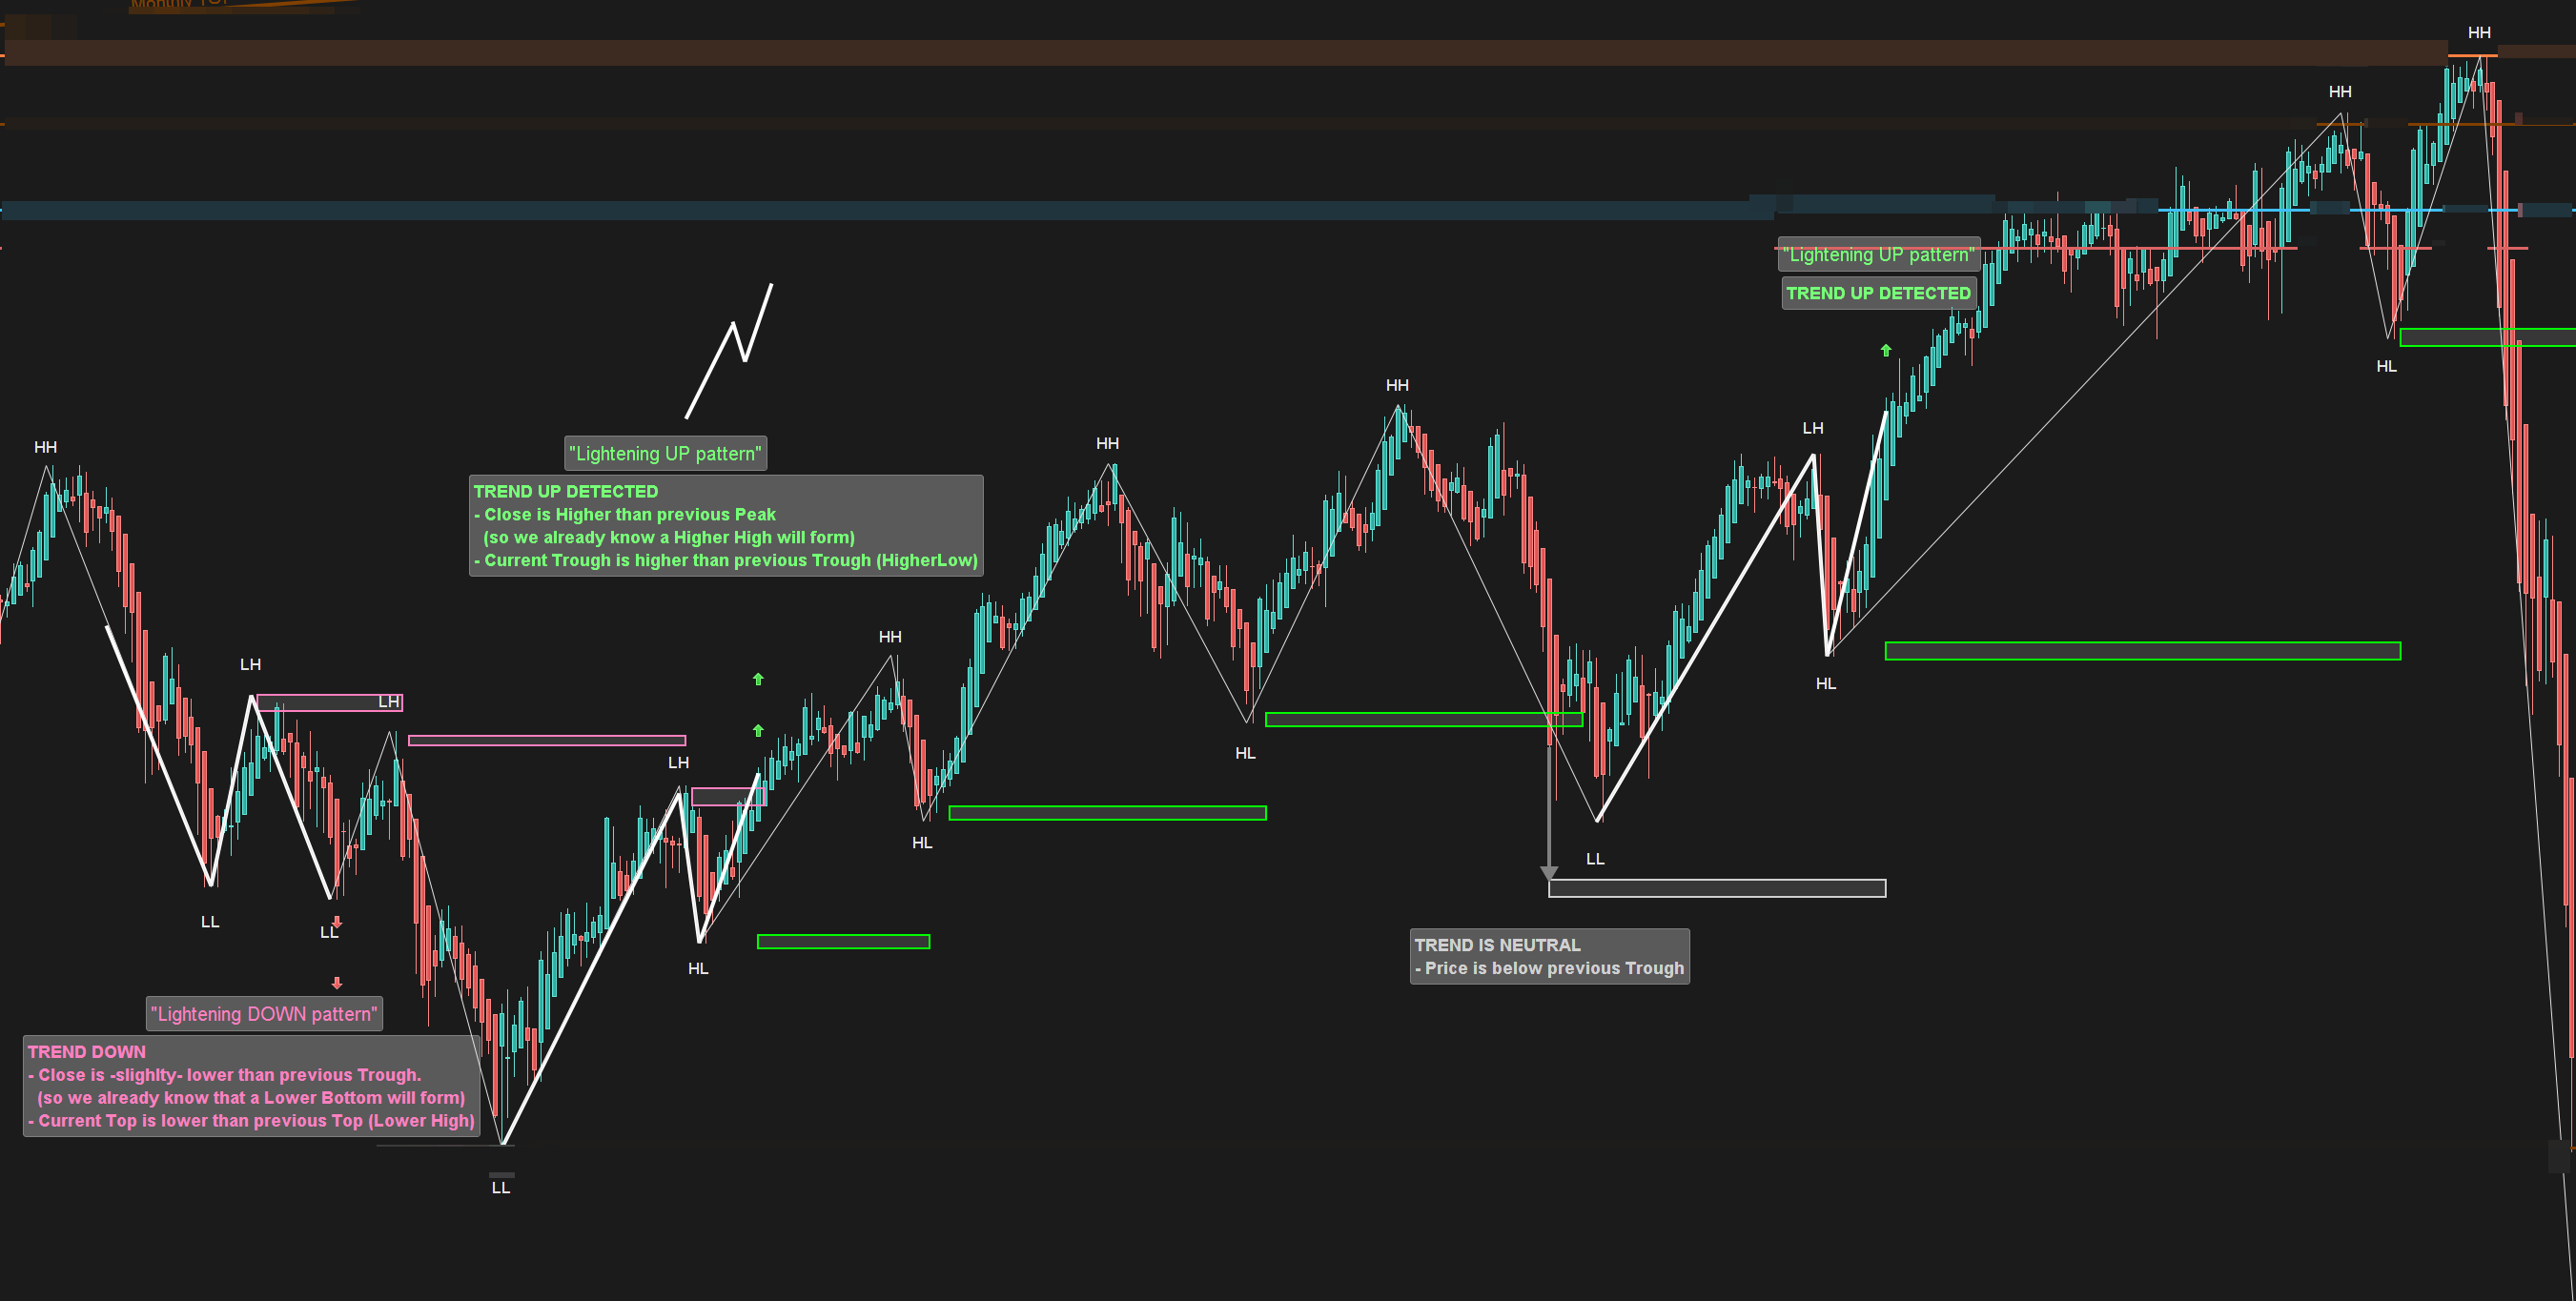
Don’t pay attention to color trendlines at the very top.
You can notice the code drawing HHHL / LHLL behind
(Wich isnt suited for ProOrder as per my understanding but it helps to make things clearer on chart)
Kind regards
Fixed a small typos + blurred out useless trendlines on this screenshot :
Thanks
The code for this latter indicator is zigzag based and therefore not available to execute an automatic trading strategy under ProOrder. What you are looking for is neither more nor less than a fractal breakout (high / low points), with the condition of bullish or bearish waves, as you describe in your first post.
- No worries, as said the zigzag code was here only for visual purpose. My attempts are based on Fractal “zigzag
My snippet for TrendUp at line 44. Doesnt seem to be close form what I want from the screenshot above.
Would you mind hinting more on this ?
defparam calculateonlastbars=10000
//cp = 3

once lastpoint = 0

if high[cp] >= highest[2*cp+1](high) then
PEAK = 1
else
PEAK = 0
endif

if low[cp] <= lowest[2*cp+1](low)  then
TROUGH = -1
else
TROUGH = 0
endif

if PEAK = 1 then
TOPy = high[cp]
TOPx = barindex[cp]
endif

if TROUGH = -1 then
BOTy = low[cp]
BOTx = barindex[cp]
endif

if PEAK>0 and (lastpoint=-1 or lastpoint=0) then
DRAWSEGMENT(lastX,lastY,TOPx,TOPy) COLOURED(200,0,0,255)
DRAWTEXT("■",TOPx,TOPy,Dialog,Bold,20) coloured(200,0,0,255)
lastpoint = 1
lastX = TOPx
lastY = TOPy
endif

if TROUGH<0 and (lastpoint=1 or lastpoint=0) then
DRAWSEGMENT(lastX,lastY,BOTx,BOTy) COLOURED(0,200,0,255)
DRAWTEXT("■",BOTx,BOTy,Dialog,Bold,20) coloured(0,200,0,255)
lastpoint = -1
lastX = BOTx
lastY = BOTy
endif

//TREND ATTEMPT
if TOPy > TOPy[1] or Close > TOPy[1] then
trendup = 1
else
trendup = 0
endif


RETURN TOPy as "TOPy", BOTY as "BOTy", trendup as "trendup"
In the below version of the code, I add an arrow when a new trend is detected (the new fractal top is higher than the last one). It only marks with an arrow the start of the new trend.
defparam calculateonlastbars=10000
cp = 3

once lastpoint = 0

if high[cp] >= highest[2*cp+1](high) then
PEAK = 1
else
PEAK = 0
endif

if low[cp] <= lowest[2*cp+1](low)  then
TROUGH = -1
else
TROUGH = 0
endif

if PEAK = 1 then
TOPy = high[cp]
TOPx = barindex[cp]
endif

if TROUGH = -1 then
BOTy = low[cp]
BOTx = barindex[cp]
endif

if PEAK>0 and (lastpoint=-1 or lastpoint=0) then
DRAWSEGMENT(lastX,lastY,TOPx,TOPy) COLOURED(200,0,0,255)
DRAWTEXT("■",TOPx,TOPy,Dialog,Bold,20) coloured(200,0,0,255)
lastpoint = 1
lastX = TOPx
lastY = TOPy
endif

if TROUGH<0 and (lastpoint=1 or lastpoint=0) then
DRAWSEGMENT(lastX,lastY,BOTx,BOTy) COLOURED(0,200,0,255)
DRAWTEXT("■",BOTx,BOTy,Dialog,Bold,20) coloured(0,200,0,255)
lastpoint = -1
lastX = BOTx
lastY = BOTy
endif

//TREND ATTEMPT
atr=AverageTrueRange[14](close)
if TOPy > TOPy[1] and topy<>lasttop then
drawarrowup(barindex,low-atr/2) coloured(0,200,0)
lasttop=topy
trendup = 1
else
trendup = 0
endif


RETURN TOPy as "TOPy", BOTY as "BOTy", trendup as "trendup"
Thanks Nicolas
see attached “late_signal” compared to my “lightening pattern”.
I tried to include the condition when Daily candle close higher than previous TOPy (wich make the Close the new potential higher high) :
cp = 10

//TREND UP ATTEMPT
atr=AverageTrueRange[14](close)
if (TOPy > TOPy[1] and topy<>lasttop) OR (Close > TOPy[1] )then
drawarrowup(barindex,low-atr/2) coloured(0,200,0)
lasttop=topy
trendup = 1
else
trendup = 0
endif
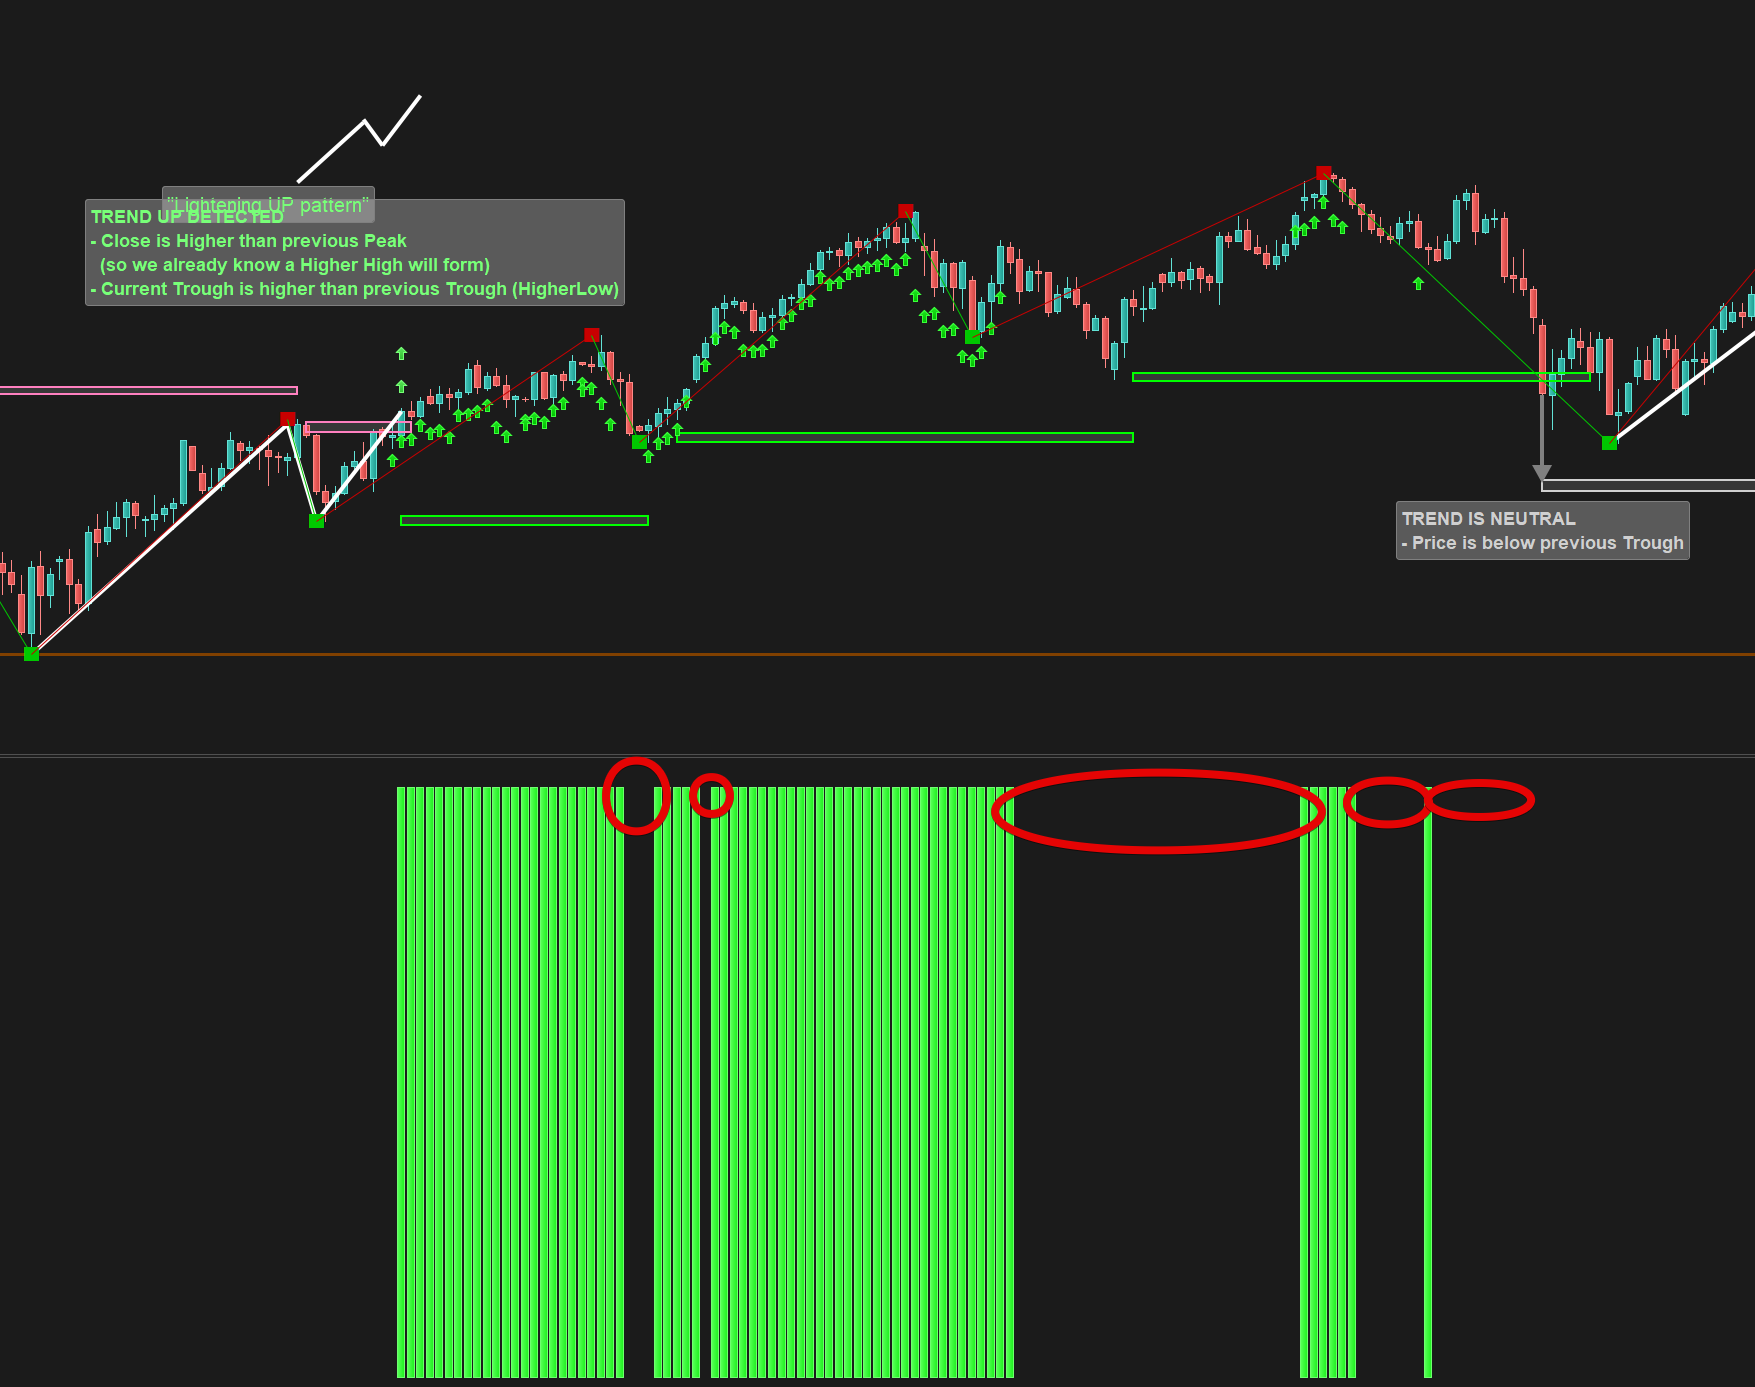
Results on the second screenshot. Which looks closer to my expectation. Yet there is some unknown “glory holes” cutting the trend besides the fact that there is HH and HL from the Fractal PoV.
thanks
Your version is good, the holes are there because a new topy is detected and your close is not above the previous one anymore.
BTW you are not testing higher lows in your condition.
Sorry but I’m seriously confused in these fractals code to achieve what seems to be simple…
My TrendUP conditions should be the following :
- (Close > Latest Peak) AND ( Latest Trough > Previous Trough)
- OR
- (Close > Latest Trough) AND ( Latest Trough > Previous Trough)
Can you correct me if I’m wrong in the translation into code :
- (Close > TOPy ) AND ( BOTx > BOTx[1])
- OR
- (Close > BOTx ) AND (BOTx > BOTx[1])
Thanks
x = barindex and y = price , so ( Latest Trough > Previous Trough) , should be coded like this:
( BOTy > BOTy[1])
But, keep in mind that this condition will only work once, on the first bar when the new fractal low will be detected and not afterward..
What seems to be a “neither more nor less than a fractal breakout” is still far away from running properly 🙂
//TREND UP ATTEMPT
atr=AverageTrueRange[14](close)
//if ( TOPy > TOPy[1] and topy<>lasttop) OR (Close > TOPy[1]) OR (Close > lastY)then

if (Close > TOPx  AND  BOTy > BOTy[1])
drawarrowup(barindex,low-atr*2) coloured(0,200,0)

//lasttop=topy

trendup = 1
else
trendup = 0
endif
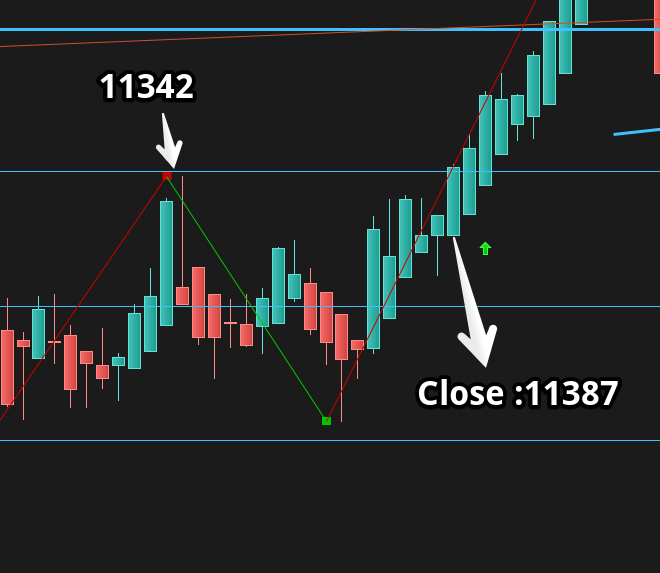
Test of first condition alone : if (Close > TOPy AND BOTy > BOTy[1])
Screenshot attached.
-> The arrow ( under Close of May 27) is 2 candles late.
25 of May 2020 ‘s CLose was 11387 wich is higher than 11342 So the arrow should had start at this date.
And the result is exactly the same for the second condition (arrown drawn starting of 27 May 2020)
//TREND UP ATTEMPT
atr=AverageTrueRange[14](close)
//if ( TOPy > TOPy[1] and topy<>lasttop) OR (Close > TOPy[1]) OR (Close > lastY)then

if(Close > BOTx AND BOTy > BOTy[1]) then
drawarrowup(barindex,low-atr*2) coloured(0,200,0)
//lasttop=topy
trendup = 1
else
trendup = 0
endif
“But, keep in mind that this condition will only work once, on the first bar when the new fractal low will be detected and not afterward..”
As stated in the first message, this is supposed to be a Trend 1/0/-1 indicator so the signal must be alive as long at the conditions are valids. Are we okay to deal like this as per the code above ? Otherwise it’s an issue.
Thanks for your help, wish we can sort this out so it can assist my manual trading and work on the automatic later. I will share my tought on that.
Ok sorry, i will take some time to restart it from scratch and deliver you a fully functional code. Please be patient.
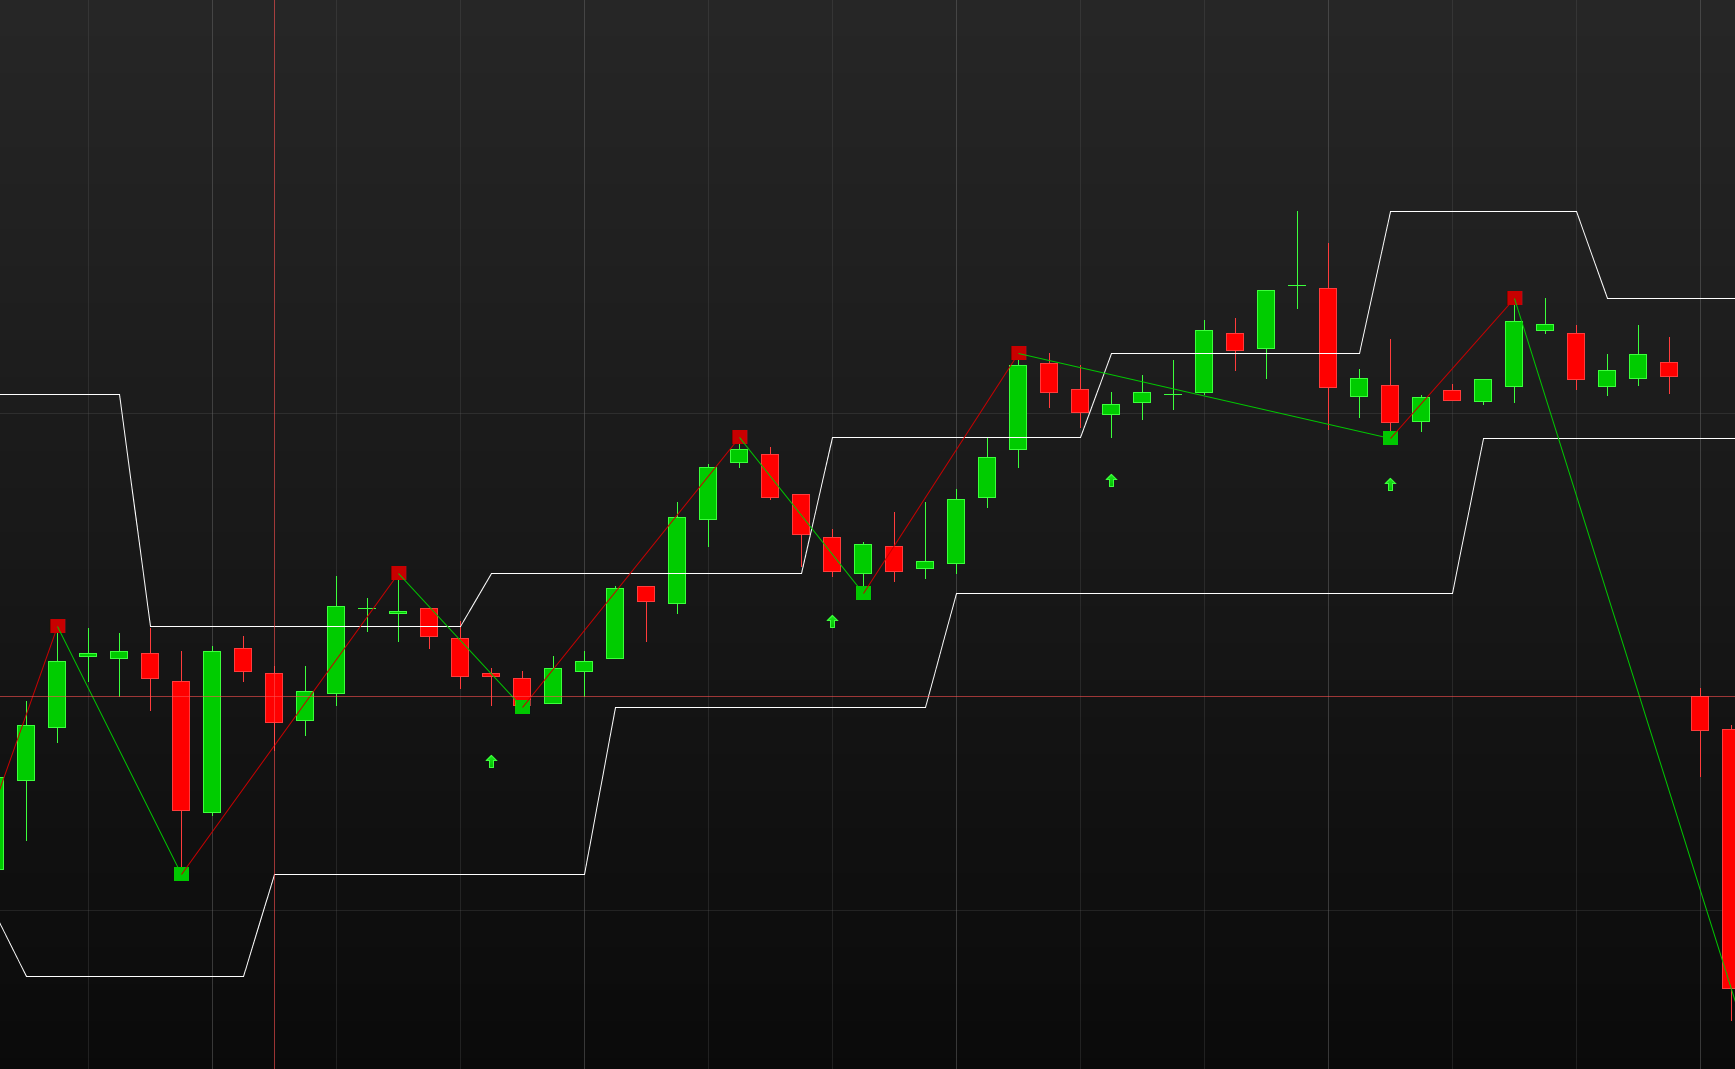
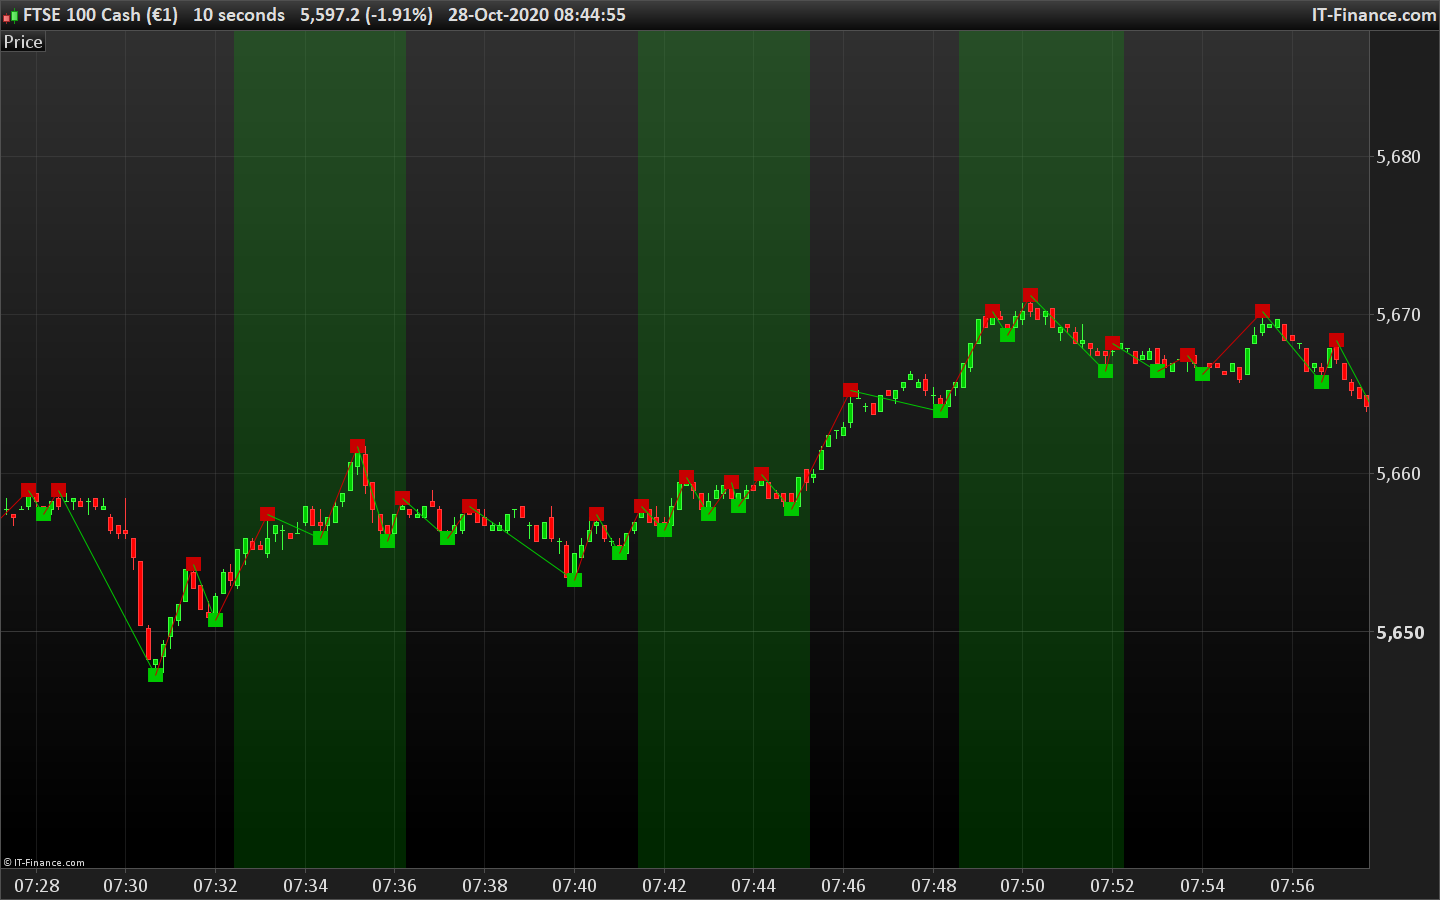
So here is new attempt. I mark the bullish trend (trendup variable) with a dark green background on the price chart. I don’t know how the trend is ending, so I reset it on the first trough lower than the previous one.
defparam calculateonlastbars=3000
cp = 3

once lastpoint = 0

if high[cp] >= highest[2*cp+1](high) then
PEAK = 1
else
PEAK = 0
endif

if low[cp] <= lowest[2*cp+1](low)  then
TROUGH = 1
else
TROUGH = 0
endif

if PEAK then
//prevtop = topy
TOPy = high[cp]
TOPx = barindex[cp]
endif

if TROUGH then
prevbot = boty
BOTy = low[cp]
BOTx = barindex[cp]
endif

if PEAK and (lastpoint=-1 or lastpoint=0) then
DRAWSEGMENT(lastX,lastY,TOPx,TOPy) COLOURED(200,0,0,255)
DRAWTEXT("■",TOPx,TOPy,Dialog,Bold,20) coloured(200,0,0,255)
lastpoint = 1
lastX = TOPx
lastY = TOPy
endif

if TROUGH and (lastpoint=1 or lastpoint=0) then
DRAWSEGMENT(lastX,lastY,BOTx,BOTy) COLOURED(0,200,0,255)
DRAWTEXT("■",BOTx,BOTy,Dialog,Bold,20) coloured(0,200,0,255)
lastpoint = -1
lastX = BOTx
lastY = BOTy
endif

//TREND ATTEMPT
//bullish trend is starting
if boty>prevbot and close>topy and lasty<>lasty[1] and not trendup then
trendup = 1
endif
//bullish trend is ending
if trough and boty<prevbot and lasty<>lasty[1] and trendup then
trendup=0
endif
//trend is up, coloring the background!
if trendup then
backgroundcolor(0,200,0,50)
endif

RETURN //TOPy as "TOPy", BOTY as "BOTy", trendup as "trendup"
Seems perfect Nicolas 🙂
Thanks a lot
Below, fixed snipet for my personnal ending trend condition.
+ bearish trend
For trading purpose : In case of a trend up for example, please note that if the trend break on the indicator BUT the price come back 2/3 days after above the break line (wich is the previous higher low), it can be considered as a continuation in the trend up. This is pure discretionary, depending on the asset traded.
// 1 bullish trend is starting
if boty>prevbot and close>topy and lasty<>lasty[1] and not trendup then
trendup = 1
endif
// 1.1 bullish trend is ending
if Close < boty then
trendup=0
endif

// 2 bearish trend is starting
if topy<prevtop and close<boty and lasty<>lasty[1] and not trenddown then
trenddown = 1
endif
// 2.1 bearish trend is ending
if Close > topy then
trenddown=0
endif
Nice! Would you mind posting the complete code please? For future reference and for other users that might be interested! 🙂