Bonjour,
Voici ci-dessous l’indicateur Moving avg trend sniper que j’utilise pour trader.
//-----------------------------------------//
//PRC_Moving Avg Trend Sniper
//version = 0
//19.05.2025
//Iván González @ www.prorealcode.com
//Sharing ProRealTime knowledge
//-----------------------------------------//
// === PARAMETERS ===
//-----------------------------------------//
//length = 30 // main smoothing length
wildersPeriod = length * 4 - 1
atrPeriod = length
//atrMult = 0.5 // multiplier for upper/lower ATR band
//-----------------------------------------//
// === CUSTOM EMA FUNCTION ===
//-----------------------------------------//

ONCE atrema = 0
ONCE count = 0

IF barindex <= 1 THEN
atrema = 0
count = 0
ELSE
count = count + 1
atrema = (1 - 2 / (count + 1)) * atrema + 2 / (count + 1) * tr
ENDIF
//-----------------------------------------//
// === TRA() FUNCTION ===
//-----------------------------------------//

atrLocal = atrema
slope = (close - close[10]) / (atrLocal * 10)
angle = ATAN(slope)

IF angle > 0 THEN
source = average[2](high)
ELSE
source = average[2](low)
ENDIF
//-----------------------------------------//
// === CHEBYSHEV-LIKE ADAPTIVE SMOOTHING ===
//-----------------------------------------//
// Applies smoothing only when barindex is sufficient
IF barindex <= length THEN
smooth = close
ELSE
highChange = (HIGHEST[length](high) - HIGHEST[length+1](high)) <> 0
lowChange = (LOWEST[length+1](low) - LOWEST[length](low)) <> 0
boolImpulse = highChange OR lowChange
timeConstant = POW(AVERAGE[length](boolImpulse), 2)
smooth = smooth + timeConstant * (source - smooth)
ENDIF
//-----------------------------------------//
// === MODIFIED ATR CALCULATION ===
//-----------------------------------------//
atr = ABS(smooth[1] - smooth)
maAtr = average[wildersPeriod,1](atr)
deltaATR = average[wildersPeriod](maAtr) * length * 0.4
//-----------------------------------------//
// === MATS CALCULATION ===
//-----------------------------------------//
// Adaptive moving average trend filter with direction-sensitive filtering
ONCE mats = smooth
IF smooth > mats[1] THEN
IF smooth - deltaATR < mats[1] THEN
mats = mats[1]
ELSE
mats = smooth - deltaATR
ENDIF
ELSE
IF smooth + deltaATR > mats[1] THEN
mats = mats[1]
ELSE
mats = smooth + deltaATR
ENDIF
ENDIF
//-----------------------------------------//
// === ATR-BASED ENVELOPE BANDS ===
//-----------------------------------------//
atr10 = atrema / 2
maxBand = mats + atr10 * atrMult
minBand = mats - atr10 * atrMult
//-----------------------------------------//
// === DYNAMIC COLORING BASED ON TREND DIRECTION ===
//-----------------------------------------//
IF AVERAGE[2](close) > mats THEN
r = 0
g = 0
b = 255
ELSE
r = 255
g = 0
b = 255
ENDIF
// Shaded background between bands
colorbetween(maxBand, minBand, r, g, b, 30)
//-----------------------------------------//
RETURN mats COLOURED(r, g, b) STYLE(line, 3)
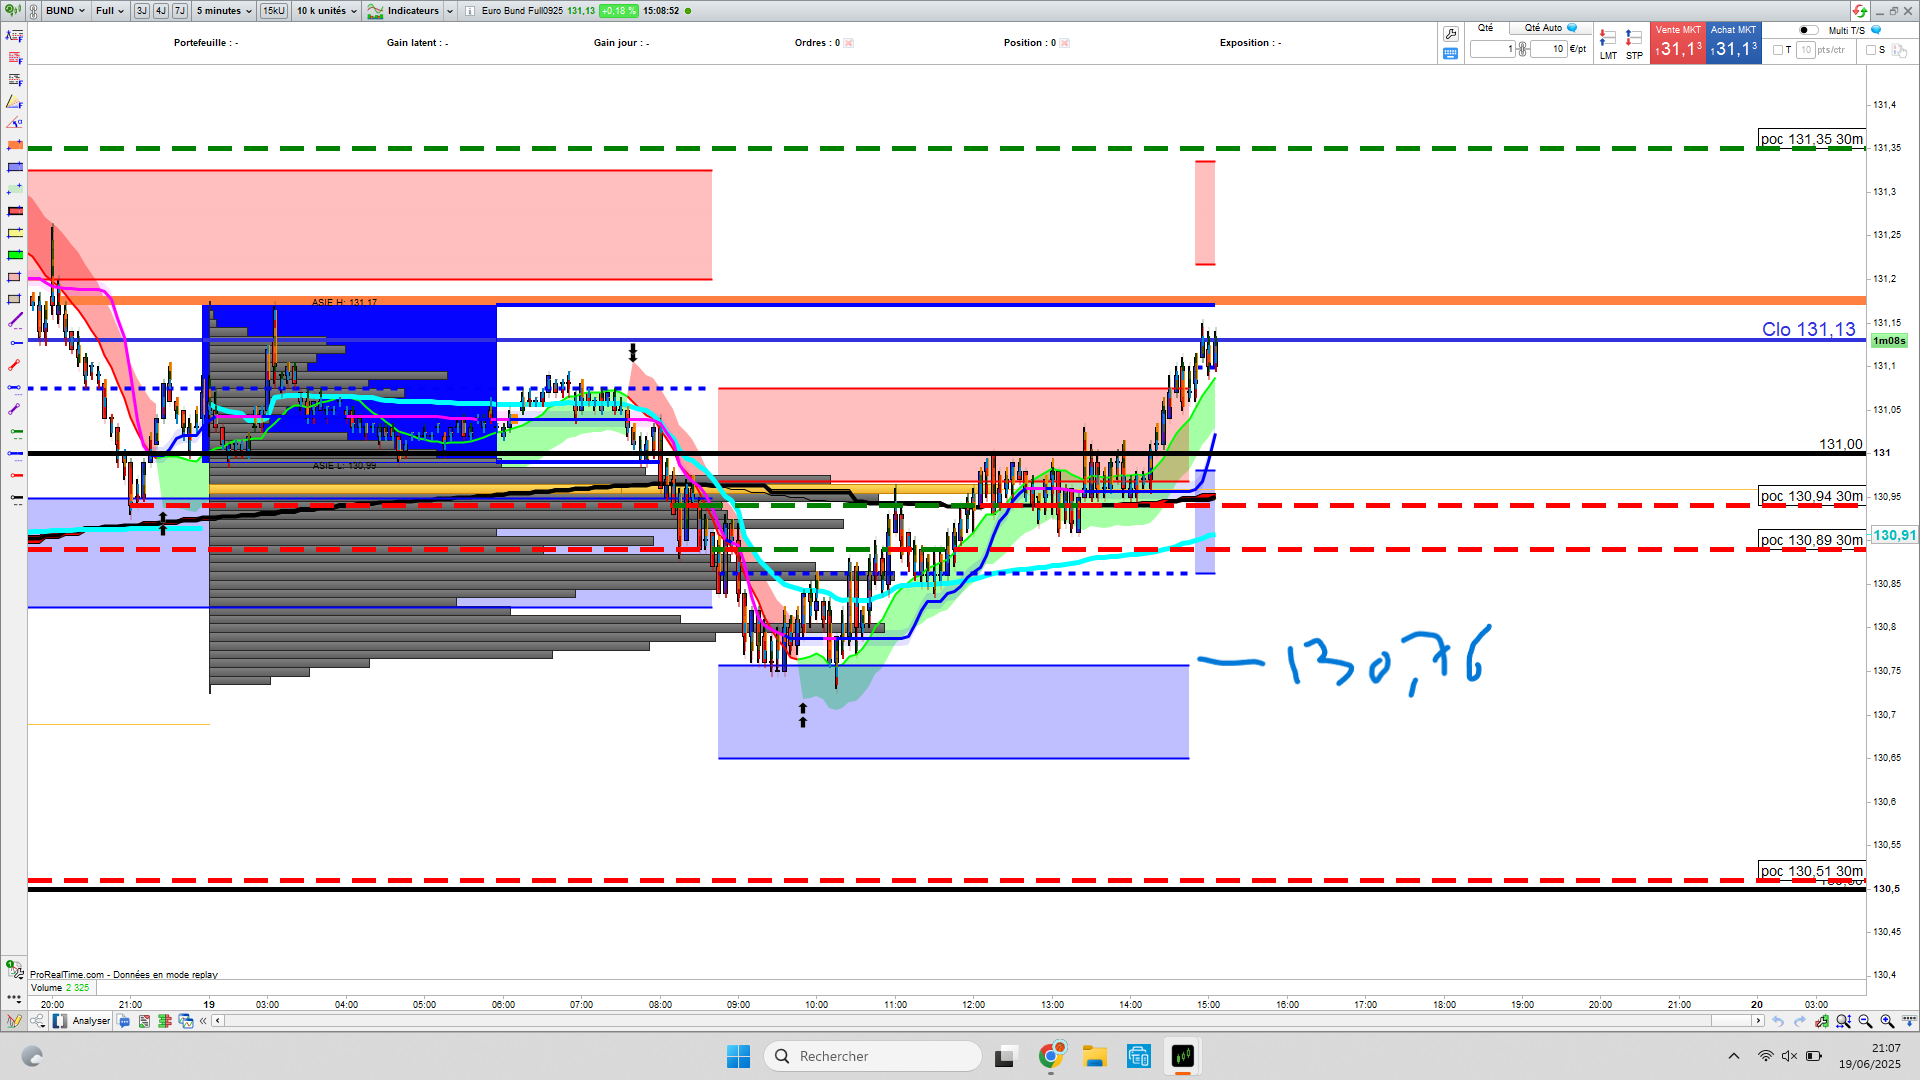
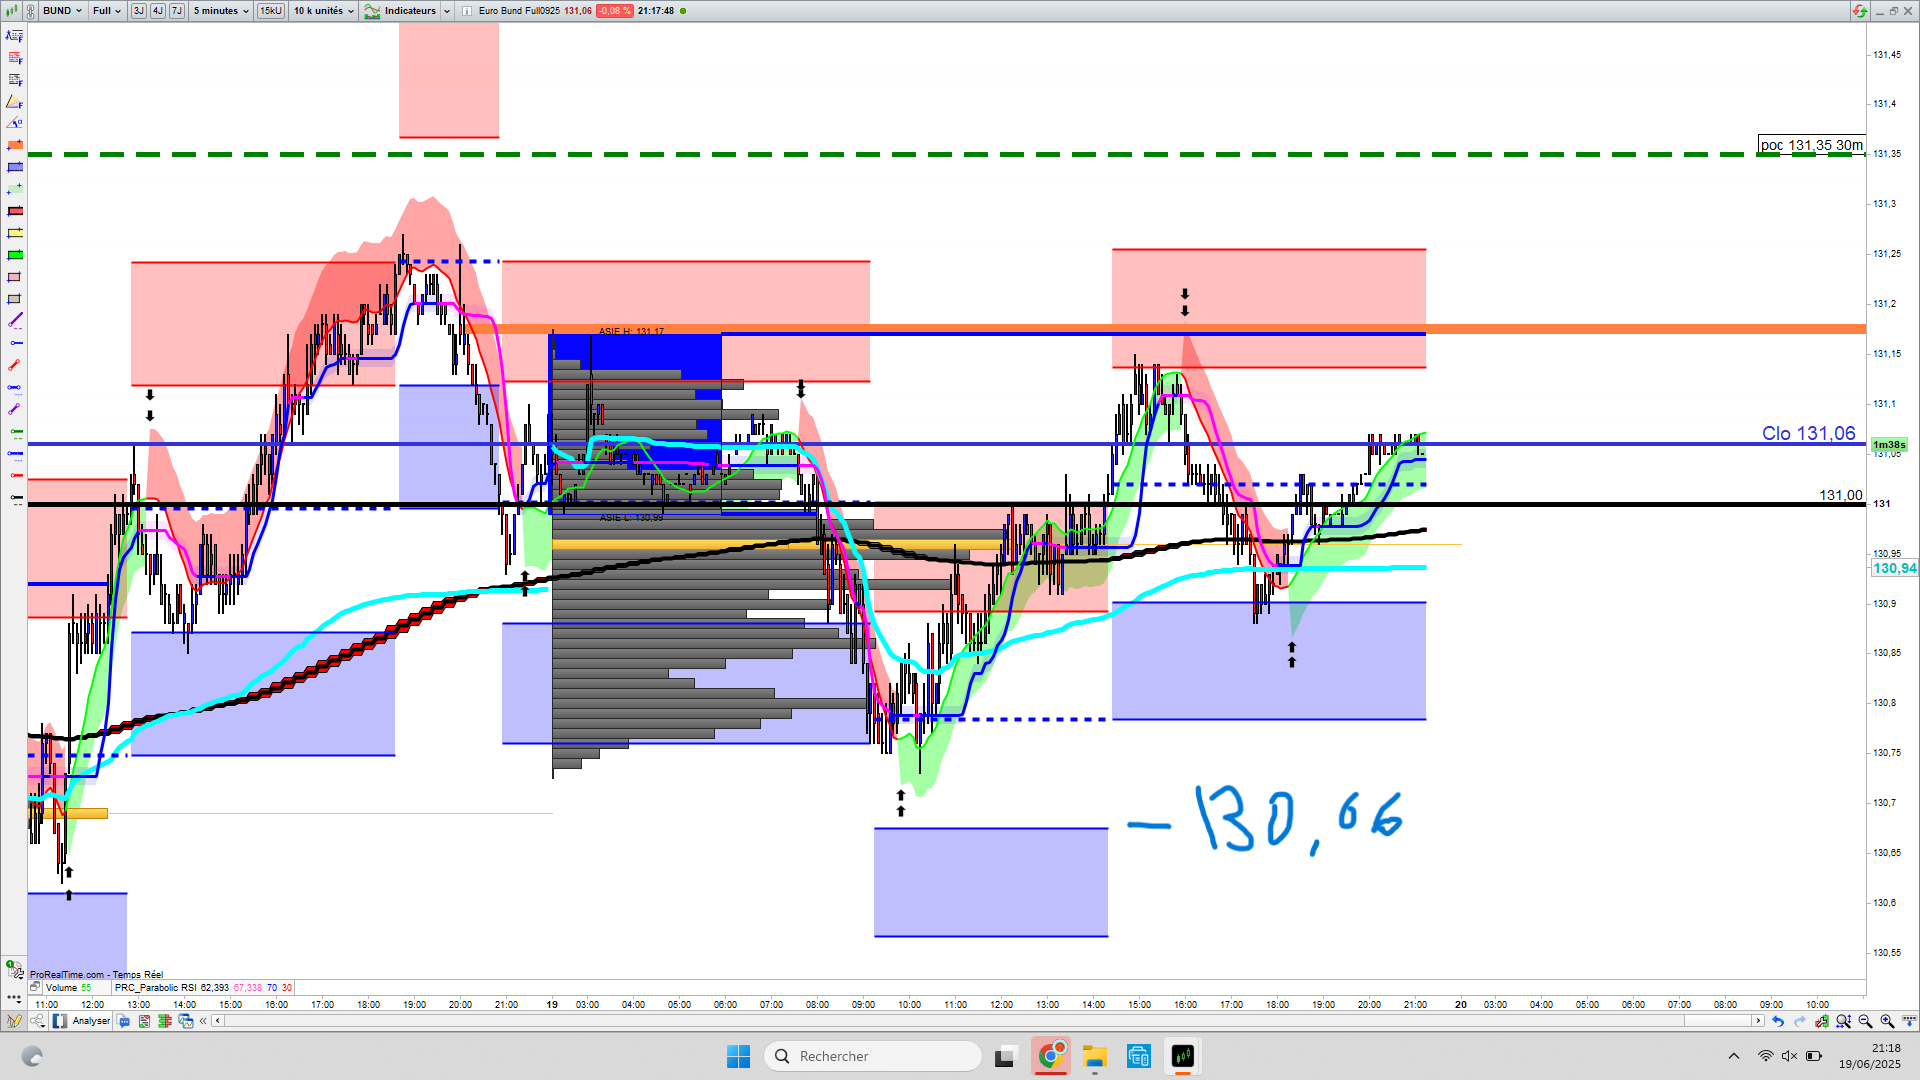
sur le premier graphique qui est celui du réel car j’ai pris des positions dessus on a des zones bien définis, dont 130.76 sur lequel
j’ai pris un achat. Quel fut pas ma surprise le soir en voyant ces zones complètements différentes de la journée.
et ce que cet indicateur ne redessinerait-il pas ?
Bonjour.
Le comportement que vous observez ne correspond pas à un “repeint en temps réel” classique, mais plutôt au fait que l’indicateur part d’une valeur initiale de avg qui dépend de la première donnée chargée sur le graphique. Comme à la ligne onze avg = src, la valeur de avg est initialisée avec le close de la première bougie chargée ; si aujourd’hui vous commencez à partir du 1er juin et que demain seules les données à partir du 2 juin sont chargées, le point de départ sera différent.
Cela implique que le premier croisement significatif de src – avg > atr se produira à un moment différent (puisque le avg initial est différent), et comme l’algorithme est séquentiel (type “cascade”), les niveaux dérivés (prR1, prR2, etc.) sont générés à des moments différents et avec des valeurs également différentes.
C’est un effet inévitable lorsque l’on utilise une logique séquentielle qui part d’un état initial variable. Si vous souhaitez l’éviter, vous devriez fixer un point d’ancrage constant (par exemple, en forçant la valeur initiale de avg à une valeur fixe par jour ou par session) ou bien contrôler à quel moment avg peut être mis à jour.
Pour éviter ce comportement, j’ai introduit une condition qui définit un point de départ fixe afin que le calcul de avg et des niveaux associés ne soit effectué qu’à partir d’une date précise (startDate). Avant cette date, les variables restent undefined pour empêcher une initialisation incorrecte.
startDate = 20250606
IF opendate <= startDate THEN
    avg = undefined
    prR2 = undefined
    prR1 = undefined
    prS1 = undefined
    prS2 = undefined
ELSE
    // Indicator
ENDIF